Photoemission Line shape Study on La0.7Sr0.3Mn1-δAlδO3 ( = 0, 0.03, 0.06)
Abstract
We have studied the line shapes of ultraviolet photoemission spectra of La0.7Sr0.3Mn1-δAlδO3 ( = 0, 0.03, 0.06) systems to test the extrinsic image charge screening effect on photoemission spectra recently suggested by R. Joynt (Science 284, 777 (1999)), who argued that the photoemission spectrum near the Fermi energy, specially for poorly conducting system, can be very different from the intrinsic density of states because the outgoing electron has probability of losing its kinetic energy due to the image force. We tested this argument in real materials experimentally by measuring the photoemission line shapes of La0.7Sr0.3Mn1-δAlδO3 systems, for which all the requirements of this theory are satisfied and sample resistivities change systematically. We found that experimental photoemission spectra do not show the change of line shapes expected from the extrinsic image force effect and we conclude that the influence of this long range interaction is not so large as suggested in that paper.
pacs:
PACS numbers: 79.60.-i, 82.80.Pv, 75.30.VnI Introduction
Photoemission Spectroscopy (PES) has been widely considered as the most powerful tool for probing the electronic structure of the occupied states in condensed matter systems. Conventionally photoemission process is explained by a three-step model[4] which involves (1) the excitation of the photoelectron, (2) its travel to sample surface, and (3) the escape through the surface into the vacuum. This simple model, though it is a purely phenomenological approach and has some short-comings due to its semi-classical nature, has proved to be quite successful in explaining many features in photoemission spectra.
Recently, R. Joynt[5] has suggested that more careful consideration is needed in the third step, where the outgoing electron experiences an attractive interaction due to its image charge in the sample part during its travel from the sample to the analyzer, so can lose its kinetic energy with some probability distribution. Moreover it was argued that this long range interaction effect should appear most drastically when the sample resistivity is rather high (roughly ), which is based on his calculation results of energy loss probability distribution and some fitting parameters taken from experiments. The argument of Ref. 2 is so timely that many photoemission spectroscopists pay attention to this assertion because the currently much-studied materials such as high-Tc superconductors[6] and colossal magnetoresistance (CMR) materials[7] show so-called pseudogap features and this theory looks like a master key to interpret these phenomena, especially for the case of CMR manganites.
Though this argument certainly contains some elements that should be considered seriously, there are different opinions and opposing views. D. S. Dessau et al.[8] gave a technical comment that their angle-resolved photoemission (ARPES) of single crystalline double layered manganite La1.2Sr1.8Mn2O7 shows the momentum-dependent pseudogap feature, which could not originate from the extrinsic loss in Ref. 2 because the extrinsic loss should not change much with momentum. Recently Y.-D. Chuang et al.[9] gave a new explanation about the pseudogap of this double layered manganite that it originates from a short range charge/orbital density wave enhanced by Fermi surface nesting. D. L. Mills[10] followed up the approach of Ref. 2 with his own calculations to give different results using the sum rule which determines the total amount of energy loss probability, and suggested that the extrinsic loss just shifts the kinetic energy of all photoelectrons downward by roughly the same amount in the usual photoemission experiments. Schulte et al.[11] presented several arguments, both theoretical and experimental, that the zero energy loss probability is not so small as was assumed in Ref. 2. They also obtained from their electron energy loss spectroscopy (EELS) spectra of double layered manganite La1.2Sr1.8Mn2O7 to calculate PES spectra and compare them with the photoemission spectra. From these comparisons they asserted this extrinsic effect cannot make pseudogap-like feature in photoemission spectrum as long as is different from zero, and in most cases can be either neglected or treated as a weak structureless background. In the recent preprint[12], R. Haslinger et al. gave quantitative criterion when ohmic losses are important and pointed out the layered manganite La1.2Sr1.8Mn2O7 is not a good candidate for testing the theory of inelastic processes in PES because its resistivity is too high and its crystal structure is not cubic. The present responses to Ref. 2, both theory and experiment, are somewhat critical. However, more experimental results are needed. Since many strongly correlated materials lie close to a metal-insulator phase transition and possess a large resistivity, determining whether the argument of Ref. 2 is correct becomes important. Furthermore, as far as we know, though a few indirect evidences were reported as briefly described above, there are no reports that give the direct experimental comparison and analysis about the relation between the resistivity and line shape of PES. In addition, previously studied system might be inadequate for this test as claimed in Ref. 9. In this paper, we choose the most adequate system and provide such direct experimental evidence in order to test the hypothesis of Ref. 2, which is important for the reliability of the information extracted from PES experiment.
To study more thoroughly how the sample resistivity affects the line shapes of photoemission spectra, we chose cubic perovskite La0.7Sr0.3Mn1-δAlδO3 ( = 0, 0.03, and 0.06) systems. The transport properties of Al-doped La0.7Sr0.3MnO3 were well studied by Y. Sawaki et al.[13]. According to their reports, when a small amount of aluminum is doped in La0.7Sr0.3MnO3 it substitutes B site (Mn) element without any structural transition. Aluminum ion has the closed-shell configuration with no electrons, so it gives the same valence as the host manganese (+3) and no magnetic moments. Hence aluminum doping induces only two kinds of changes. One is the increase of random electrical potential, and the other is the local cutoff of magnetic interaction between the spins of electrons, i.e. it increases magnetic randomness. These changes are enough to cause a resistivity change of two orders of magnitude from = 0 to = 0.06. The useful property most relevant to our study is the first one. Because the dopant aluminum gives three electrons it does not change the hole concentration of La0.7Sr0.3MnO3 . Thus the increase of resistivity with increasing dopants is solely due to the increase of the carrier scattering rates as a result of the increased randomness in potential. This simplifies the analysis of the data in the model of Ref. 2 dramatically. In most cases, there are too many parameters to consider when a systematic study is undertaken to understand how the sample resistivities affects the line shapes of the photoemission spectra. For example, the temperature dependent resistivity variation can come about not only from the change of the scattering rate but also from the changes of the carrier concentration or the electronic structure originating from phase transition[11]. (Recall in Drude model the DC conductivity is given by , where is carrier concentration, and relaxation time, m∗ effective mass.) But in our case, all the parameters are fixed except for the scattering rate of carriers (or inversely relaxation time ).
According to the calculations in Ref. 2, photocurrent intensity is given by
| (2) | |||||
, where[14]
| (3) |
with the normalization condition
| (4) |
Here, is the zero energy loss probability, the probability of losing the kinetic energy , the temperature independent density of states(DOS), the Fermi-Dirac distribution function, the conductivity, the dielectric function. To apply these formulae to the manganites, the Drude model was used with additional parameter following the approach of Ref.2 :
| (5) |
for the dielectric function. Here represents the relative strength of the frequency-independent part compared with Drude part in the conductivity. This parameter is somewhat artificial and its physical origin is not yet well understood, but inclusion of this parameter makes a sloping line shape often observed in PES. In this paper we will assume that the above scheme is suitable for describing the line shapes of PES for manganites and test if it describes the experimental line shapes of samples with different resistivities consistently.
II Experiment
High quality polycrystalline specimens of La0.7Sr0.3Mn1-δAlδO3 ( = 0, 0.03, 0.06) were made by the standard solid state reaction method. Stoichiometric amounts of high purity ( 99.99 %) LaO, SrCO, AlO, and MnO powders were weighed and mixed with a pestle and a mortar. After calcining and grinding repeatedly, resulting powders were pressed into a pellet. Three pellets of La0.7Sr0.3Mn1-δAlδO3 ( = 0, 0.03, 0.06) were prepared together. And, they were finally sintered at 1440∘C for 24 hrs and slowly cooled in air. We applied the identical synthesis condition for all the samples investigated. We cut each sintered pellet into two pieces, one for transport measurement and the other for photoemission spectroscopy. The resistivities were measured by the conventional four probe method. The photoemission spectra were taken with VG Microtech CLAM-4 multi-channeltron electron energy analyzer with the energy resolution of 40 meV full width at half maximum (FWHM) at Seoul National University under the base pressure of torr. Photon source was unmonochromatized He I line ( = 21.2 eV). The samples were cooled down to 95 K with liquid nitrogen and were fractured in situ to obtain a clean surface at that temperature by means of a top post. We obtained the spectra within one hour after the cleave, and checked the surface contamination by taking the valence band spectra.
III Results and Discussion
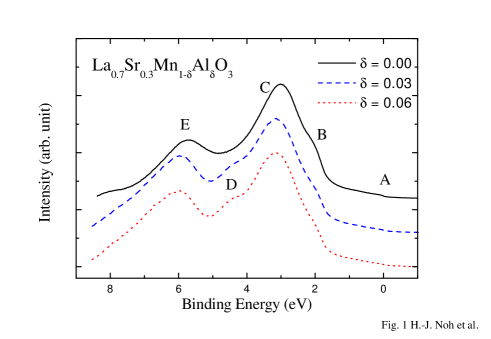
Figure 1 shows the angle integrated photoemission spectra up to 9 eV binding energy of La0.7Sr0.3Mn1-δAlδO3 for three doping cases = 0, 0.03, 0.06. Several prominent features can be seen in the spectra and are labeled as A, B, C, D, and E as shown in the figure. Two peaks A and B are strongly hybridized Mn and states with O 2 states. Peak C is usually assigned to O nonbonding states and peak E to Mn - O 2 bonding states[15][16]. Peak D around 4.5 eV in =0.03 and 0.06 cases is thought to originate from Al 3 impurities. The overall shapes are very similar to one another and to those of previously published spectra for [17] and [18]. But small doping effects are clearly seen in several points. The position of peak E is slightly shifted to higher binding energy side and a small peak D appears around 4.5 eV as Al is doped. The apparent position change of peak E is thought to come from the change of relative concentration of and ions. Since ion replaces site, the spectral weight due to sites will be reduced upon Al doping, which should lie at lower binding energy than because of correlation energy. The O nonbonding states (peak C) show almost no change, as expected. Mn (peak B) and states (peak A), which are more intimately involved in the transport properties of manganites, are also clearly seen around 2 eV and Fermi level and seem to be identical to undoped case[19]. From these spectra we infer that the overall electronic structures do not change much with doping and consistent with the results of structural and transport study by Y. Sawaki et al.[13]. This is a strong evidence that the increase of resistivity is not due to the change of electronic structure or phase transition, but due to the increase of scattering rates of carriers. We note that for the doped samples, specially = 0.06, the resistivity is fairly high (see the inset of Fig 3) and the estimated electron mean free path is comparable to the unit cell spacing[21]. In spite of this fact, resistivity curve and PES data show doped samples are still metallic. This behavior is similar to the cases of A3C60 (A = K, Rb), La1.85Sr0.15CuO4, and Sr2RuO4[22], where its physical origin is currently under active debate.
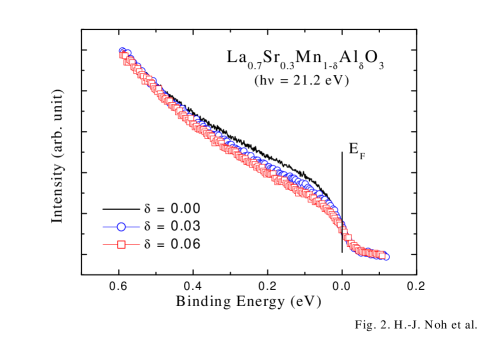
To study the relation between the line shape of PES near the Fermi energy () and the sample resistivity, we obtained the photoemission spectra near the Fermi level in detail. These spectra are shown in Fig. 2. Each spectrum is normalized to the height at 0.6 eV below the Fermi level. We can see clearly the slight decrease of the spectral weight of ”Mn band” as Al is doped, which is as expected. Because the atomic cross section of O is about one order of magnitude larger than that of Mn at =21.2 eV[23], most of the spectral weight change near reflects the O 2 characters mixed in the Mn bands. Even though the sample resistivity changes by about two orders of magnitude, the whole line shapes remain very similar to one another, and only small change of PES spectra is detected. This result seems to be quite different from the expectation of the argument of Ref. 2, as discussed below in more detail.
First of all, we must check whether the resistivity of our samples covers the valid region for the test of this theory. According to a recent report[12], there are two inequalities that should be satisfied by samples for the extrinsic effect to be important in PES. For our experiments with the values of the analyzer resolution R = 40 meV, band structure width of interest B = 1 eV, carrier concentration[24] under the assumption that the ratio of effective mass to bare mass of electron is order of 1, resistivity must lie in the region from 1 to 100 for ”insulator regime” and from to for ”metallic regime” to meet this criterion. Clearly, our samples pass through these regions (see table I). So the fact that we observe nearly no change of PES line shape in our spectra is quite surprising if significant extrinsic effect does exist.
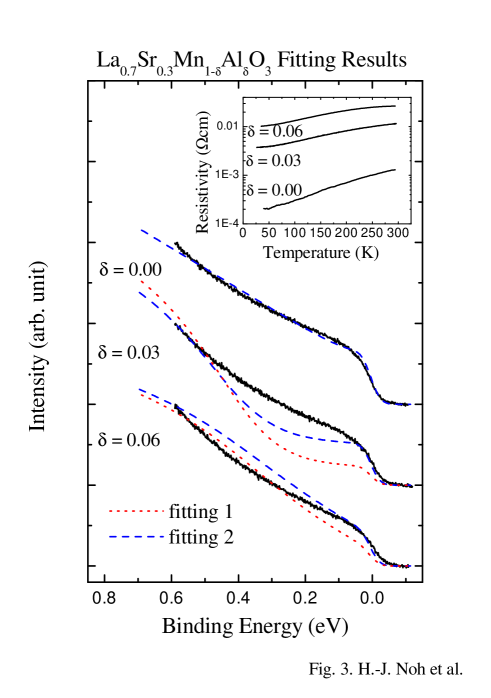
To compare the experimental results and the theoretical expectation based on the argument of Ref. 2, we try to fit the spectrum of undoped sample with the theoretical formula (1) by adjusting parameters and under the assumption of a constant DOS as in Ref. 2. This comparison is thought to be a good estimation on how reasonable the model calculation is. From this fit, we determine the values of parameter and as well as . Since in the Drude model, we expect its value to remain the same for Al-doped samples as well. In addition, there are no physical reasons for and values to change significantly with small Al-doping[26]. Hence we calculate the line shape of PES for the other two doped samples using formula (1) with the same values for , and , and compared with the experimental spectra. The results are displayed in Fig. 3 with the label of fitting 1. Here the calculated lines are convoluted with the experimental resolution of 40 meV in FWHM and the height of spectra are adjusted to coincide with the experiment around 0.6 eV below the Fermi level.
For = 0 case, we are able to fit the experimental spectrum quite well with the line shape calculated from eq. (1) by proper choice of and values. The resulting fitting values are similar to those in Ref. 2 except the zero energy loss probability . Though in our fitting ( = 0.05) is much larger than that of Ref. 2 ( 0.0025), it is still too small in comparison with the estimated value from the sum rule derived by D. L. Mills[10] ( = 0.35) or electron energy loss spectra (EELS) taken by K. Schulte et al.[11] ( = 0.82). For = 0.03 and 0.06 cases, we can see that the photoemission line shapes calculated from eq. (1) with the same parameter values show severe discrepancies from those of experimental spectra. Note the behavior of resistivity dependence of calculated PES line shape. Even the small change of resistivity around 1 is expected to make large effect on the line shape. Other parameters give relatively weak dependence. This strong resistivity dependence of PES line shape in eq (1) suggests the possibility that the PES can give severely distorted information about the density of states near Fermi level when the material under investigation is a poor conductor like manganites, if the extrinsic ohmic loss effect is indeed important.
The zero energy loss probability is assumed the same for all samples in fitting 1. In fitting 2, is also allowed to vary depending on -value to see if this gives better agreement with experiment, although we do not think should be so much dependent on sample resistivity. However, we see that the results of fitting 2 do not give significantly better agreement between theory and experiment than the case of fitting 1 even though we take as free parameter for each . All the parameter values used in the above analyses are tabulated in Table I.
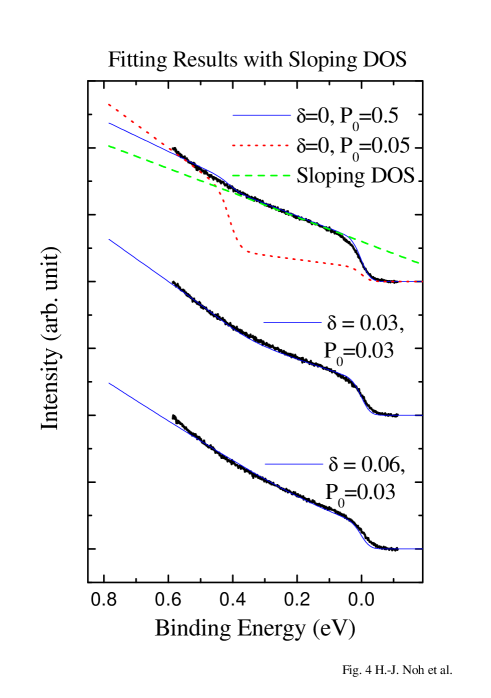
Next, we try to fit our data with the sloping DOS near . In this fit, we do not use the additional parameter because using both sloping DOS and makes the analysis too arbitrary. Figure 4 shows the results in detail. In this case, we can fit all the experimental spectra quite well, but the obtained parameter values seem to give another question. There is a big difference between the values of in doped sample and undoped ones. If we use a small value of for undoped sample, the calculated spectrum always shows the step-like feature around 400 meV binding energy. This is the effect of surface plasmon[5]. To remove this step-like feature in the calculated spectrum, value must be larger than 0.5 at least as seen in Fig 4. This abrupt change of value by more than one order of magnitude with small Al-doping is not expected judging from the EELS study of alloy semiconductor [27], and cannot be explained even if we include the multiple scattering process.
From our experimental results and fittings as stated above, we conclude that the experimental spectra do not show any symptom of significant ohmic loss effect, and the theoretical line shapes cannot reproduce experimental spectra for our series of manganite samples in a reasonable way without much conflict. Hence it seems clear that the long range Coulomb interaction between the outgoing photoelectrons and the sample left behind is not so large as was suggested in Ref. 2. Our fitting results show that the only way to explain the experimental spectra consistently is to increase the value rather large, and this means that we can regard the PES spectra near Fermi energy as the replica of the density of states in condensed matter whether its conductivity is good or not.
IV Conclusion
In summary, we presented an experimental evidence that the theory suggested in Ref. 2 cannot explain consistently the behaviors of photoemission spectra for a series of systems in which resistivities vary systematically. Hence we conclude that the influence of this long range Coulomb interaction is not so large as can distort the photoemission line shape significantly.
Acknowledgements.
This work was supported by the Korean Science and Engineering Foundation through Center for Strongly Correlated Materials Research (CSCMR) at Seoul National University. KHK was also supported by the BK-21 Project of the Ministry of Education.REFERENCES
- [1] Present address is National High Magnetic Field Laboratory, MS E536 Los Alamos National Laboratory NM 87545
- [2] Present address is Randall Laboratory of Physics, University of Michigan, Ann Arbor, MI48109
-
[3]
Author to whom all correspondence should be addressed.
Electronic address: sjoh@plaza.snu.ac.kr - [4] See Photoelectron Spectroscopy, 2nd edited by Stefan Hüfner (Springer, Heidelberg, 1996), p. 244
- [5] Robert Joynt, Science 284, 777 (1999); R. Haslinger and R. Joynt, J. Electron Spect. Rel. Phenom. 117-118, 31 (2001)
- [6] A. G. Loeser, Z.-X. Shen, D. S. Dessau, D. S. Marshall, C. H. Park, P. Fournier, and A. Kapitulnik, Science 273, 325 (1996); H. Ding, T. Yokoya, J. C. Campuzano, T. Takahashi, M. Randeria, M. R. Norman, T. Mochiku, K. Kadowaki, and J. Giapintzakis, Nature 382, 51 (1996).
- [7] D. S. Dessau, T. Saitoh, C.-H. Park, Z.-X. Shen, P. Villella, N. Hamada, Y. Moritomo, and Y. Tokura, Phys. Rev. Lett. 81, 192 (1998).
- [8] D. S. Dessau and T. Saitoh, Science 287, 767a (2000). See also T. Saitoh, D. S. Dessau, Y. Moritomo, T. Kimura, Y. Tokura, and N. Hamada, Phys. Rev. B 62, 1039 (2000).
- [9] Y.-D. Chuang, A. D. Gromko, D. S. Dessau, T. Kimura, and Y. Tokura, Science 292, 1509 (2001).
- [10] D. L. Mills, Phys. Rev. B 62, 11197 (2000).
- [11] K. Schulte, M. A. James, P. G. Steeneken, and G. A. Sawatzky, Phys. Rev. B 63, 165429 (2001).
- [12] R. Haslinger and R. Joynt, cond-mat/0112061
- [13] Y. Sawaki, K. Takenaka, A. Osuka, R. Shiozaki, and S. Sugai, Phys. Rev. B 61, 11588 (2000); K. Takenaka, Y. Sawaki, and S. Sugai, ibid. 60, 13011 (1999).
- [14] The correct prefactor was derived by D. L. Mills[10]. In this paper, because is a free parameter, calculated line shape does not depend on the absolute value of the prefactor.
- [15] T. Saitoh, A. Sekiyama, K. Kobayashi, T. Mizokawa, A. Fujimori, D. D. Sarma, Y. Takeda, and M. Takano, Phys. Rev. B 56, 8836 (1997).
- [16] C.-W. Lee, Y.D. Zhao, H. Koh, H.-J. Noh, J.-H. Park, H.-D. Kim, and S.-J. Oh, to be published.
- [17] T. Saitoh, A. E. Bocquet, T. Mizokawa, H. Namatame, A. Fujimori, M. Abbate, and Y. Takano, Phys. Rev. B 51, 13942 (1995).
- [18] J.-H. Park, C. T. Chen, S-W. Cheong, W. Bao, G. Meigs, V. Chakarian, and Y. U. Idzerda, Phys. Rev. Lett. 76, 4215 (1996).
- [19] J.-H. Park, E. Vescovo, H.-J. Kim, C. Kwon, R. Ramesh, and T. Venkatesan, Phys. Rev. Lett. 81, 1953 (1998).
- [20] K. H. Kim, J. Y. Gu, H. S. Choi, D. J. Eom, J. H. Jung, and T. W. Noh, Phys. Rev. B 55, 4023 (1997); S. Lee, H. Y. Hwang, B. I. Shraiman, W. D. Ratchliff II, and S-W. Cheong, Phys. Rev. Lett. 82, 4508 (1999).
- [21] The resistivity of polycrystalline manganites is always higher than that of single crystials due to the intergrain tunneling effect.[20]. To estimate the mean free path, intragrain conductivity must be used, which can be obtained from single crystal sample[13]. Under the assumption of a spherical Fermi surface, the mean free path is given by if the Drude formula is used. Taking [24], we obtain Å. Here, means the resistivity in unit. If we take = 0.3 for = 0.06 sample, = 7.5 Å, which is close to the unit cell spacing 8 Å.
- [22] J. G. Hou, L. Lu, V. H. Crespi, X.-D. Xiang, A. Zettl, and M. L. Cohen, Sol. Stat. Comm. 93, 973 (1995); O. Gunnarsson, Rev. Mod. Phys. 69, 575 (1997); V. J. Emery, S. A. Kivelson, Phys. Rev. Lett. 74, 3235 (1995); G. Cao, S. McCall, M. Shepard, J. E. Crow, and R. P. Guertin, Phys. Rev. B 56 R2916 (1997)
- [23] J. J. Yeh and I. Lindau, Atomic Data and Nuclear Data Tables 32, 1 - 155 (1985).
- [24] A. Asamitsu and Y. Tokura, Phys. Rev. B 58, 47 (1998).
- [25] for example, J. H. Jung, K. H. Kim, T. W. Noh, E. J. Choi, and Jaejun Yu, Phys. Rev. B 57, R11043 (1998); Y. Okimoto, T. Katsufuji, T. Ishikawa, T. Arima, Y. Tokura, Phys. Rev. B 55, 4206 (1997)
- [26] If we consider multiple scattering process, the sum rule[10] does not hold, and can change with Al doping because the dopant Al cause the change of dielectric constant in our system through the change of relaxation time. However, its dependency cannot be strong under the condition of no structural transition and constant carrier concentration, which is consistent with EELS experiments on [27]. In the case of value, it represents the incoherent part of optical conductivity, which is almost constant below 0.1 eV in infrared spectroscopy data. There is no clear reason why this incoherent part must be affected by the increase of scattering rates of carriers. Furthermore, many results of optical conductivity of manganites[25] indicate that the incoherent part will remain almost the same with small Al doping since the electronic structure does not change and the carrier concentration and temperature are fixed in this study.
- [27] P. A. Thiry, M. Liehr, J. J. Pireaux, and R. Caudano, J. Vac. Sci. Technol. A 4, 953 (1986).
| (mcm) | (1/sec2 ) | (fit 1) | (fit 2) | (sloping DOS) | ||
|---|---|---|---|---|---|---|
| 0.00 | 0.29 | 0.25 | 0.05 | 0.05 | 0.5 | |
| 0.03 | 4.8 | ” | ” | ” | 0.12 | 0.03 |
| 0.06 | 13.0 | ” | ” | ” | 0.10 | 0.03 |