Adsorption in non interconnected pores open at one or at both
ends:
a reconsideration of the origin of the hysteresis phenomenon.
Abstract
We report on an experimental study of adsorption
isotherm of nitrogen onto porous silicon with non interconnected
pores open at one or at
both ends in order to check for the first time
the old (1938) but always current idea
based on Cohan’s description which suggests that the adsorption
of gas should occur reversibly in the first case and irreversibly
in the second one. Hysteresis loops, the shape of which is usually
associated to interconnections in porous media, are observed whether
the pores are open at one or at both ends in contradiction with Cohan’s model.
pacs:
PACS numbers: 68.43.-h, 61.43.Gt, 64.70.Fx, 05.70.NpAdsorption isotherms in mesoporous materials exhibit two main typical features: (i) a sharp increase in the amount of gas adsorbed at pressure below the saturated vapor pressure of the bulk gas which is attributed to capillary condensation in pores of confining sizes; (ii) the desorption process fails to retrace the path of the adsorption one, so that a hysteresis loop appears revealing the irreversibility of the phenomenon.
The first explanation of the capillary condensation was proposed by Zsigmondy [1] who, for this purpose, refered to the macroscopic Kelvin equation. In order to explain the hysteresis phenomenon, Cohan [2] went further and proposed different scenari for filling and emptying of a pore which he also described with the macroscopic concept of meniscus. In a cylindrical pore open at both ends, the shape of gas/adsorbate interface is different during the adsorption and desorption processes leading to a hysteresis phenomenon. On the contrary, in a cylindrical pore closed at one end, the adsorption is reversible since the same meniscus is present during the filling and the emptying of the pore.
The irreversibility of the adsorption process in a cylindrical pore open at both ends, expected by Cohan on the basis of thermodynamic considerations, has been predicted by new numerical approaches. Thus, Grand Canonical Monte-Carlo (GCMC) simulations [3], analytical approaches [4] together with Density Functional Theory (DFT) [5] have also proposed that the hysteresis phenomenon is an intrinsic property of the phase transition in a single idealized pore and arises from the existence of metastable gas-like and/or liquid-like states. It is noteworthy that no calculations have been yet performed for cylindrical pores closed at one end.
Macroscopic descriptions based on Cohan’s model are currently used to describe the adsorption in non interconnected mesoporous media and in particular to determine the Pore Size Distribution (PSD) via the Barrett-Joyner-Halenda (BJH) method [6].
However, the experimental validation of Cohan’s model has never been checked since the synthesis of ordered mesoporous media with non interconnected pores open at one or at both ends was unsuccesful for a long time. Using porous silicon, we report in this paper, for the first time, on an experimental investigation of Cohan’s predictions. For this check, this mesoporous material exhibits two essential properties: (i) the tubular pores are non interconnected and do not exhibit narrow sections and (ii) it exists under two forms with pores closed at one end when the porous layer is supported by the substrate or open at both ends when the layer is removed from the substrate.
Porous silicon is prepared by electrochemical etching of Si
single crystal in a HF solution. The morphology of the porous Si
layers depends on the type and concentration of the dopant
atoms [7]. The adsorption studies presented here have
been performed with porous layers prepared from highly boron doped
[100] Si substrate. The porosity of the layers is controlled
by the current density and HF
concentration, and the thickness by the duration of the anodic
dissolution. The pore volume is determined with high precision by
weighting the sample before and after the electrochemical dissolution.
To calibrate the porosity and the thickness of the layer we need a
third weighing after the dissolution of the porous part in a
NaOH solution. It is noteworthy that the porous
layers are perfectly reproduced. The porous layers under study
had a porosity of 51% and the length of the pores is
21 m.
The morphology of these layers (see
Fig. 1(a) and 1(b)) can be described as honeycomb-like
structure with pores perpendicular to the Si substrate separated
from each other by Si single crystal walls (inset Fig. 1(b))
of constant thickness ( 5 nm).
The pores, with sections of polygonal shape, are of the same length and
closed at one end by the Si substrate. At the end of the porous
layer formation which takes about 20 minutes, an increase of the
current density
leads to the electropolishing regime during which the Si walls at
the bottom of the pores are dissolved so that the porous layer comes off the
Si substrate. It is noteworthy that such a process takes only a few
seconds and thus that the PSD of the porous layer is not changed.
Playing with this possibility, porous Si layer or
porous Si membrane can be obtained with pores open at one or at both
ends, respectively.
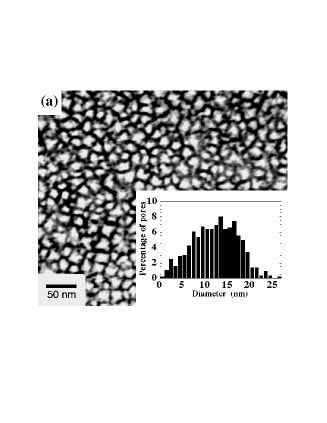
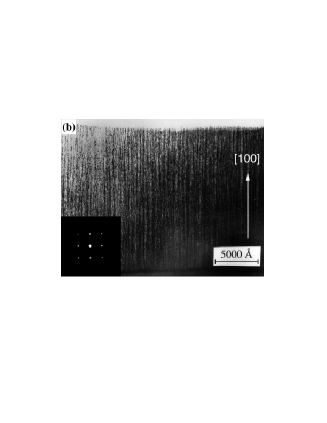
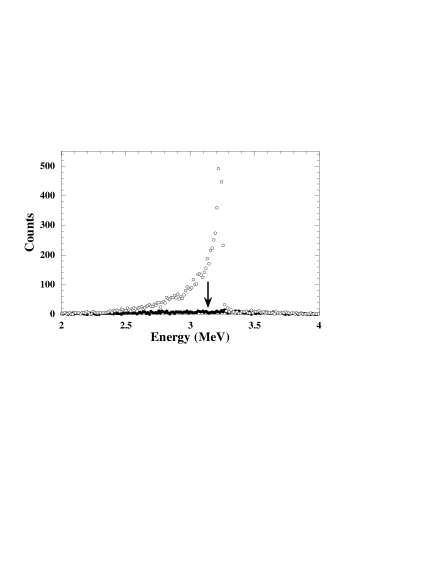 FIG. 2.: spectra from (p,): = 629 keV. White circles: porous Si layer after thermal
oxidation in (). Black circles:
part of the layer protected by Al cap (). The arrow
indicates the energy of the expected peak from .
Another important property of this medium is the constancy
of the Si walls thickness
revealed by the TEM plane view performed on a porous layer thinned
down to 1000 Å, i.e. about 10 times the size of the pores.
This is a strong argument against the presence of narrow sections inside the
pores, the presence of which would lead, through
shadow effects, to an inhomogeneous apparent thickness of the Si
walls.
FIG. 2.: spectra from (p,): = 629 keV. White circles: porous Si layer after thermal
oxidation in (). Black circles:
part of the layer protected by Al cap (). The arrow
indicates the energy of the expected peak from .
Another important property of this medium is the constancy
of the Si walls thickness
revealed by the TEM plane view performed on a porous layer thinned
down to 1000 Å, i.e. about 10 times the size of the pores.
This is a strong argument against the presence of narrow sections inside the
pores, the presence of which would lead, through
shadow effects, to an inhomogeneous apparent thickness of the Si
walls.
The PSD of the porous Si layers have been estimated from a numerical treatment of the TEM images. The negative TEM photographs are digitized by means of a CCD monochrome camera. Then, the value of the threshold to make the image binary is chosen to reproduce the porosity of the sample. The analysis of this binary image allows one to obtain the cross section area and perimeter of each pore. The PSD, which corresponds to cylindrical pores having the same surface area as the polygonal pores, is shown in inset of Fig. 1(a). The mean diameter of the pores is 13nm with a standard deviation of 6nm.
Adsorption measurements were made by a volumetric technique using
a commercial apparatus under secondary
vacuum of around torr. Nitrogen adsorption isotherms were
measured up to the saturating vapor pressure of bulk
nitrogen (P0) and at 77 K. Porous Si
layers were introduced in a cell just after
their preparation. The samples were outgassed at ambient
temperature for a few hours. This outgassing does not change the nearly
complete passivation of the inner surface by a monolayer
of groups which takes place during the
electrochemical etching
and which is stable for a few days after the formation
[7].
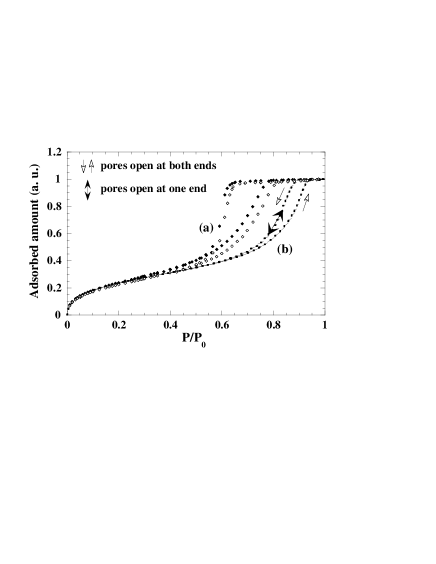 FIG. 3.: (a) N2 adsorption isotherms at 77K for porous Si with
pores open at one (black diamonds) or at both (white diamonds) ends.
(b) Isotherms calculated by introducing in Eqs. (1)
and (2) the experimental t() values (see
text) and the PSD
shown in Fig. 1.
FIG. 3.: (a) N2 adsorption isotherms at 77K for porous Si with
pores open at one (black diamonds) or at both (white diamonds) ends.
(b) Isotherms calculated by introducing in Eqs. (1)
and (2) the experimental t() values (see
text) and the PSD
shown in Fig. 1.
Figure 3(a) shows N2 adsorption isotherms at 77 K corresponding to porous Si layers with pores open at one or at both ends, the PSD of which is represented in inset of Fig. 1(a). These two curves exhibit wide and asymmetrical hysteresis loops with shapes corresponding to type H2 with reference to the 1985 IUPAC classification (or type E in that of de Boer [8]).
The adsorbed amount of gas sharply increases between 0.55 and 0.8 P0 and then reaches a plateau region where all the pores are filled with the dense phase. The steep desorption process occurs over a pressure range about three times narrower than that of the adsorption.
On the assumption that the density of the dense phase equals that of the bulk liquid nitrogen, we found that the pore volume extracted from the value of the adsorbed amount on the plateau region is in a very good agreement with that measured by gravimetry.
Cohan’s model predicts that, for a cylindrical pore open at both ends, the condensation takes place at a pressure given by an equation similar to the classical Kelvin equation where the curvature of the meniscus is replaced by a cylindrical curvature :
| (1) |
where VL is the molar liquid volume, is the liquid-gas surface tension at temperature T, r is the radius of the pore and t() the thickness of the adsorbed layer at P. In the case of a cylindrical pore closed at one end, surface thermodynamics considerations predict a preferential adsorption on the bottom of the pore; a hemispherical meniscus is then present provided that there is perfect wetting, so that the condensation occurs at a pressure given by the following modified Kelvin equation:
| (2) |
The evaporation of the wetting fluid proceeds through the same hemispherical meniscus in both cases i.e. at the same pressure .
Thus, according to Cohan’s model : (i) the adsorption phenomenon should be reversible in pore open at one end while it should be irreversible in pore open at both ends; (ii) the adsorption branch for a pore open at both ends should be located at a pressure () higher than that for a pore closed at one end (); (iii) for a given size distribution of cylindrical pores open at both ends, the adsorption branch should be steeper than that of the desorption branch (provided that the diameter exceeds 3-4 nm) and the shape of the hysteresis loop becomes rather symmetrical as the pore diameter increases, as shown by numerical calculations based on Eqs. (1) and (2) in which we have introduced a currently used t() proposed by Halsey [11, 12] or the t() reproducing our experimental values prior to the capillary condensation.
To extract the latter t() values, we have prepared a porous Si layer with a PSD having a mean value as high as possible (about 50 nm) in order to shift the capillary condensation pressures to the highest possible values. The obtained isotherm exhibits a hysteresis loop located above . We have thus determined the numerical values of t() up to by distributing homogeneously at each pressure the adsorbed amount among the pores, the PSD of which was extracted as explained above. In order to draw the t() above , we have chosen to extrapolate the polynomial law which fits the experimental t().
The isotherm calculated by introducing in Eqs. (1) and (2) the t() and the PSD shown in inset Fig. 1(a) is represented Fig. 3(b).
We will successively discuss the predictions (i) and (iii) which are in large discrepancy with the experimental results (Fig. 3(a)); the prediction (ii) which is in agreement with experiment and finally, the large shift between the absolute position of the experimental isotherms and the calculated ones.
(i) The adsorption-desorption cycle observed in the case of pores closed at one end is irreversible. The interconnectivity related pore blocking effect described by Mason [9] to explain the origin of the hysteresis phenomenon could not occur because the porous Si layers are composed of non interconnected pores. Moreover, we reject the ‘ink bottle’ effect, previously introduced by Everett [10], as a possible explanation of the hysteresis loop we observe on the adsorption isotherms because of the absence of narrow sections inside the pores.
(iii) The hysteresis loops observed in the porous layer and porous membrane exhibit the same shape of type H2. We have observed, by carrying out adsorption isotherms on porous Si layers with a PSD having mean values varying from 13 nm up to 50 nm, that the position on the pressure axis of the corresponding adsorption and desorption branches are shifted towards whereas the shape of the hysteresis loops remains of type H2.
Such an asymmetrical shape is not expected by the single pore models. Indeed, numerical calculations based on Cohan’s model or on DFT [13] predict a symmetrical shape of the hysteresis loop for such large pores in contradiction with what we observe. Furthermore, although porous Si exhibits non-interconnected pores, the hysteresis shape (type H2) we observe is the same as those systematically obtained for highly interconnected mesoporous solids such as controlled pore glass or Vycor [15]. From a theoretical point of view, both macroscopic [9] and microscopic [13] approaches described this shape as a signature of the disorder introduced by the interconnectivity between pores. We must conclude that a hysteresis loop of type H2 is not characteristic of interconnected porous materials and we thus reject a previous conclusion made by Ball and Evans according to which a de Boer’s shape of hysteresis is a consequence of interconnected network effect.
We believe that the desorption process we observe results from another effect. At the end of the adsorption process, when all the pores are filled by the dense phase, the external surface of the porous layer is covered by a film which connects the pores. A possible interpretation of the observed delay to the emptying of pores could be the absence of formation of a concave meniscus on top of each pore. Thus, question arises whether metastable states exist which would correspond to a flat interface between the film and gas. In such an idea, during the desorption process, the film thickness could decrease homogeneously until the system jumps to the stable state corresponding to a concave meniscus on top of each pore. The steepness of the desorption branch could be explained if the jump is sufficiently delayed until a pressure at which the emptying of the major part of pores occurs. This idea needs of course to be checked by numerical calculations.
Note that the analysis of the desorption branch using BJH method yields a PSD with a width 0.5 nm about which is very far from that of the actual PSD ( 6nm). It is conventionally admitted [16] that the desorption process in porous materials occurs at coexistence of the high and low dense phases. On such an assumption, a steep desorption branch is interpretated as the signature of the presence of pores of unique size[17]. Our results obviously show that it is not necessarily the case.
(ii) The sign of the relative positions of the two adsorption branches () is in agreement with Cohan’s model. These experiments reveal two different scenari for the filling of pores open at one or at both ends. Preferential adsorption in bottom of closed pores is confirmed by analytical calculations performed in an oblique corner formed by the intersection of two planar surfaces [18]. We are investigating pore closure effect on adsorption in cylindrical geometry by means of GCMC simulations and DFT calculations.
As shown in Fig. 3(b), the curve which corresponds to the modified Kelvin equation (2) is largely outside of the experimental hysteresis loops. For pore sizes as large as in our samples, this equation should account for the equilibrium phase transition. Indeed, microscopic calculations based on DFT performed by Ball and Evans [13] have shown that, in the case of a distribution of cylindrical pores open at both ends centered on 7.2nm, which is twice smaller than the mean size of our pores, the coexistence curve is located at a pressure which is close to that predicted by equation (2). To our knowledge, it is the first time that, for so large pore sizes, such a large discrepancy is found [19]. This may be due to the use of a cylindrical geometry in the calculations which do not account for the actual polygonal shape of pores. GCMC simulations and calculations based on the DFT are in progress.
In summary, we have studied adsorption phenomenon in porous Si medium, a well ordered material with tubular pores without narrow sections and for which we have experimentally proven the absence of interconnection. Hysteresis loops of type H2 are observed, and that, whether the pores are open at one or at both ends. These results are in contradiction with Cohan’s model and show that the only observation of hysteresis loop of type H2 is not the signature of the presence of interconnections in porous material as it is generally admitted. The steep desorption process cannot be described by the macroscopic Kelvin equation in which we introduce the experimental values of the thickness of adsorbed amount prior to the capillary condensation. We note that the application of the widely used BJH method to extract the PSD from this branch is not systematically justified.
REFERENCES
- [1] R. Zsigmondy, Z. Anorg. Allgem. Chem. 71, 356 (1911).
- [2] L. H. Cohan, J. Am. Chem. Soc. 60, 433 (1938).
- [3] A. Papadopoulou, F. Van Swol, U. Marini Bettolo Marconi and P. Tarazona, J. Chem. Phys. 97, 6942 (1992).
- [4] F. Celestini, Phys. Lett. A, 228 84 (1997).
- [5] R. Evans, U. Marini Bettolo Marconi and P. Tarazona, J. Chem. Phys. 84, 2376 (1986).
- [6] E. P. Barrett, L. G. Joyner and P. H. Halenda, J. Am. Chem. Soc. 73, 373 (1951).
- [7] A. Grosman and C. Ortega, in Structural and optical properties of porous silicon nanostructures, edited by G. Amato, C. Delerue and H.J. Von Bardeleben in Gordon and Breach Sc. Chap.11, pp. 317-332. Chap.13, pp. 375-408 (1997).
- [8] J. H. de Boer, in The structure and properties of porous materials, Eds. D. H. Everett and F. S. Stone, Butterworths, London, p.68 (1958).
- [9] G. Mason, J. Colloid Interface Sci. 88, 36 (1982).
- [10] D. H. Everett, in The structure and Properties of Porous Materials, edited by D. H. Everett, F. S. Stone, Proc. Tenth Symp. of Colston Research Society, London, p 95, J.A. Barker Ibid, p.125 (1958).
- [11] G. Halsey, J. Chem. Phys. 16 (10), 931 (1948).
- [12] S. J. Gregg and K. S. W. Sing, in Adsorption, Surface area and Porosity, Academic Press, London (1982).
- [13] R. P. Ball and R. Evans, Langmuir 5, 714 (1989).
- [14] B. Coasne et al., Phys. Chem. Chem. Phys. 3, 1196 (2001).
- [15] A. J. Brown, Thesis, Bristol (1963).
- [16] W. F. Saam and M. W. Cole, Phys. Rev. B 11, 1086 (1975).
- [17] S. Gross and G. H. Findenegg, Ber. Bunsenges. Phys. Chem. 101, 1726 (1997).
- [18] E. Cheng and M. W. Cole, Phys. Rev. B 41, 9650 (1990).
- [19] L. D. Gelb, K. E. Gubbins, R. Radhakrishnan and M. Sliwinska-Bartkowiak, Rep. Prog. Phys. 62, 1573 (1999).