Electron Paramagnetic Resonance Linewidths and Lineshapes for the Molecular Magnets Fe8 and Mn12
Abstract
We study theoretically Electron Paramagentic Resonance (EPR) linewidths for single crystals of the molecular magnets Fe8 and Mn12 as functions of energy eigenstates , frequency, and temperature when a magnetic field along the easy axis is swept at fixed excitation frequency. This work was motivated by recent EPR experiments. To calculate the linewidths, we use density-matrix equations, including dipolar interactions and distributions of the uniaxial anisotropy parameter and the Landé factor. Our calculated linewidths agree well with the experimental data. We also examine the lineshapes of the EPR spectra due to local rotations of the magnetic anisotropy axes caused by defects in samples. Our preliminary results predict that this effect leads to asymmetry in the EPR spectra.
pacs:
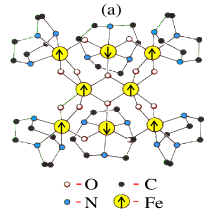
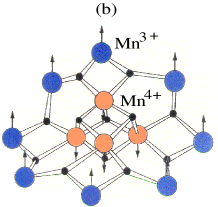
PACS numbers:75.45.+j,75.50.Xx,76.30.-vMolecular magnets such as [1] and [2] have recently drawn much attention because of the macroscopic quantum tunneling of their magnetizations at low temperatures [3] and their possible applications to quantum computing.[4] These materials consist of many identical clusters (see Fig. 1) with the same magnetic properties and characteristic energies. Each cluster has many different species of ions and atoms, with a total spin angular momentum in the ground state of . The clusters have strong crystal-field anisotropy and, thus, a well-defined easy axis, and the magnetic interaction between different clusters is weak.
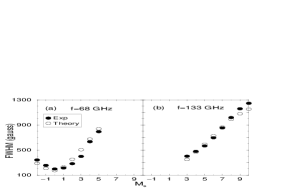
Recently, multi-frequency Electron Paramagnetic Resonance (EPR) measurements[5, 6, 7] on single-crystals of the molecular magnets Fe8 and Mn12 showed interesting results in the linewidths as functions of the energy level , excitation frequency, and temperature when a magnetic field along the easy axis was swept with the excitation frequency fixed. Figures 2(a) and (b) show the experimental linewidths as a function of the value of from which the spin system is excited. For example, 5 in Fig. 2(a) denotes the transition 54. The experimental results are that (i) the linewidths are about 200 G to 1400 G at 10 K for [Figs. 2(a) and (b)], and about 1000 G to 2000 G at 25 K for ; (ii) the linewidths increase non-linearly as a function of the absolute value of the energy eigenstate [Figs. 2(a) and (b)]; (iii) the linewidths attain a minimum at 1 and 0 [Fig. 2(a)]; (iv) the linewidths decrease with increasing frequency (compare the linewidth for 5 in Fig. 2(a) with that in Fig. 2(b)).
In this paper, we present the theoretical EPR linewidths for single crystals of Fe8 and Mn12, using density-matrix equations with the assumption that the uniaxial crystal-field anisotropy parameter and the Landé factor are randomly distributed around their mean values (“-strain” and “-strain” effects [8]) due to possible random defects and impurities in the samples. We find that the calculated linewidths [9] agree well with recent experimental data [6, 9] as functions of the energy level and the frequency. We also briefly consider the effect of the temperature on the linewidths. Finally we present a preliminary analysis of how local rotations of the magnetic anisotropy axes, caused by defects in the samples, affect the lineshapes.
To obtain the linewidths for , we consider a single-spin system with in a weak oscillating transverse field. We choose the easy axis to be the -axis. Since the clusters have an approximate symmetry, the lowest-order ground-state single-spin Hamiltonian is [10]
| (1) |
where and the transverse anisotropy parameter, 0.043.[6] Here is the -th component of the spin operator, is the Landé -factor (2), is the Bohr magneton, and is the longitudinal static applied field. When is large enough, the eigenvalue of , , is a good quantum number. Next we introduce an interaction between the spin system and an oscillating transverse field with angular frequency , where . We treat as a small perturbation to . The interaction between the spin system and the surrounding environment can be understood by density-matrix equations.[11]
We consider the case that the frequency is fixed while is quasi-statically varied to induce a resonance. With the selection rule , solving the density-matrix equations for the population change with time in the level due to , to first order in near resonance, provides the power absorption between the levels and : [11]
| (2) | |||||
| (3) | |||||
| (4) |
Here is the energy of the level , , is the density matrix of the spin system. The subscripts represent eigenstates of the longitudinal part of , , , , and is the transition rate [12] from the -th to the -th eigenstate, is the resonant field, and gives a natural linewidth which is about 5 to 50 G at 10 K and increases as decreases. However, the experimentally observed linewidths are much larger than the natural linewidths and decrease as decreases [Figs. 2(a) and (b)].
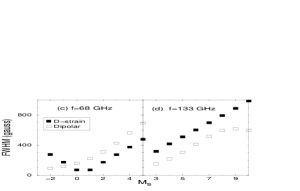
To resolve these large discrepancies, we first assume that and are independent random variables with Gaussian distributions centered at and , with standard deviations and , respectively. Then we calculate the average power absorption at a fixed frequency and by integrating over Eq. (2) using Mathematica [13] to obtain the linewidth as a function of . The lineshapes depend on the magnitudes of and , compared to the natural linewidth determined by . If and are much larger than (comparable to) the natural linewidth, then the lineshape is Gaussian (Lorentzian). At intermediate values of and , the absorption lineshapes are neither Gaussian nor Lorentzian. Our numerical calculations show that the distribution in narrows the linewidths linearly with decreasing absolute value of [Figs. 2(c) and (d)], with a slight rounding close to the linewidth minimum (1 and 0) [Fig. 2(c)]. On the other hand, the distribution in broadens the linewidths with decreasing because the resonant field increases with decreasing [see Eq. (4)].[5, 9] For small- transitions, the lineshapes are close to a Lorentzian because the natural linewidths are not very small compared to the measured linewidths.
Next, we consider the effect of the dipolar interactions between different clusters. (There is no distribution in cluster size.) The dipolar interactions narrow the linewidths as decreases because the resonant field becomes stronger for smaller- transitions, and the stronger resonant fields lead to a more polarized system [Figs. 2(c) and (d)]. The details of this effect on the linewidths at a fixed temperature were reported elsewhere.[9] The dipolar interactions give rise to a temperature dependence of the linewidths and a shift in the positions of the resonance lines, because at low temperatures () high energy levels are not populated. Our study shows that a linewidth for a particular transition increases and then smoothly decreases with increasing temperature. The maximum linewidth as a function of temperature moves towards lower temperatures for larger- transitions, which agrees with experiments.
The competition between -strain, -strain, and dipolar interactions determines the overall features of the linewidth, as a function of . We have varied , , and the effective distance between neighboring dipoles, , within an experimentally acceptable range in order to fit the experimental data.
For the sample examined, the calculated linewidths agree well with the experimental data at the measured frequencies (, 89, 109, 113, 133, and 141 GHz) at , using and . [Figs. 2(a) and (b)] As shown in Figs. 2(c) and (d), the -strain effect and the dipolar interactions are equally important for the linewidths of the sample, while the -strain does not contribute significantly (not shown).
For Mn12, we perform a similar analysis as above, using the ground-state single-spin Hamiltonian[10]
| (5) |
with , , and .[14] Detailed analysis can be found in the literature.[9] For this sample, the -strain and -strain effects play significant roles in the linewidths, while the dipolar interactions are not as important as for the Fe8 sample.
Next we discuss how the distribution of the directions of the magnetic anisotropy axes of clusters affect the EPR lineshapes. Because of defects in the samples, each cluster sees a slightly different crystal field due to the surrounding clusters, compared to the situation in a perfect crystal. We assume that these slightly different crystal fields result in local rotations of the magnetic anisotropy axes of some of the clusters by an angle from the crystal axis. The angle is assumed to have a Gaussian distribution about zero with a small standard deviation. Hereafter , , and denote the crystal axes, while , , and denote the magnetic anisotropy axes of a single cluster.
As a preliminary study, we examine the lineshapes for Mn12 when the magnetic field is applied along the axis and the magnetic anisotropy easy axis of a single cluster is tilted by from the axis. Then the single-spin Hamiltonian, in terms of the spin operators along the magnetic anisotrpy axes, becomes
| (6) |
For simplicity, we drop the fourth-order anisotropy terms. We also set , where is the third of the Euler angles defined in literature,[15] which does not affect the eigenvalues of .
Because of the local rotations of the magnetic anisotropy axes, some of the clusters experience slightly different resonant fields than those aligned with the crystal axis. In contrast to the Gaussian distributions of the resonant field due to the distributions in and , this effect gives rise to an asymmetry in the resonant field, which leads to an asymmetry in the EPR lineshapes. Assuming that is small, we treat the terms proportional to as small perturbations to the rest of the terms in Eq. (6). Using second-order perturbation theory, we obtain the resonant fields as a function of , shown in Fig. 3. Each curve in Fig. 3 is symmetric about 0. Figure 3 shows that for transitions between and 1 () an asymmetry appears in the direction of decreasing field, while for transitions between and 1 (32, 21) the asymmetry is in the direction of increasing field. At the examined frequency (66.135 GHz) the asymmetry effect is more significant for the small- transitions. Based on the analytic form of the resonant field, we can obtain analytically the distribution of the resonant field at a particular frequency for transitions between the levels and 1, including Gaussian distributions of , , and .[16] For simplicity, we have neglected the effects of natural linewidths, dipolar interactions, and temperature on the EPR lineshapes.
In conclusion, we have examined the EPR linewidths as functions of , frequency, and temperature for single crystals of the molecular magnets Fe8 and Mn12. We found that the distribution in is important to explain the linewidths for both of the molecular magnets, and that the dipolar interactions are crucial to understand the temperature dependence of the linewidths. Our preliminary study of the EPR lineshapes shows that the distribution of the directions of the magnetic anisotropy axes of clusters provides an asymmetry in the EPR spectra.
Funded by NSF Grants DMR-9871455, DMR-0120310, and DMR-0103290, and FSU-CSIT, FSU-MARTECH, and Research Corporation.
REFERENCES
- [1] T. Lis, Acta Crystallogr. B 36, 2042 (1980).
- [2] K. Wieghart, K. Pohl, I. Jibril, and G. Huttner, Angew. Chem. Int. Ed. Engl. 23, 77 (1984).
- [3] E. M. Chudnovsky and J. Tejada, Macroscopic Quantum Tunneling of the Magnetic Moment, Cambridge Studies in Magnetism, Vol. 4 (Cambridge University Press, Cambridge, 1998) and references therein.
- [4] M. N. Leuenberger and D. Loss, Nature (London) 410, 789 (2001).
- [5] S. Hill, J. A. A. J. Perenboom, N. S. Dalal, T. Hathaway, T. Stalcup, and J. S. Brooks, Phys. Rev. Lett. 80, 2453 (1998).
- [6] S. Maccagnano, R. Achey, E. Negusse, A. Lussier, M. M. Mola, S. Hill, and N. S. Dalal, Polyhedron, 20, 1441 (2001).
- [7] J. A. A. J. Perenboom, J. S. Brooks, S. Hill, T. Hathaway, and N. S. Dalal, Phys. Rev. B 58, 330 (1998); E. del Barco, J. M. Hernandez, J. Tejada, N. Biskup, R. Achey, I. Rutel, N. Dalal, and J. Brooks, ibid. 62, 3018 (2000).
- [8] J. R. Pilbrow, Transition Ion Electron Paramagnetic Resonance (Clarendon, Oxford, 1990).
- [9] K. Park, M. A. Novotny, N. S. Dalal, S. Hill, and P. A. Rikvold, Phys. Rev. B (in press).
- [10] A. Abragam and B. Bleaney, Electron Paramagnetic Resonance of Transition Ions (Clarendon, Oxford, 1970).
- [11] K. Blum, Density Matrix Theory and Applications, 2nd edition (Plenum, New York, 1996).
- [12] M. N. Leuenberger and D. Loss, Phys. Rev. B 61, 1286 (2000); 61, 12200 (2000).
- [13] S. Wolfram, The Mathematica Book, 3rd edition (Wolfram Media/Cambridge University Press, New York, 1996).
- [14] A. L. Barra, D. Gatteschi, and R. Sessoli, Phys. Rev. B 56, 8192 (1997).
- [15] H. Goldstein, Classical Mechanics (Addison-Wesley, Reading, 1980).
- [16] K. Park, M. A. Novotny, N. S. Dalal, S. Hill, and P. A. Rikvold, (unpublished).