Long-range effects in granular avalanching
Abstract
We introduce a model for granular flow in a one-dimensional rice pile that incorporates rolling effects through a long-range rolling probability for the individual rice grains proportional to , being the distance traveled by a grain in a single topling event. The exponent controls the average rolling distance. We have shown that the crossover from power law to stretched exponential behaviors observed experimentally in the granular dynamics of rice piles can be well described as a long-range effect resulting from a change in the transport properties of individual grains. We showed that stretched exponential avalanche distributions can be associated with a long-range regime for where the average rolling distance grows as a power law with the system size, while power law distributions are associated with a short range regime for , where the average rolling distance is independent of the system size.
pacs:
PACS numbers: 64.60.Lx, 46.10.+z, 05.40.+jThere is nowadays a massive evidence of scale invariant phenomena in nature. They appear in systems as diverse as geological (e.g., earthquakes), climatic (e.g., atmospheric turbulence), granular flow (e.g., rice piles, the topic of this work) and biological (e.g., biological evolution, cell growth, among many others). In many of these cases no particular tunning is perceived. In 1987 Per Bak and colaborators [3] advanced the hypothesis that this is so because the microscopic dynamics of the system makes it to spontaneously evolve towards a critical, scale-invariant state. This is known today as self-organized criticality (SOC). To illustrate the idea they introduced a sand pile model [3] that quickly became the paradigm ofSOC models. In this model a pile is gradually built by adding individual grains one by one into an open system. After a transient period the pile reaches a stationary critical state, where the slope of the pile fluctuates around a stationary value. At this stage avalanches of all possible sizes are observed, giving a power law avalanche size distribution. This is the SOC state. The experimental search for power laws in the avalanche size distribution in real granular systems presented a great challenge [4, 5, 6, 7, 8]. Some years ago the Oslo group [10, 12] found evidence of SOC in controlled experiments on the granular dynamics of rice piles. In 1996 Frette et al [9] performed an experiment where elongated rice grains were added slowly in a narrow gap between two plates. They found that the avalanche size distribution for grains with large aspect ratio presents a power law behavior, while a stretched exponential behavior is observed for rounder grains. These experimental results showed that SOC is not insensitive to the details of the system such as the shape of the grains and that inertia effects play an important role in the relaxation dynamics. The Oslo group introduced a “rice-pile” model to phenomenologically describe their experiments [10, 11, 12]. This model describes the phenomenology of rice piles presenting SOC behavior. Moreover, further studies showed that it can be exactly mapped to a model for interface depinning [13]. However, the Oslo model does not present a stretched exponential distribution in any region of its parameter space.
In a recent communication Head and Rodgers [14] presented a clustered based model for granular flow, which exhibits both stretched exponential and power law behavior over its parameter range. Through this model they showed that power law behavior appears to be related to the coherent motion of clusters of grains that slide along the surface, while the stretched exponential behavior results from a fluid like motion associated with the rolling of isotropic grains. However, the motion of individual grains is implicitly incorporated in this model, where the basic dynamical variables are related to cluster properties. Hence, it is interesting to investigate in a more microscopic level how the crossover from power law to stretched exponential behavior emerges as a consequence of a change in the transport properties of individual grains.
In this work we present a model where the ability of individual grains to roll a distance is described by a long-range rolling probability of the form
| (1) |
where is a normalization constant, is the system size, and . The parameter controls the average rolling distance which is expected to depend on the aspect ratio of the grains. The limit corresponds to a nearest neighbors movement (), thus describing the case where the grains do not roll. In the opposite limit the grains can move to any site of the pile (or even drop off in a single jump) with equal probability. Hence, this limit can be associated to the idealized situation of perfect spherical grains without friction. Moreover, studies on different dynamical systems with similar long-ranged interactions[15, 16, 17] have shown that, except from some possible rescaling factor, the behavior of almost all the relevant properties of the systems in the full range reproduce the corresponding ones for . This appears to be related to the behavior of the first moment of the distribution (1), which in the present context represents the mean rolling distance of the grains. For large values of we have that
| (2) |
We see that, for , is of the order of the system size, which means that a very large number of grains will drop off of the system in a single jump, for any system size. Since this behavior appears to be highly unrealistic we will concentrate our study on the regime .
Our model is based on the Oslo one [10, 11, 12] and it is defined as follows. We consider a one dimensional lattice of size (), each site having associated an integer variable representing the local height of the pile. The local slope is then given by . The grains enter into the system from the left () and may drop off at the rightmost site , imposing for all times. Every time the local slope of a site exceeds a local critical value the topmost grain at site rolls sites to the right with probability given by Eq.(1). Then, the heights of the sites and are recalculated as and and the corresponding local slopes are modified accordingly. Each time a grain leaves a column we assign ita new critical slope or with equalprobability. This process is repeated until all the local slopes satisfy . An avalanche starts when and when it stops (i.e., ) new grains are added until a new avalanche is initiated. Notice that in the limit the present model reduces to Oslo model.
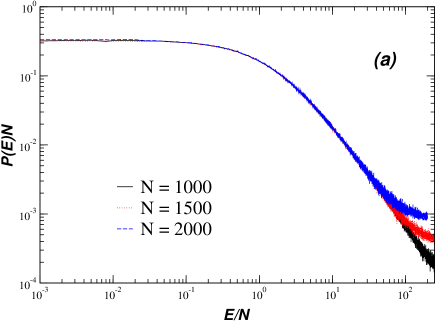
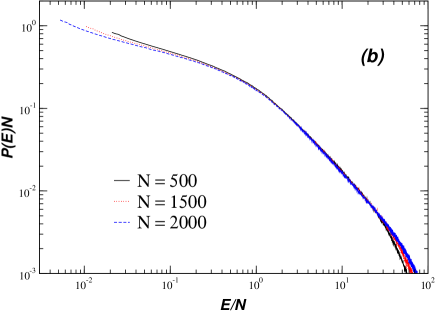
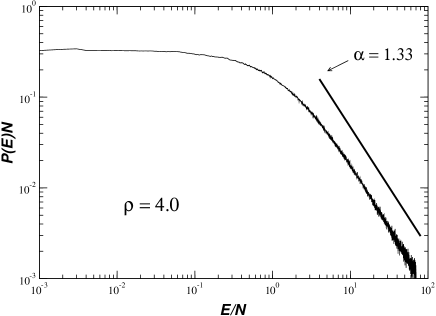
Once the system attains the stationary state, fluctuations in the slope of the pile appear in the form of avalanches that redistribute the grains, thereby changing the profile. By considering the profile just before an avalanche is initiated and the final profile when it stops, the avalanche size is defined as the total energy dissipated between both profiles [9]. The local energy change in a site is calculated as the difference between the potential energies in both profiles, where the units were chosen such that . We study for different values of the probability density , being the probability that an avalanche with energy dissipation between and will occur in a system of size . Numerical data were smoothed using a local average procedure in order to diminish large statistical fluctuations present for high values of the ratio . We verified for a wide range of values of (even in the non physical region ) that displays the finite-size scaling behavior , in agreement with the experimental data [9], as shown by the data collapse of Fig. 1 for and . The scaling function depends on the value of . We found two clearly distinct regimes. For (hereafter referred as the “sliding regime”) is almost constant for small values of and presents a power law dependency for large values of , as shown in the example of Fig.2 for . The exponent increases smoothly from in the limit to for values of , where it becomes independent of . This value is consistent with that obtained by Head and Rodgers [14] for the cluster based rice pile model.
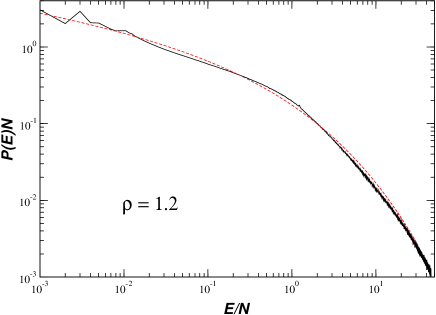
For (hereafter referred as the “rolling regime”) the best fitting of the numerical data is obtained by a function of the form:
| (3) |
as shown in the example of Fig.3 for . The parameters , and depend on , as shown in table I, although the small variation of in this regime suggests that it may not depend on . Notice that this function seems to describe the behavior of the whole distribution, not just for large values of (where it is dominated by the stretched exponential) but also for small values of it.
We have shown that the crossover from power law to stretched exponential behavior observed in the granular dynamics of rice piles can be well described as a long-range effect resulting from a change in the transport properties of individual grains. Within this scenario two distinct regimes appear, regarding the qualitative behavior of the avalanche distribution: a short-range “sliding” regime and a long-range “rolling” one. A direct inspection of snapshots of the profiles obtained during the simulations shows that, indeed grains group into clusters that move coherently in the sliding regime, while in the rolling regime they move almost independently. These behaviors are consistent with what is observed experimentally [9] and with Head and Rodgers results [14]. Details of these simulations will be published elsewhere. This change in the transport properties of individual grains is related to different scaling properties of the average rolling distance with the system size: while in the rolling regime scales as a power law , in the sliding regime does not depend on .
In the whole sliding regime the system displays the qualitative behavior expected for a short-range model, that is, a power law for large values of the energy density and constant for small values of it. However, it is worth noting that for intermediate values of () the characteristic exponent of the power law distributions depends on , while for large values of it becomes independent of . This results suggests that non-universal behavior may be expected for intermediate values of the grains aspect ratio. The value is only indicative and it seems not to be a critical value of separating the universal from the non-universal behaviors.
In the rolling regime the whole avalanche distribution is well described by a stretched exponential modulated by a power law. This correction to the usual stretched exponential behavior is only important in the small energy density region of the spectrum, since for the function is always dominated by the stretched exponential. Notice that for the exponent changes of sign taking small absolute values, suggesting logarithmic rather than power law corrections to the stretched exponential in this region. Indeed, a slightly better fitting is obtained with a function of the form
| (4) |
without any significant change in the fitting parameter values of and shown in table I.
From table I we see that the best agreement [9] with the experimental values and is obtained for . Both functions Eq.(3) and (4) cease to give good fittings of the simulation data as we approach the border values and respectively. This fact, together with an increase in the statistical fluctuations in the neighborhood of those values, makes very difficult to determine how the crossover from stretched exponential and power law occurs around . Possibly the calculation of the distributions of other quantities (like transit times) may be useful. Some work along this line is in progress.
This work was partially supported by grants from Consejo Nacional de Investigaciones Científicas y Técnicas CONICET (Argentina), Consejo Provincial de Investigaciones Científicas y Tecnológicas (Córdoba, Argentina) and Secretaría de Ciencia y Tecnología de la Universidad Nacional de Córdoba (Argentina).
REFERENCES
- [1] E-mails: pgleiser@fis.uncor.edu, cannas@famaf.unc.edu.ar, tamarit@famaf.unc.edu.ar
- [2] Member of the National Research Council, CONICET (Argentina)
- [3] P. Bak, C. Tang and K. Wiesenfeld, Phys. Rev. Lett. 59, 381 (1987).
- [4] G. A. Held, D. H. Solina, D. T. Keane, W. J. Haag, P. M. Horn and G. Grinstein, Phys. Rev. Lett. 65, 1120 (1990).
- [5] H. M. Jaeger, C. Liu and S. R. Nagel, Phys. Rev. Lett. 27, 40 (1989).
- [6] P. Evesque, Phys. Rev. A 43, 2720 (1991).
- [7] S. R. Nagel, Rev. Mod. Phys. 64, 321 (1992).
- [8] M. Bretz, J. B. Cunningham, P. L. Kurczynski and F. Nori, Phys. Rev. Lett. 69, 2431 (1992).
- [9] V. Frete, K. Christensen, A. Malthe Sørenssen, J. Feder, T. Jøssang and P. Meakin, Nature 379, 49 (1996).
- [10] V. Frette, Phys. Rev. Lett. 70, 2762 (1993).
- [11] A. M. Sørensen, J. Feder, K. Christensen, V. Frette and T. Jøssang, Phys. Rev. Lett. 83, 764 (1999).
- [12] K. Christensen, A. Corral, V. Frette, J. Feder and T. Jøssang, Phys. Rev. Lett. 77, 107 (1996).
- [13] M. Paczuski and S. Boettcher, Phys. Rev. Lett. 77, 111 (1996)
- [14] D. A. Head and G. J. Rodgers, J. Phys. A: Math. and Gen. 32, 1387 (1999).
- [15] P. M. Gleiser, F. A. Tamarit and S. A. Cannas, Physica A 275, 272 (1999).
- [16] F. A. Tamarit and C. Anteneodo, Phys. Rev. Lett. 84, 208 (2000).
- [17] S. A. Cannas, Physica A 358, 32 (1998)