Collisions in compact star clusters
Abstract
The high stellar densities in young compact star clusters, such as the star cluster R 136 in the 30 Doradus region, may lead to a large number of stellar collisions. Such collisions were recently found to be much more frequent than previous estimates. The number of collisions scales with the number of stars for clusters with the same initial relaxation time. These collisions take place in a few million years. The collision products may finally collapse into massive black holes. The fraction of the total mass in the star cluster which ends up in a single massive object scales with the total mass of the cluster and its relaxation time. This mass fraction is rather constant, within a factor two or so. Wild extrapolation from the relatively small masses of the studied systems to the cores of galactic nuclei may indicate that the massive black holes in these systems have formed in a similar way.
Department of Astronomy,
Boston University,
725 Commonwealth Ave.,
Boston, MA 02215, USA
Hubble Fellow
1. Introduction
In the central regions of dense star clusters and galaxy bulges collisions between stars are rather common. Such collisions are likely to play an important role in the formation of exotic objects such as blue stragglers (Sanders 1970; McNamara & Sanders 1976), X-ray binaries (Fabian et al. 1975) and millisecond pulsars (Lyne et al. 1987; 1988), but have also an important influence on the dynamics of these clusters (Quinlan & Shapiro 1990; Quinlan et al. 1995, Lee 1995).
Both the stars and the parent cluster evolve on comparable time scales, and cluster dynamics and stellar evolution are quite closely coupled. For example, massive stars tend to segregate to the core due to dynamical friction, increasing their collision probability. Collision products are even more massive, leading to the possibility of runaway merging, if the collision rates can remain high enough in the few Myr before the stars explode as supernovae (Lee 1987; Quinlan & Shapiro 1990). However, these rates are determined by the dynamical state of the cluster, which in turn is strongly influenced by stellar mass loss and binary heating. The only way to treat this intimate coupling between stellar collisions and cluster dynamics is to perform N-body simulations in which the stars are allowed to evolve and collide with one another in a fully self-consistent way.
Recently Portegies Zwart et al. (1999, hereafter PZMMH) demonstrated via direct N-body calculations of dense star clusters that multiple collisions are rather common and that the collision products may grow to very high masses within a few million years. In the models the collision rate is two orders of magnitude higher than semi-analytic estimates indicate. Although the calculations are still rather limited, excluding the effects of primordial binaries and for a limited number of stars, they argue that the results could be scaled with respect to the total mass and initial relaxation time, i.e., with .
In this paper we report the results of a series of N-body simulations modeling young and compact star clusters, such as R 136 in the 30 Doradus region in the Large Magellanic Cloud. This cluster is particularly interesting because a strong coupling between stellar evolution and stellar dynamics may exist. In addition to this, excellent observational data is available. Many unusually bright and massive stars (e.g. Massey & Hunter 1998) are present in R 136 which, due to the high central density of to stars pc-3, are likely to interact strongly with each other.
We find that runaway collisions of massive stars can occur, and that the most massive star grows in mass through merging with other stars until it collapses to a black hole. The growth rate of this star is much larger than estimates based on simple cross-section arguments, because the star is typically found in the cluster core, and tends to form binaries with other massive stars. The maximum mass of the runaway collision product scales with the total mass of the star cluster and the scaling factor is rather constant. After half an initial relaxation time between 0.9% and 2.4% of the total mass of the star cluster ends up in a single object.
2. Methods
Our findings are based on series of direct N-body simulations with the “Starlab” software environment (Portegies Zwart et al. 1999: see http::/www.sns.ias.edu/∼starlab), using the special-purpose computer GRAPE-4 to speed up the calculations (Makino et al. 1997). The evolution of stars is taken into account self consistently with the dynamical evolution of the star cluster. A collision is assumed to occur when two stars ( and ) approach each other within a distance , where and are the radii of the stars involved. A collision between two main-sequence stars with masses and results in a single rejuvenated main-sequence star with mass . Smooth-particle hydrodynamic simulations of collisions between main-sequence stars indicate that at maximum a few percent of the total mass is lost (see e.g.: Lai et al. 1993; Lombardi et al. 1995; 1996). Consequently, mass loss during the merger event is ignored.
3. Selection of initial conditions
We selected the initial parameters for the models to mimic a class of star clusters similar to the Galactic cluster NGC 3606 or the young globular cluster NGC 2070 (R136) in the 30 Doradus region of the Large Magellanic Cloud.
3.1. The star cluster R 136 in the 30 Doradus region
The half-mass radius () of R 136 is about 1 parsec (Brandl et al. 1996), and the core radius pc (Hunter et al. 1995). The total mass . With an assumed mean mass of 0.6 the cluster thus contains about 35 000 stars. The corresponding central density is of the order of pc-3. The age of R 136 is –4 Myr (Campbell et al. 1992). The Galactic star cluster NGC 3606 is somewhat smaller in size and its total mass is larger resulting in a denser core (Moffat et al. 1994; Drissen et al. 1995).
For both clusters, the tidal effect of their parent galaxy (for R 136 that is the Large Magellanic Cloud) is small and we therefore neglected the effect of a tidal field.
3.2. Scaling the dynamical time scale
The evolution of an isolated star cluster is driven by two-body relaxation. Therefore, we set up the initial model so that it has the same relaxation time scale as the real cluster. The relaxation time is calculated with
| (1) |
Here is the number of stars and is a scaling factor, introduced to model the effects of the cut-off in the long range Coulomb logarithm (see Giertz & Heggie 1996; 1994). Here is the half-mass crossing time of the cluster is
| (2) |
Here is its half mass radius.
3.3. Scaling the collision cross section
We want the model clusters to have the same collision rate per star as the real cluster. Scaling the initial conditions to assure that the model cluster has the same relaxation time causes it to be larger than the real system (Eq. 3). The correct collision rate per star is then obtained by scaling the sizes of the stars themselves.
The number of collisions per star per unit time is given by (Spitzer 1987)
| (4) |
Here is the number density of the stars in the core, is the collision cross section (for approach within some distance ), and is the velocity dispersion. These are given by the following proportionalities:
| (5) |
We neglect the term in the cross section. Expressed in real units and assuming scaling according to Eq. (3), we may write
| (6) |
The number of collisions then becomes
| (7) |
The distance at which a collision occurs therefore scales as
| (8) |
3.4. The models
We performed runs with 24k, 12k, 6k and 3k stars (). All runs start from the same initial relaxation time and density profile.
All simulations start at by assigning masses of stars between 0.1 and 100 from the mass function suggested for the Solar neighborhood by Scalo (1986).
The initial density profile and velocity dispersion are taken from a King (1966) model with . We chose pc for the models with 12k stars. This results in a core radius pc and a core density of . The central velocity dispersion for these models is about 8.7 and the initial half-mass relaxation time Myr. All computations were continued until Myr.
4. Results
4.1. Mass segregation
The models are characterized by an initial expansion; the core radius increases from 0.07 to 0.18 pc within the first 4 million years (roughly 50 crossing times). Together with the expansion of the cluster, the density in the core decreases by about an order of magnitude.
The expansion of the cluster is driven mainly by the formation and subsequent heating of binaries. The cluster is still too young for significant stellar evolution to occur, therefore mass loss by stellar evolution is relatively unimportant. The first binaries are formed shortly after the start of the simulation. One of these binaries typically contains two of the most massive stars.
Mass segregation has brought these two stars into the core on a time scale similar to the crossing time of the cluster. On their first orbit through the cluster core these stars simply did not leave but stayed in the core. This is not entirely unexpected as the most massive objects are between 50 and 100 times more massive than the mean mass in the stellar system. For the selected initial conditions the time scale for mass segregation is therefore expected to be of the order of a crossing time.
Further mass segregation results in an increase in the mean mass in the cluster core from the initial 0.6 to double this value within a million years. After that the mean mass in the core stays more or less constant.
4.2. The collision rate
In all our model calculations we observe a collision rate which is about two orders of magnitude higher than expected on cross section arguments.
The rate at which stars in a cluster experience collisions can be estimated via Eq. 4. Following the derivation by Portegies Zwart et al. (1997) in which a Maxwellian velocity distribution with velocity dispersion and the gravitational focusing cross section from Eq. 5 are adopted, the number of collisions in the cluster per Myr is expressed as (see their Eq. 14)
| (9) |
Here is the mean stellar mass.
For the k runs this results in about 0.3 collision/Myr, or about 3 collisions during the entire simulation, assuming that the cluster parameters do not change in time. As we discussed in the previous section, the core density in fact drops by about an order of magnitude during the first 4 million years. If we take this effect into account, the expected number of collisions is less than unity. The actual number of collisions in each simulation exceeds 10 (for the models with 12k stars). The major cause of this large discrepancy is the formation of binaries and mass segregation.
The importance of mass segregation is illustrated in Fig. 1, which gives the theoretical probability distribution for stars with mass to collide with lower-mass stars of mass in the top panel and the distribution of collisions actually observed in our simulations in the bottom panel.
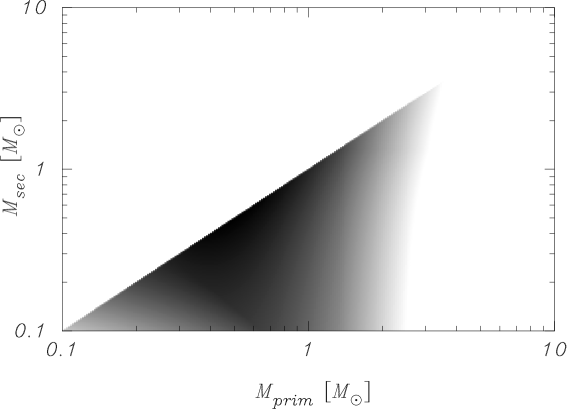
The cross section arguments imply that low mass ( ) stars are most likely to collide. In our simulations, however, high-mass stars predominantly participated in encounters. The most massive star typically participates in numerous collisions with other stars. The mass of this runaway grows to exceed 120 and the rejuvenation of the runaway merger delays its collapse to a compact object following a supernova. Such a star could be visible in the core of young star clusters as a blue straggler.
The reason for the discrepancy between the formal cross-section arguments and the results of our simulations is the neglect of mass segregation and binary formation in the former estimates. In the simulations the most massive stars sink to the core due to dynamical friction within a few half-mass crossing times, and form close binaries by 3-body interactions. The larger cross section of these binaries increases the collision rate and makes them favored candidates for encounters.
4.3. Black holes in dense star clusters
When the runaway merger collapses to a black hole it is typically a member of a rather close binary. Upon dissociation of the binary, the black hole is ejected from the core, but not from the cluster. Since the compact object is still considerably more massive than average, mass segregation brings it back in the core within a few crossing times (see e.g. Hut, McMillan, & Romani 1992). New close binaries can be formed once the black hole has returned to the core of the star cluster. After an episode of hardening the binary may become visible as an X-ray source when the companion star starts to transfer mass to the black hole. Such a high-mass X-ray binary should be easily observable by X-ray satellites. The age at which such a binary can form is at least Myr, the minimum time needed for a black hole to form. It is likely to take considerably longer because the black hole has to return to the core after its ejection.
The star cluster R 136 is therefore “too young” for such a binary to exist. The star Mk 34 at a distance of about 2.5 pc from the center of R 136, however, is associated with a persistent X-ray source with a luminosity of erg s-1 (Wang 1995). Wang suggests that the binary contains a black hole of between 2.4 and 15 accreting from the dense wind of its spectral type WN4.5 Wolf-Rayet companion. This star, Mk 34, can be classified as a “blue straggler,” as its estimated age is about 1 Myr, considerably smaller than the age of the cluster (De Marchi et al. 1993).
Because R 136 is too young for such an X-ray binary to be formed from two collision products, it most likely formed from a primordial binary ejected from the cluster core following the supernova which formed the black hole.
4.4. Black holes in central star clusters
The centers of galactic nuclei contain supermassive black holes and it is still unclear how they form (Rees 1999). The masses of these black holes appear to be correlated with the mass of their parent galaxy (Wandel & Mushotsky 1996), and the mass of the black hole is typically % of the total bulge mass.
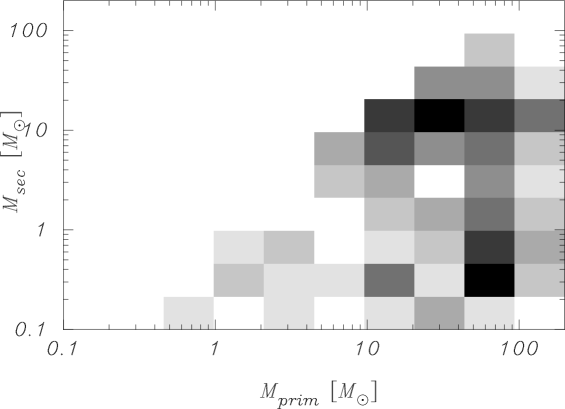
With the collision rate derived from the simulations and assuming a mean mass increase of 10 per collision (which is consistent with the -body results) we can draw a relation between the mass of the star cluster and that of the collision runaway.
This relation is presented as the dotted line in Fig 2. The solid line in Fig 2 gives a least squares fit to the measured black hole masses in galactic bulges (Wandel 1999). The horizontal offset may be explained by the much smaller relaxation time of the simulated systems compared to that of spheroidal bulges; galactic nuclei are much more massive than the simulated clusters. Increasing the initial relaxation time in the simulated clusters causes the dotted line in Fig. 2 to shift to the right. The similarity in the slopes is quite striking and may indicate that the black holes in galactic bulges are formed via stellar collisions in the violent relaxation phase.

5. Epilogue: Observing the models
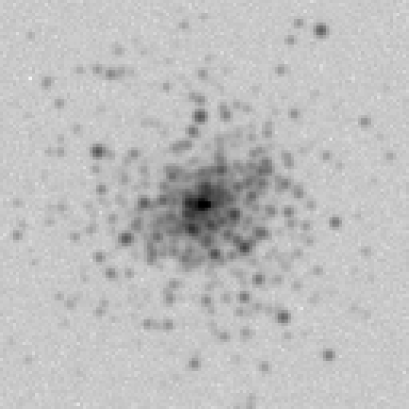
As the models become more elaborate and realistic, it becomes more and more important to compare the results more directly with observations. In a recent attempt to visualize the simulations, we started by creating images of the models as if they had been observed through a telescope. The atmospheres’ transparency as well as the response of the CCD with realistic noise levels are modeled in great detail.
Comparisons between model data and the way an observer would study a real cluster provides a critical check on the observer’s data reduction process. In addition, there are many uncertainties as to how our models would appear if they were observed as a real cluster on the sky. Numerical problems, erroneous initial conditions, and other incorrect assumptions may reveal themselves much more clearly when the models are analyzed by observers rather than by theorists. Since theoretical models are at last producing sufficiently detailed data that we can now talk meaningfully about performing comparisons between theory and observations, it is critical that we identify robust ways of projecting numerical data onto the observational plane.
The main reason for doing this is to get an improved handle on how the results of the numerical models would be viewed by an observer on or in orbit around a distant planet. An example of such an image is presented in Fig. 3. More information about this project is available at http://www.sns.ias.edu/starlab/research/project_ CCD.
Acknowledgments.
I am grateful to Stephen McMillan, Jun Makino, Piet Hut and Tereasa Brainerd for discussions. Drexel University and the University of Tokyo are deeply acknowledged for their hospitality and the use of their GRAPE hardware. This work was supported by NASA through Hubble Fellowship grant HF-01112.01-98A awarded by the Space Telescope Science Institute, which is operated by the Association of Universities for Research in Astronomy, Inc., for NASA under contract NAS 5-26555.
References
- \astronciteBrandl et al.1996 Brandl, B., Sams, B. J., Bertoldi, F., Eckart, et al. 1996, ApJ, 466, 254
- \astronciteCampbell et al.1992 Campbell, B., Hunter, D. A., Holtzman, J. A., et al. 1992, AJ, 104, 1721
- \astronciteDe Marchi et al.1993 De Marchi, G., Nota, A., Leitherer, C., Ragazzoni, R., Barbieri, C. 1993, ApJ419, 658
- \astronciteDrissen et al.1995 Drissen, L., Moffat, A. F. J., Walborn, N. R., Shara, M. M. 1995, AJ110, 2235
- \astronciteFabian et al.1975 Fabian, A., Pringle, J., Rees, M. 1975, MNRAS 172, 15
- \astronciteGiersz & Heggie1994 Giersz, M., Heggie, D. 1994, MNRAS268, 257
- \astronciteGiersz & Heggie1996 Giersz, M., Heggie, D. C. 1996, MNRAS 279, 1037
- \astronciteHunter et al.1995 Hunter, D. A., Shaya, E. J., Scowen, P., et al. 1995, ApJ444, 758
- \astronciteHut et al.1992 Hut, P., McMillan, S., Romani, R. W. 1992, ApJ 389, 527
- \astronciteKing1966 King, I. R. 1966, AJ 71, 64
- \astronciteLai et al.1993 Lai, D., Rasio, F. A., Shapiro, S. L. 1993, ApJ412, 593
- \astronciteLee1987 Lee, H. M. 1987, ApJ319, 801
- \astronciteLee1995 Lee, H. M. 1995, MNRAS272, 605
- \astronciteLombardi et al.1995 Lombardi, J.C̃., J., Rasio, F. A., Shapiro, S. L. 1995, ApJ445, L117
- \astronciteLombardi et al.1996 Lombardi, J.C̃., J., Rasio, F. A., Shapiro, S. L. 1996, ApJ468, 797
- \astronciteLyne et al.1987 Lyne, A. G., Brinklow, A., Middleditch, J., Kulkarni, S. R., Backer, D. C. 1987, Nat 328, 399
- \astronciteLyne et al.1988 Lyne, A. G., Biggs, J. D., Brinklow, A., McKenna, J., Ashworth, M. 1988, Nat 332, 45
- \astronciteMakino et al.1997 Makino, J., Taiji, M., Ebisuzaki, T., Sugimoto, D. 1997, ApJ 480, 432
- \astronciteMassey & Hunter1998 Massey, P., Hunter, D. A. 1998, ApJ493, 180
- \astronciteMcNamara & Sanders1976 McNamara, B. J., Sanders, W. L. 1976, A&A52, 53
- \astronciteMoffat et al.1994 Moffat, A. F. J., Drissen, L., Shara, M. M. 1994, ApJ436, 183
- \astroncitePortegies Zwart et al.1997 Portegies Zwart, S. F., Hut, P., Verbunt, F. 1997, A&A 328, 130
- \astroncitePortegies Zwart et al.1998 Portegies Zwart, S. F., Makino, J., McMillan, S. L. W., Hut, P., 1999, A&A 348, 117
- \astronciteQuinlan & Shapiro1990 Quinlan, G. D., Shapiro, S. L. 1990, ApJ356, 483
- \astronciteQuinlan et al.1995 Quinlan, G. D., Hernquist, L., Sigurdsson, S. 1995, ApJ440, 554
- \astronciteRees1999 Rees, M. J., 1999, to appear in the proceedings of ESO conference in honour of R. Giacconi on Black Holes in Binaries and Galactic Nuclei, ed L., Kaper et al., astro-ph/9912345
- \astronciteSanders1970 Sanders, A. 1970, ApJ 162, 197
- \astronciteScalo1986 Scalo, J. M. 1986, Fund. of Cosm. Phys. 11, 1
- \astronciteSpitzer1987 Spitzer, L. 1987, Dynamical Evolution of Globular Clusters, Princeton Univ. Press
- \astronciteWang1995 Wang, Q. D. 1995, ApJ453, 783
- \astronciteWang1995 Wandel, A., 1999 ApJ 519, L39
- \astronciteWang1995 Wandel, A., Muchotsky, R.F., 1986 ApJ 306, L61
6. Discussion
Hans Zinnecker: The real 30 Doradus cluster may even be more complicated and interesting that you described, because initialy the proto cluster also contains a lot of gas in which the stars have to move around (see Bonnell, Bate & Zinnecker, 1998, MNRAS 298, 93).
SPZ: The presence of gas may indeed affect the dynamical evolution of the system significantly, but it is not trivial to include these effects self consistently in our calculations. At the moment Piet Hut, Junichiro Makino, Stephen McMillan and I are working on a series of similar -body calculations in which we include a large fraction of primordial binaries. These calculations include stellar evolution but we neglect the primordial gas.
Göran Östlin: Would a Wolf-Rayet star formed through a collision differ from an ordinary single Wolf-Rayet star.
SPZ: There are a number of ways in which a collision product (also if it is a Wolf-Rayet star) can be distinguished. A collision producst is generally more massive and will appear younger than the other stars in the cluster due to mixing during the merger event. Such a star may manifest itself as a blue straggler. Most collisions are off center and the collision product is likely to be rapidly rotating. This may show up in the spectra of the collision product. Three stars in R 136 (R136a3, Mk34 and R136-10) have unusual Hydrogen abundances in their spectra (Massy & Hunter, 1998) and it may worth to study them in more detail.
Pavel Kroupa: The central density decreases almost from the start of your simulations. What is the cause of this.
SPZ: The cluster starts expanding after the first binaries have formed, which is an extremly efficient process in the presence of a mass function. Note that the crossing time in these models is only year, which is also the timescale on which the most massive stars sink to the clusters center, whare they form hard binaries. Binary formation and subsequent heating are the main source for the expansion of the cluster.