Radio sources near the core of globular cluster 47 Tucanae
Abstract
We present ATCA radio images of the globular cluster 47 Tucanae made at 1.4 and 1.7 GHz and provide an analysis of the radio sources detected within 5′ of the cluster centre. 11 sources are detected, most of which are clustered about the core of 47 Tuc. Both of the pulsars in 47 Tuc whose positions are known can be identified with sources in the 1.4 GHz image. The source distribution has a characteristic radius of 100″, larger than the 23″ radius of the cluster core. We compare source positions with the positions of nine X-ray sources and find no correspondence.
keywords:
globular clusters: 47 Tucanae – pulsars1 Introduction
The globular cluster 47 Tucanae is known to contain many short period (millisecond) radio pulsars. Robinson et al. [Robinson et al. 1995] reported 11 pulsars observed with the Parkes radiotelescope at 640 MHz and 436 MHz. Millisecond pulsars as a class are intrinsically faint. Coupled with the relatively great distance to 47 Tuc (4.6 kpc), this means that most of the pulsars are difficult to detect. Robinson et al. report that many detections rely on the occasional flux enhancements produced by the focussing effects of diffraction and refraction in the irregular interstellar medium. Many of the pulsars show period variations characteristic of motion in a binary orbit. The use of pulse timing to determine pulsar positions in the cluster has been made difficult by both their intermittent detectability and the extra complexity of timing analyses arising from their orbital motions. In 1995, Robinson et al. were able to report positions for only two of the pulsars — 47 Tuc C and 47 Tuc D.
The positions of the pulsars relative to the cluster centre are interesting because of the relation to the dynamics and evolutionary history of the cluster core. For example, pulsars C and D have a negative period derivative which is attributed not to an intrinsic increase in rotation rate, but to their accelerated motion in the cluster’s gravitational field.
Here we report radio images of 47 Tuc made at 1.4 GHz and 1.7 GHz with the Australia Telescope Compact Array (ATCA) and an attempt to seek point radio sources which may be identified with pulsars in the cluster. At 1.4 GHz, the sky away from the Galactic plane is dominated by extragalactic sources with small angular sizes. The number density of these sources increases, naturally, with decreasing flux density and at flux levels expected of the radio pulsars in 47 Tuc, tens of sources are expected in each ATCA primary beam. Several reports of studies of 1.4 GHz source densities are available as a guide to the expected number of background sources. In particular, the “Phoenix Deep Survey” [Hopkins et al. 1998] was conducted at 1.4 GHz with the ATCA and provides a useful reference. In the analysis of these observations of 47 Tuc we study three source characteristics which might distinguish the radio pulsars from the background sources. (1) Spectral index: the spectral index (where ) of pulsar emission tends to be less than () the typical value for extragalactic sources for which . (2) Flux variability: the very small angular size of radio pulsars leads to large flux variations due to scintillation in the interstellar medium. (3) Spatial distribution: background sources are distributed uniformly whereas the pulsars are expected near the cluster core.
Radio images of other globular clusters have been reported by Kulkarni et al. [Kulkarni et al. 1990]. They observed five clusters with the VLA and detected the pulsars in clusters M4 and M28, one of now eight known pulsars in M15, a single unidentified radio source in M3 and no radio sources in M92.
2 Observations and data reduction
The Australia Telescope Compact Array (ATCA) was used to observe 47 Tuc at 1.408 GHz and 1.708 GHz. At each frequency a 128 MHz bandwidth was used, each band split into 64 spectral channels. The cluster was observed on 1992 Jan 24 in the 6D array configuration and on 1992 Apr 23,24,25 in the 6C configuration. Four fields close to the cluster centre were observed. Table 1 gives the field centres and their times of observation.
| Observation | Date | Time | ||||
|---|---|---|---|---|---|---|
| (J2000) | (J2000) | (UT) | (UT) | () | () | |
| I | 1992 Jan 24 | 06:00 - 11:05 | 66 | 75 | ||
| 1992 Jan 24-25 | 22:33 - 04:48 | |||||
| II | 1992 Apr 23-24 | 16:40 - 02:40 | 74 | 71 | ||
| III | 1992 Apr 24-25 | 14:41 - 02:35 | 102 | 130 | ||
| IV | 1992 Apr 24 | 03:38 - 14:22 | 133 | 186 | ||
| V | 1992 Apr 25 | 02:45 - 15:39 | 118 | 162 | ||
| mosaic | 42 | 46 |
The central field was observed in two separate 12-hour integrations which are listed individually as I and II in the table. Fields III IV and V were offset from the cluster centre by 15′, less than the 17′ to the half-sensitivity point of the ATCA primary beam at 1.4 GHz. Thus all five integrations individually had good sensitivity to emission from the cluster centre, and in combination provided a sensitive image over a 35′ region centred on the cluster.
The miriad data reduction package was used to calibrate the data and form images. The antenna gains were calibrated using brief observations of the source B2353-686 ( Jy, Jy) and the flux scale was referred to the ATCA primary flux calibrator B1934-638 ( Jy; Jy). Images were formed for each integration at both frequencies with reference position (tangent point) at (2000) = 00:24:0583, (2000) = -72:04:514, the nominal cluster centre [Guhathakurta et al. 1992]. Visibility data from each 2 MHz spectral channel were gridded separately allowing the full primary beam to be imaged with very little bandwidth smearing. An imaging cell size of 15 was used to provide adequate sampling of the synthesized beam. The image for each integration was made 2041 pixels square (51′). The final image at each observing frequency was formed as a linear combination of the images from each field. In the remainder of this paper we discuss a central region of the image of diameter 10′ and centred on the cluster.
3 Image Analysis and results
3.1 The image noise statistics
Five sub-images, corresponding to the integrations listed in Table 1, were made at each frequency. A sixth, the final (mosaic) image, was formed by linear combination of the five. To allow direct comparison, the five sub-images were corrected for the sensitivity variation across the primary beam. Table 1 gives the noise in each sub-image in the central 10′ of the cluster as the root-mean-square of their pixel values (). The higher noise levels in sub-images IV and V are possibly due the effects of imperfect antenna pointing during the integration and the presence of relatively strong sources (92 mJy and 41 mJy) near the halfpower levels of those fields. The size (FWHM) of the synthesized beam in the combined images was at 1.4 GHz and at 1.7 GHz.
3.2 Radio sources
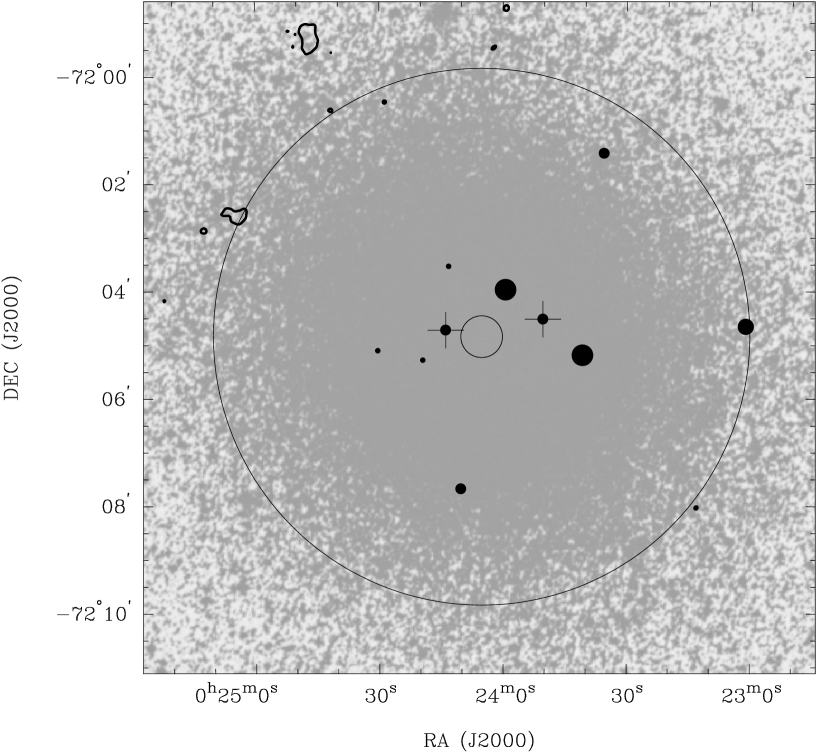
Examination of the images shows a number of point sources. Sources within a 5′ radius of the cluster centre were analysed. All sources with a peak brightness exceeding 4.5 in the 1.4 GHz mosaic were selected. Their positions and fluxes were estimated by fitting each with a gaussian function with major and minor axes equal to those of the synthesized beam. Because of the known flux variability of pulsars in the cluster, each of the sub-images (I - V) were searched for sources coincident in two sub-images but that were not strong or persistent enough to rise above the detection threshhold in the mosaic. No such sources were found. All sources detected at 1.7 GHz were also visible at 1.4 GHz. Table 2 lists the sources detected in the 1.4 GHz image. The 1.7 GHz image was analysed in the same way and 1.7 GHz fluxes are reported for each source in Table 2. Two sources (2, 4) had a 1.7 GHz brightness below the 4.5, threshhold, but for each a successful fit to a model gaussian source was made, yielding 1.7 GHz fluxes of 165and 177(3.6 and 3.8) respectively. Two further sources (9, 11) had no detectable 1.7 GHz emission and upper limits corresponding to 3 are quoted in Table 2. The radial distance of each source from the cluster centre ((2000) = 00:24:0583, (2000) = -72:04:514, Guhathakurta et al., 1992111Note that an independent determination of the cluster centre [Calzetti et al. 1998] differs by 14 which is not significant in this analysis.) is listed in the table. Table 2 also lists, in column 8, the spectral index of each source. Fig. 1 shows the location and relative flux density of the 1.4 GHz sources superposed on an optical image (from the Digital Sky Survey) of the cluster.
| (1) | (2) | (3) | (4) | (5) | (6) | (7) | (8) |
|---|---|---|---|---|---|---|---|
| Number | R | S1.4 | S1.7 | ||||
| (J2000) | (J2000) | (″) | () | () | |||
| 1 | 7 | 3 | 298 | 448 | 382 | 0.8 | |
| 2 | 13 | 6 | 248 | 263 | 165 | 2.0 | |
| 3 | 4 | 2 | 117 | 744 | 688 | 0.5 | |
| 4 | C | 11 | 5 | 74 | 309 | 177 | 1.3 |
| 5 | 5 | 2 | 61 | 657 | 416 | 0.7 | |
| 6 | 9 | 4 | 171 | 367 | 287 | 1.0 | |
| 7 | 15 | 7 | 86 | 226 | 246 | 1.5 | |
| 8 | D | 9 | 4 | 38 | 355 | 269 | 1.1 |
| 9 | 17 | 8 | 68 | 197 | 140 | ||
| 10 | 14 | 6 | 283 | 241 | 227 | 1.5 | |
| 11 | 16 | 8 | 114 | 201 | 140 |
The uncertainties in source positions derived from the numerical model fitting do not account for all contributing effects and are typically too small by a factor of ten. Two alternate methods were used to estimate the uncertainties in source position. Several sources are detected in several of the five sub-images which allowed the dispersion of measured positions to be determined directly as their standard deviation . This quantity was compared with where is the synthesized beam size and the signal-to-noise ratio . For the sources with a number of independent position measurements, and , differ by less than 20% and so was used for all sources. The uncertainties in right ascension and declination are assumed independent and quoted in Table 2 as and .
3.3 Source distribution
From Fig. 1 it is evident that the radio sources are clustered near the image centre. Our analysis of source positions is illustrated in Fig. 2 which shows the cumulative source count as a function of distance from the cluster centre. To quantify the size of the central group, the radial density variation N(r) has been modelled by a gaussian function added to a uniformly distributed background distribution
The fit given by , , is plotted on Fig. 2. The value of the parameter (which corresponds to 2.7 sources in the analysed area) can be compared with the expected density of background sources. From an analysis of the Phoenix Deep Survey [Hopkins et al. 1998], taking account for extended sources falling below the brightness detection limit and assuming a Poisson distribution of source counts in a given area of sky, we find an expected value for of or sources over the 10′ field. The number of sources detected in the field is similar to the expected number of background sources. Note however that 7 of the observed sources lie within 2′ of the cluster centre, compared with the sources expected from the Phoenix Deep Survey source counts.

3.4 Source variability
Observations of the pulsed emission from the pulsars in 47 Tuc [Robinson et al. 1995] show their flux density to vary strongly, presumably due to interstellar scintillation. However, most extragalactic radio sources have a larger angular extent (while still appearing point-like with the ATCA) and so do not scintillate, or do so only weakly. The observations described here allow us to make several flux measurements of some of the 47 Tuc sources. Each sub-image was examined at every source location listed in Table 2. A source was deemed visible in a sub-image if its flux exceeded 3 times the image rms from Table 1. Seven of the 11 sources had measureable flux by this criterion in three or more of the sub-images. Their fluxes are plotted in Fig. 3.

4 Discussion
We have presented in Table 2 a list of 11 radio sources within 5′ of the centre of 47 Tuc. The positions of two of these, 4 and 8, can be identified with pulsars 47 Tuc C and D respectively [Robinson et al. 1995]. These three sources have steep spectra, and and varying flux denstities as indicated in Fig. 3. Robinson et. al. report the spectral indices of 47 Tuc C (0.0) and D (-1.4) measured between 436 MHz and 640 MHz, suggesting that 47 Tuc D has a straight spectrum with slope -1.4 from 436 MHz to 1.7 GHz but that the spectrum of 47 Tuc C steepens above 640 MHz.
Source numbers 1 and 10 in Table 2 are likely to be background sources — both are distant from the cluster centre and have spectral indices typical of extragalactic objects. Source 1 shows little flux variation between the five observations. Source 3 also has a flat spectrum and is probably extragalactic, although some flux variability is suggested. Sources 2 and 5 both exhibit flux variations, 5 strongly so, and have very steep spectra and so it seems likely that both are pulsars. The great distance of source 2 from the cluster centre (248″) makes it an interesting pulsar candidate. Source 5 has a steep spectrum and variability characteristic of a pulsar and is stronger than sources 4 and 8 (pulsars C and D), but the pulse timing analyses of Robinson et al. (1995) did not yield pulsar parameters for its location. Perhaps source 5 is a pulsar with properties that make the timing analysis difficult or that cause its pulses to be undetectable, such as a pulse period outside the range of the original observations, an extraordinary binary motion or a dense local environment strongly scattering the pulsed radiation. The case for the apparently constant source 6 being a pulsar is not strong, although it has a spectrum a little steeper than expected for background objects. Sources 7, 9 and 11 are faint, making variability and spectral shape difficult to measure. We note a similarity in the pattern of intensity variations between sources 4 and 8 (Fig. 3). We can find no instrumental effect which could lead to such apparent variations that would not similarly effect the other sources in the field. On the other hand, variability induced by scintillation in sources as separated as these is difficult to understand.
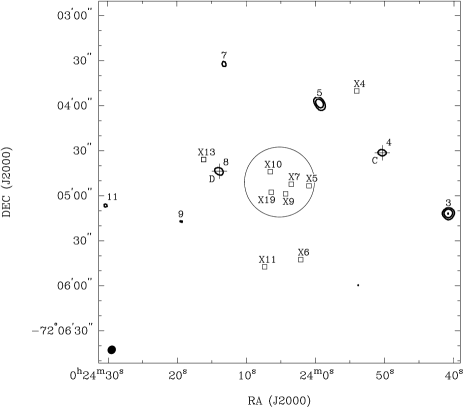
Verbunt and Hasinger (1998) report the positions of a number of X-ray sources in 47 Tuc, nine of which lie close to the cluster core. Fig. 4 shows their locations relative to the radio source positions and the locations of pulsars C and D. It is evident that the X-ray sources belong to two populations, those within the cluster core, and those represented by X4, X6, X11 and X13 which have a radial distribution similar to that of the radio sources. Verbunt and Hasinger are unable to provide a positive identification for any of them, but point out that their luminosities are consistent with them being soft X-ray transients, cataclysmic variables or recycled pulsars. The first epoch of the X-ray detections reported by Verbunt and Hasinger is close to the date of our most sensitive observations (1992 April). We note that none of the X-ray sources coincide with any of the radio sources.
We have presented a radio image of the central region of 47 Tuc and shown a concentration of radio sources close to the cluster core. Although a direct correspondence between radio sources and pulsars is possible in only two cases, it seems likely that several of the other detected sources are also pulsars. Thus the distribution of sources in the image is likely to be representative of the spatial distribution of pulsars in the cluster. We can now differentiate several classes of object, each with its own characteristic radial distribution. There is a class of X-ray object represented by sources X5, X7, X9, X10 and X19 in the catalogue of Verbunt and Hasinger (1998) which are confined to the stellar core of the cluster. There is a second class of X-ray object (represented by X4, X6, X11, X13, Verbunt and Hasinger) which lie typically 2 – 5 core radii from the cluster centre. Finally there are the radio sources (possibly pulsars) whose distribution is similar to that of the outer X-ray class, but which may have some members very far (10 core radii) from the cluster core.
Acknowledgements
The Australia Telescope Compact Array is funded by the Commonwealth of Australia for operation as a National Facility by CSIRO. The optical image in this paper is taken from the Digital Sky Survey. This image is based on photographic data obtained using the UK Schmidt Telescope. The UK Schmidt Telescope was operated by the Royal Observatory Edinburgh, with funding from the UK Science and Engineering Research Council, until 1988 June, and therafter by the Anglo-Australian Observatory. Original plate material is copyright of the Royal Observatory Edinburgh and the Anglo-Australian Observatory. The plate was processed into the present compressed digital form with their permission. The Digital Sky Survey was produced at the Space Telescope Science Institute under US Government grant NAG W-2166. We are grateful to the referee, Professor J. Bell Burnell, for her helpful comments on the manuscript.
References
- [Calzetti et al. 1998] Calzetti, D., De Marchi, Paresce, F. and Shara, M., 1993, ApJ, 402, L1-L4
- [Guhathakurta et al. 1992] Guhathakurta P., Yanny B., Schneider D., Bahcall J., 1992, AJ, 104, 1790
- [Hopkins et al. 1998] Hopkins A. M., Mobasher B., Cram L. and Rowan-Robinson M., 1998, MNRAS 296, 839-846
- [Kulkarni et al. 1990] Kulkarni S., Goss W. M., Wolszczan A., Middleditch J., 1990, ApJ, 363, L5
- [Robinson et al. 1995] Robinson C. R., Lyne A. G., Manchester R. N., Bailes M., D’Amico N., Johnston S., 1995, MNRAS, 274, 547
- [Verbunt & Hasinger 1998] Verbunt F., Hasinger G., 1998, A&A, 336, 895