Detection of CO and Dust Emission in Near-Infrared Spectra of SN 1998S
Abstract
Near-infrared spectra (0.95 – 2.4 µm) of the peculiar Type IIn supernova 1998S in NGC 3877 from 95 to 355 days after maximum light are presented. K-band data taken at days 95 and 225 show the presence of the first overtone of CO emission near 2.3 µm, which is gone by day 355. An apparent extended blue wing on the CO profile in the day 95 spectrum could indicate a large CO expansion velocity ( 2000 – 3000 km s-1). This is the third detection of infrared CO emission in nearly as many Type II supernovae studied, implying that molecule formation may be fairly common in Type II events, and that the early formation of molecules in SN 1987A may be typical rather than exceptional. Multi-peak hydrogen and helium lines suggest that SN 1998S is interacting with a circumstellar disk, and the fading of the red side of this profile with time is suggestive of dust formation in the ejecta, perhaps induced by CO cooling. Continuum emission that rises towards longer wavelengths (J K) is seen after day 225 with an estimated near-infrared luminosity erg s-1. This may be related to the near-infrared excesses seen in a number of other supernovae. If this continuum is due to free-free emission, it requires an exceptionally shallow density profile. On the other hand, the shape of the continuum is well fit by a 1200 K blackbody spectrum possibly due to thermal emission from dust. Interestingly, we observe a similar 1200 K blackbody-like, near-infrared continuum in SN 1997ab, another Type IIn supernova at an even later post-maximum epoch (day 1064+). A number of dust emission scenarios are discussed, and we conclude that the NIR dust continuum is likely powered by the interaction of SN 1998S with the circumstellar medium.
1 Introduction
Detection of molecular emission in SN 1987A opened up a new era in the study of supernovae (SNe). Analysis of molecular emission in SNe can provide a wealth of unique information about the progenitor’s interior structure, the explosion mechanism and, in general, about the dynamics of the explosion. In addition, the presence of molecules can directly affect the physical conditions in the SN ejecta.
For example, carbon monoxide (CO) can be used as a sensitive probe of mixing in the helium cores of supernovae. The presence of He+ or He++ that is microscopically mixed within the carbon-oxygen layers will destroy the CO molecules via charge transfer reactions. Therefore, the presence of CO establishes that such microscopic mixing has not occurred (Lepp, Dalgarno, & McCray (1990); Gearhart et al. (1999)) or, if it has, the helium has not been ionized. In SNe II, the ionization of He requires non-thermal processes, either strong radiation from the decay of radioactive elements such as 56Ni, or non-thermal electrons. Clumps of nickel within a C/O/He mixture could ionize the helium, so the presence of CO puts limits on the optical thickness of such clumps and hence the amount of mixing of Ni-rich layers. For non-thermal particles to have an effect on CO emission, the inner Ni-rich layer must itself be microscopically mixed with both the He and the C/O because of the short stopping length of non-thermal particles in the presence of any finite magnetic field.
Band profile modeling of the CO emission can also be used to infer the excitation temperature of the molecular emission. Transitions from different vibrational levels create a fine structure in the near-infrared bands, and the relative strength of the different band heads can be used as a temperature diagnostic (Sharp & Höflich 1989). From the width of fine structure CO features, one can obtain information about the extent (in velocity space) of the carbon and oxygen rich layers. In addition, both the total mass and the excitation temperature can be inferred from late, optically thin CO emission. In SN 1987A, Liu, Dalgarno, & Lepp (1992) derived a mass and a temperature K at that declined to K by (but see Gearhart et al. (1999)). Similarly, Spyromilio & Leibundgut (1996) (hereafter SL96) inferred a CO mass of and a temperature of 3000–4000 K, from their spectrum of SN 1995ad.
Molecules can also act as powerful coolants of supernova ejecta since they possess a large number of collisionally excitable transitions. In fact, in relatively cool ejecta (a few thousand K), CO emission could well be the dominant cooling process. This cooling, in turn, might pave the way to dust formation in SNe. Thus, to compute accurate radiative transfer models in the cooling ejecta at late times, it is important to include and understand the molecular formation, destruction, and emission processes that occur in supernovae (Liu, Dalgarno & Lepp 1992; SL96; Liu & Dalgarno (1994); Liu & Dalgarno (1995); Gearhart et al. (1999)).
Unfortunately, few near-infrared (NIR) spectra of supernovae currently exist in the literature, making molecule formation in supernovae a poorly studied phenomenon. To date, molecular emission has only been seen in the spectra of two supernovae, both of Type II. Molecules of CO, SiO, and H were seen in SN 1987A (Catchpole & Glass (1987); Spyromilio et al. (1988); McCray (1993) and references therein) and CO was detected in SN 1995ad (SL96). In this paper, we present evidence for CO emission in a third supernova: the Type IIn event SN 1998S.
SN 1998S was discovered in NGC 3877 by Z. Wan (Li, Li, & Wan (1998); Qiu (1998)) on 2 March 1998. It was classified as a Type IIn supernova (Schlegel (1990)) by Filippenko & Moran (1998), but it soon became apparent that SN 1998S was a peculiar variant of the Type IIn class. Garnavich et al. (1998a) reported unusually strong He II (4686 Å) and permitted N III/C III (4640 Å) lines in a pre-maximum spectrum, as well as broad emission at 5800 Å and 7100 Å due to C IV and C II lines often found in Wolf-Rayet stars. Near maximum light, the He II (4686 Å) and N III/C III (4640 Å) features had nearly disappeared and the H and H profiles had become asymmetric with steep blue wings (Cao, Qiu, & Qiao (1998)). Shortly after maximum, the optical spectrum developed a deep broad absorption near 6286 Å which was identified as the Si II (6347, 6371 Å) blend often seen in Type Ia supernovae (Garnavich, Jha, & Kirshner (1998)). Optical and near-infrared spectra taken near day 230 revealed prominent H and He I 10830 Å emissions (Garnavich et al. 1998b , hereafter G98b) with line profiles unlike those seen in the UV lines (Garnavich, Challis, & Kirshner (1998), hereafter GCK98). G98b report that the H emission had a full width at its base of 14 400 km s-1, with three sharp and well-resolved peaks at –4650, –400, and +3700 km s-1, possibly indicating interaction with a circumstellar disk or ring.
2 Observations and Data Reduction
Low-dispersion optical and near-infrared (NIR) spectra of SN 1998S were obtained with the MDM Observatory 2.4m Hiltner telescope at Kitt Peak, Arizona. Table 1 lists the log of spectroscopic observation times and parameters. Optical spectra were collected using the Modspec grating spectrograph in two low resolution ( Å) setups. The optical data were flux calibrated using Massey et al. (1988) standard stars and the long wavelength extensions of Massey & Gronwall (1990).
Near-infrared observations were made with the OSU-NOAO Infrared Imager/Spectrometer (ONIS), a high-throughput infrared imager/spectrograph with an ALLADIN 512x1024 InSb detector. This instrument can be operated with standard J, H, and K filters for broadband imaging, or with a variety of grisms, blocking filters and an east-west oriented and slits, allowing low () and moderate () resolution spectroscopic observations from 0.95 to 2.5 µm.
The near-infrared spectra were corrected for telluric absorption by observing nearby A stars, and early G dwarfs from the Bright Star Catalog (Hoffleit & Jaschek (1982).) Applying the procedure described by Hanson, Rieke, & Luhman (1998) (hereafter HRL98), stellar features were removed from the G dwarf spectra by dividing by a normalized solar spectrum (Livingston & Wallace (1991); Wallace, Hinkle & Livingston (1993)111NSO/Kitt Peak FTS data used here were produced by NSF/NOAO.). The resulting spectra were used to correct for telluric absorption in the A stars. The hydrogen features in the corrected A star spectra were removed from the raw A star spectra and the results were used to correct the target data for telluric absorption. [For further discussion of this procedure see HRL98, Hanson, Conti, & Rieke (1996), and references therein.] The instrumental response was calibrated by matching the continuum of the A star telluric standards to the stellar atmosphere models of Kurucz (1994).
Absolute flux levels for the spectra were set by matching the flux to the broadband photometry averaged over a square bandpass. Using ONIS in imaging mode, we obtained J, H and K images of SN 1998S and HST/2MASS photometric standards (Persson et al. (1998)) yielding photometry concurrent to the spectra. The photometric results are presented in Table 2 and absolute flux levels obtained for the spectra are believed accurate to 20–30%.
The data are arranged into observations of four epochs, based on a date for of 18 March 1998. (Garnavich, priv. comm.) Although observations of the various wavelength regions were sometimes spaced a few days apart, within each epoch we treat the data as concurrent and refer to it by a single average date. This grouping of the data seemed reasonable, as SN 1998S was only observed at late times when it was evolving relatively slowly and changed little on a timescale of days. The specific observation times for the various wavelength regions are listed in Table 1.
While most spectra were obtained in photometric or near photometric conditions, the day 260 spectrum was observed through variable cirrus. As a result, these data are quite noisy, and likely contain residual telluric features. The data from days 95 and 225, while observed under good weather conditions, were taken at rather high airmass, as SN 1998S was near the Sun in both June and October. The day 355 spectrum is an average of a large number of observations made over a three night period and has the best signal to noise of the post 200d spectra.
3 Results & Discussion
Reduced near-infrared and optical spectra of SN 1998S are presented in Figures 1 through 4. All have been Doppler corrected for the 902 km s-1 redshift of the host galaxy (De Vaucouleurs et al. (1991)). The time evolution of SN 1998S in the NIR is shown in Figure 1 with the individual spectra vertically offset for clarity and respective flux zero points marked for each plot. Identifications for prominent emission features in the NIR data for the first two epochs are shown in the blow-up of Figures 2 and 3. A list of detected near-infrared lines is given in Table 3. All the NIR data are presented in vacuum wavelengths. Figure 4 shows a plot of the day 225 optical spectrum with line identifications for most emission features marked.
Our day 95 spectrum (Fig. 2) is in good agreement with the roughly concurrent data obtained by Meikle and collaborators (priv. comm.). It also shows many similarities to the NIR spectrum of SN 1987A at day 192 (Meikle et al. (1989), hereafter M89). In fact, virtually all the features seen in this spectrum can be identified in the day 192 spectrum of SN 1987A (M89.) Strong features include Pa (1.282 µm), Mg I (1.183 µm and 1.503 µm), Br (2.166 µm), and the first overtone of CO, which rises near 2.28 µm. The 1.183 µm Mg I feature appears shifted somewhat to the red which may be due to blending with Si I lines near 1.2 µm. This feature was also observed shifted to the red in the SN 1987A spectrum (M89.) The bright feature seen coming up at the blue end of the J-band spectrum near 1.13 µm is likely O I (1.1287 µm) and the faint emission at 2.06 µm is probably He I 2.056 µm. The broad emission in the H-band, which rises at µm, is unlikely the second overtone CO emission (Gerardy et al. (1998)), but rather the blend of Si I, [Si I], [Ca II], [Fe II], Mg I, and Brackett series lines seen in the SN 1987A spectrum of M89. In SN 1987A, this feature was much less smooth, but differences with SN 1998S can be explained if the Brackett lines are weak and [Fe II] emission is weak or absent. This is consistent with Br being significantly weaker in SN 1998S than in SN 1987A.
Evolution of SN 1998S in the near-infrared between days 95 and 355 is apparent from Figure 1. Many of the broad emission lines seen in the day 95 data are absent in later spectra, with the spectrum longward of 1.3 µm dominated by continuum emission. At day 225, the NIR continuum rises from µm to µm, where it then levels out to a plateau in the K-band. Although at day 260 the rise to the red appears much weaker in the 1–1.8 µm region, this is likely an artifact of the poor observing conditions experienced when these data were obtained. The continuum level in the K-band measured via photometry indicates that the flux continues to rise from J through H to K. The late-time shape of the NIR continuum of SN 1998S is most clearly seen in the higher signal-to-noise spectrum at day 355. Here the rise in the continuum appears almost linear, with a somewhat shallower slope in the K-band.
While the continuum is the dominant NIR feature in the later data, a few line emission features remain. The first overtone CO emission although fainter, is still present in the day 225 spectrum, as is the 1.13 µm and 1.19 µm emission seen in the 95d spectrum. No trace of these features is seen in the 260d and 355d data. The most prominent emission lines in the post 200d spectra are two features with multiple peaks near 1.28 µm and 1.08 µm. The first is Pa and the second is a blend of He I (1.083 µm) and Pa.
A multi-peak line profile can also be seen in the optical spectrum on day 225 (compare Fig. 3 and Fig. 4). H, the dominant emission feature, exhibits a line profile with three strong peaks at –4900 km s-1, –300 km s-1, and +3300 km s-1, in rough agreement with those reported by G98b. Comparison of our data with that described by G98b indicate that measured velocity differences are due to real changes in the line profile over the 17 days between the two data sets (Garnavich, priv. comm.). This three-peak profile is also seen in H and He I (5876 Å). In the 225d NIR spectrum (Fig. 3), the 1.08 µm feature has four peaks. The first three of these peaks are He I 1.083 µm emission peaked at –4900, –500, and +3700 km s-1, matching the emission profile of H to within our measurement errors. The longest wavelength peak of this 1.08 µm feature corresponds to Pa emission at +3900 km s-1 and is probably the red edge of a three-peaked Pa profile, with the other two peaks being lost in the He I 1.083 µm emission. The Pa profile could be similarly triple peaked, but the line is in a region of fairly strong telluric absorption which is difficult to accurately remove from such a faint target. The strong peak at the red end of this feature corresponds to a Pa velocity of +3200 km s-1, which is close to the velocity of the red peak in the H profile.
Although the optical emission is dominated by bright H emission, other features can be seen (Fig 2.) These include broad emission from [O I] (6300, 6364 Å), [Ca II] (7291, 7334 Å), and Ca II (3933, 3969 Å). [O III] (4969, 5007 Å) is present as narrow emission, and possibly has a broad component as well, but the feature is blended with H. Two very broad emission features from 4200 to 4700 Å and from 5100 to 5400 Å are a blend of [Fe II] emission as reported by GKC98. Finally, we attribute the very broad feature from 8250 to 8800 Å to a blend of emission from O I 8446 Å, [C I] 8727 Å, and the Ca II IR triplet 8498, 8542, & 8662 Å.
3.1 Carbon Monoxide Emission
A full quantitative analysis of the observed CO emission requires detailed models for the explosion including any asphericity in the envelope, the spatial and time variation of the chemical structure and, in the case of SN 1998S, a good model for the interaction with the environment (see §3.2 below). As these details are not well constrained in SN 1998S, we will restrict ourselves to a fairly basic analysis. From the presence of CO emission, we know that ionized helium was not mixed with the underlying C/O rich layers on a microscopic scale (Lepp, Dalgarno, & McCray (1990)). Investigations of SN 1987A (Höflich, Sharp, & Zorec (1989)) concluded that solar C and O abundance could not produce CO features as strong as observed. This suggested that the abundances of C and O must be enriched, and that CO formation was being observed within the C/O-rich layers of the ejecta of SN 1987A. For SN1998S, neither the density slope nor the mass above the photosphere are well determined. Consequently, alternative explanations for the strength of the CO feature may be valid. In particular, a larger mass above the photosphere or a steeper density slopes in comparison to SN1987A would increase the C/O density.
Portions of the K-band spectra from days 95, 225, and 355 are displayed in Figure 5, showing the evolution of the CO emission. In the 95d spectrum, the CO feature declines to the red and is similar to the 192d spectrum of SN 1987A (M89); however, roughly concurrent data obtained by Meikle’s group show a flatter CO profile (priv. comm.). We have some concern that the red end of our CO data may be contaminated by residual telluric absorption. In the day 225 data, the CO feature is much fainter, and consequently the signal-to-noise is worse. Although the CO emission profile at day 225 looks relatively flat, the data are poorly constrained at the red end and thus we cannot be certain about its true shape. A flat emission profile would be in sharp contrast to the evolution of SN 1987A where the red end faded significantly before the blue (M89). Finally, by day 355 the CO feature faded below our detection limit. It is possible that the CO feature faded much earlier since there is no clear evidence of it in the day 260 spectrum, but these data are too noisy to rule out the presence of CO emission.
3.1.1 CO Temperature
The shape of the CO profile can constrain the temperature of the CO emitting region. LTE emission modeling of CO by Sharp and Höflich (1989) and Liu, Dalgarno, & Lepp (1992) has shown that if the temperature is much below 2000 K, the first two vibrational bands (v = 2 – 0, 2.2935 µm and v = 3 – 1, 2.3227 µm) have comparable flux levels while vibrational bands three and higher are significantly weaker by at least 20 - 30 percent. This leads to a noticeable break in the emission profile redward of the second band head. The 95 day spectrum of SN 1998S shows no sign of such a break. This flux distribution is consistent with a lower limit for the temperature at day 95 of K assuming LTE in the vibrational bands (Sharp & Höflich (1989)). If the flux distribution longward of the band head is flatter, as Meikle’s data suggest, a higher temperature is indicated.
The CO emission profile for day 225 is too noisy and uncertain to ascribe any CO temperature. We are therefore unable to determine if the temperature of the CO emitting region has changed, as it had for SN 1987A from about 3200 K to 1700 K during the interval between day 192 and 283 (Liu, Dalgarno & Lepp 1992).
3.1.2 Comparison to SN 1987A and the CO velocity
With so few observations of CO emission in supernovae, it is useful to compare the observed CO emission in SN 1998S to that seen in SN 1987A. In Figure 6 we compare the observed CO spectrum of SN 1998S at day 95 to the day 192 CO spectrum of SN 1987A presented by M89. We have shifted both spectra to the supernova rest-frame, and we have scaled the SN 1987A data to match the SN 1998S data at the continuum near 2.24 µm and near the CO peak in the 2.30 – 2.32 µm region. This plot shows that longward of the steep rise near 2.28 µm the profiles seem (at least qualitatively) quite similar, although our spectrum of SN 1998S does not show convincing evidence for strong CO band structure like that seen in SN 1987A. The narrow minima in the SN 1998S spectrum do not correspond to physical minima between bands and hence are most likely due to noise and residual telluric absorption features. Model calculations show that peak-to-trough variations at the level exhibited by SN 1987A result from a CO expansion velocity km s-1. It is possible, however, that the noise in our SN 1998S data could obscure the bandhead structure at this level. Much lower CO velocities, like the km s-1 CO velocity seen in Nova Cas 1993 for instance, can certainly be ruled out as the bandhead structure would be quite distinct (Evans et al (1996)).
Shortward of the rise near 2.28 µm, the SN 1987A and SN 1998S spectra in Figure 6 show significant differences. Although both spectra show excess emission in the 2.25 – 2.28 µm region, in SN 1987A this emission is due to an unidentified emission line which peaks around 2.65 µm, while in SN 1998S the emission in the region consists of a relatively smooth rise to the blue edge of the CO feature. This emission is not explained by moderate ( km s-1) velocity models of CO emission which predict quite a sharp drop to zero at the blue edge of the CO profile (Liu, Dalgarno, & Lepp 1992; Liu & Dalgarno (1995)). While it is possible that this emission in SN 1998S is due to noise or the blending of some unidentified feature with the CO emission, it certainly does not match the unidentified feature in SN 1987A.
On the other hand, the blue edge of the SN 1998S CO profile appears consistent with emission from CO at high velocity ( 2000 – 3000 km s-1). To illustrate this point, we have calculated a grid of CO emission models, varying the velocity, temperature, density profile and envelope mass, and compared the results to the observed SN 1998S CO emission profile. The details of the model calculations are discussed in Appendix A. Some examples of our results are shown in Figure 7 where the qualitative effects of varying the model parameters can be seen. Low temperatures show stronger emission in the lower vibrational bands compared to high temperatures and steeper density structures tend to result in a flatter decline of the CO-flux towards the red. Low expansion velocities preserve the strong band structure of the CO whereas velocities in excess of 3000 km s-1 almost smear the features out and, in the optically thick case, result in an offset of the CO features due to the Doppler shift corresponding to the photospheric expansion velocity. Also, as the expansion velocity increases, the short-wavelength edge of the profile grows an extended blue wing.
3.1.3 Comparison to CO models
Comparisons of several models with the observed day 95 CO profile are shown in Figure 8. These models have been taken from our grid of calculations without fine tuning the parameters to best match the data. In most respects, our data does not provide strong constraints on the emission model. Models with a wide range of parameters provide equally good fits to the data. Despite these uncertainties, however, we find that steeper density profiles, coupled with high expansion velocities tend to give better agreement with the observations. In particular, the observed emission at the blue edge of the CO profile, if due to CO emission, strongly favors high expansion velocities in the range of 2000 – 3000 km s-1.
We wish to emphasize that the comparison with the observations should not be regarded as a true model fit but rather as a proof of principle, as there are a number of complications that we have ignored in our models. First, high polarization has been observed in SN1998S both by the groups in Berkeley (Leonard et al. (1999), hereafter L99) and Texas (Wang et al. (1999)) which indicate deviations from sphericity of the order of 1/2. Second, the density structure may be quite clumpy, which whould change the formation time scales for CO as several processes go with the square or cube of the density. In addition, CO formation is a strong coolant and may significantly effect the temperature structure as in the case of SN1987A (e.g., Höflich (1988)). A more realistic treatment of the CO-spectrum requires full 3-D, NLTE radiation transport calculations for the time evolution, which is beyond the scope of this paper.
3.1.4 Implications of high velocity CO
Several important implications result if a high velocity CO interpretation is correct. The presence of high velocity CO is inconsistent with a progenitor of only moderate mass, 10 to 20 , as stars in this mass range have relatively little C and O compared to He and H and it is buried deeply within any ejecta. For 10 of ejecta and erg of kinetic energy, the mean velocity is about 3000 km s-1. (Note: The mean velocity typically corresponds to the local velocity about 30 percent of the way out in the ejecta mass.) For a star with a main sequence mass of , the C and O layers are at a mass fraction of 0.3 (Woosley & Weaver (1995)), making it difficult to produce substantial CO at km s-1.
For higher mass stars, on the other hand, the mass of C and O rises to become comparable to that of the helium, and the C/O layers extend comfortably beyond the region representing the mean velocity if a substantial amount of the mass of the hydrogen envelope has been expelled. Thus high velocity CO would imply that the progenitor of SN 1998S was a substantially massive star, in excess of 25 , and that the progenitor had lost a substantial portion of its hydrogen mass. This might be consistent with the weakness of the line seen in SN 1998S as compared to that observed in SN1987A, indicating a rather small hydrogen abundance. Furthermore, the hydrogen observed in SN1998S may be dominated by emission from the interaction region with the CSM. This might suggest that SN 1998S was a Wolf-Rayet star. Such an interpretation would be consistent with the Wolf-Rayet features seen in the early optical spectra (C II, C III, C IV, N III) (Garnavich et al 1998a) and is also supported by the model of Wang et al. (1999).
3.1.5 Is CO formation common?
Finally, we note that of the four Type II SNe for which near-infrared spectra have been published, (SN 1987A, SN 1995ad (SL96), SN 1998S (this paper) and SN 1995V (Fassia et al. (1998))) this is the third with detected CO emission. While this is certainly far from a statistical sample, it does suggest that CO emission may be a fairly common feature in the late-time spectra of Type II SNe. Obviously, more NIR spectra of Type II SNe in the 100 – 300 day time period are needed before one can determine the generality of CO emission in these events.
3.2 Multi-Peak Emission
Multi-peak emission profiles in the spectrum of SN 1998S are only seen in the hydrogen and helium lines. The [Ca II], [O I], and Ca II lines all have profiles that are peaked in the blue and fade to the red. The fact that we see evidence for the three-peaked profile in the hydrogen and helium lines, and only in these lines, suggests it is emission coming from circumstellar gas and not ejecta. Late-time optical spectra of Type IIn supernovae are dominated by emission from the circumstellar interaction (Filippenko (1997)). In this respect, SN 1998S is not an exception, although this three-peaked profile is certainly a peculiar variation.
The three peak line profile seen in SN 1998S can be naturally understood as the result of a supernova shock wave interacting with a disk shaped circumstellar medium. The high positive and negative velocity peaks of the hydrogen and helium emission line profiles can be explained as emission from an equatorial ring. For a uniformly emitting ring or disk expanding at a constant velocity,
| (1) |
(McCray, priv. comm.). In Fig 9a, we show a plot of this profile. In reality, the emission from shocked gas would have a finite width due to post-shock velocity dispersion. This will tend to round off the sharp edges, giving the profile a shape better matching the observed H profile. If the emission is coming from a thin annulus with a slight velocity gradient between the outer and inner edges, this will also tend to soften the peaks and give a somewhat smoother decline to zero intensity at the very highest velocities.
The similarity between Figure 9a and the multi-peak line profile suggests that the circumstellar emission in SN 1998S has a ring-shaped component. Such ring-shaped emission could be the natural result of the supernova shock wave colliding with a circumstellar ring or disk. While the central peak is not explained by such a simple picture, it may be related to the moderate-width emission which was the dominant late-time feature in the spectrum of the Type IIn SN 1988Z (Turatto et al. (1993); Aretxaga et al. (1999) and references therein). The low velocity peak can be plausibly explained by the introduction of a multi-component circumstellar medium, similar to the “clumpy wind” model proposed by Chugai & Danziger (1994) to explain the SN 1988Z emission profile.
Here we consider the case that the circumstellar disk around SN 1998S had a population of dense clouds embedded in a less dense inter-cloud medium. The expanding shock accelerates the intercloud gas to high velocity, which then radiates in a thin ring behind the shock front creating the high velocity peaks as described above, while the dense clouds undergo significantly less acceleration, and emission from these clouds could form the central peak.
For the shocked clouds, the post-shock velocity will be related to the cloud density by , where the constant of proportionality is a function of the dynamical pressure of the shock. If we assume a population of clouds that obeys a power law number density with a cutoff at which we treat as a free parameter, then taking the cloud emissivity gives a total flux from clouds moving at post-shock velocity . Since the dense clouds will also be emitting from a ring or disk in the cooling region behind the shock front, the observed line profile is obtained by convolving with the ring emission profile (Eq 1), resulting in
| (2) |
where
In Figure 9b we overplot a version of this simple model on the observed H profile. The outer parts of the model are emission from a thin annulus with a small (3%) velocity gradient, and a maximum velocity of 4300 km s-1. The central peak is the profile described by Equation 2, with and a cutoff velocity km s-1. The high and low velocity components have been blueshifted by 700 and 400 km s-1 respectively to better match the observed profile. This blueshift might be due to either obscuration by dust (see below) or asymmetries in the circumstellar interaction.
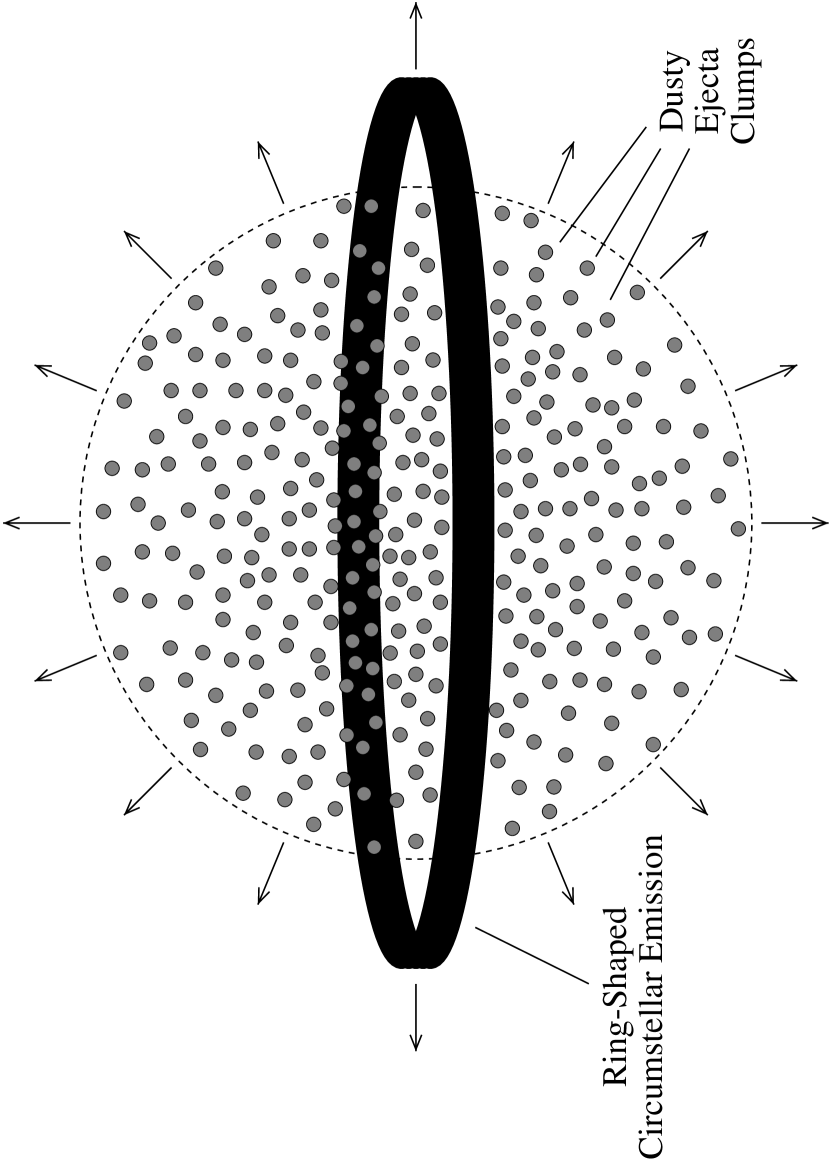
The evolution of the triple-peaked circumstellar emission feature is suggestive of dust formation in the supernova ejecta. In the 260d and 355d spectra, the red side of the 1.08 µm feature steadily fades, while the blue peak remains largely unchanged. Similar evolution was seen in the H and H profiles. (see Garnavich et al. (1999) in prep, and L99) A simple explanation for the evolution of the triple-peak profile is that dust has formed in the ejecta, inside the ring shaped emission, although the weakening of the red side due to asymmetries in the circumstellar interaction cannot be ruled out. There is relatively little difference between the late (red-side obscured) profiles of H and He I 1.08 µm, suggesting that the dust has formed in optically thick clumps. A schematic of the geometry implied by this picture is given in Figure 10.
Optical spectra taken earlier than our day 225 data may indicate that the red peak of the H profile was originally brighter than the blue peak, and then faded (L99). While this could again be due to asymmetries in the circumstellar interaction, it could also indicate the presence of dust in the circumstellar disk surrounding SN 1998S. If the expanding shock either sweeps out or destroys the circumstellar dust, and if the line of sight to the supernova is close to the plane of the circumstellar disk, then before the appearance of the dust in the ejecta, the blue peak would be suppressed relative to the red peak as observed by L99.
3.3 Near-Infrared Continuum
At t both the spectroscopic and photometric data show that SN 1998S exhibits a near-infrared spectral energy distribution which becomes brighter toward longer wavelengths. Similar near-infrared excesses have been previously observed in the photometry of a number of other supernovae including SN 1979C (Merrill (1980)), SN 1980K (Telesco et al. (1981)), SN 1982E (Graham et al. (1983); Graham & Meikle (1986)), SN 1982L, SN 1982R (Graham & Meikle (1986)), SN 1985L (Elias et al. (1986)), SN 1993J (Lewis et al. (1994)), and SN 1994Y (Garnavich, Noriega-Crespo & Moro-Martin (1996)). This NIR excess has usually be interpreted as thermal emission from dust, either forming in the ejecta, (Merrill (1980); Telesco et al. (1981); Dwek et al. (1983); Elias et al. (1986)), or lying in a pre-existing circumstellar medium and being heated by the initial supernova flash as an infrared echo (Bode & Evans (1980); Graham et al. (1983); Dwek (1983); Graham & Meikle (1986); Lewis et al. (1994); Garnavich, Noriega-Crespo & Moro-Martin (1996)) To our knowledge, this is the first time a near-infrared spectrum of this phenomenon has been published and conclusively demonstrates that this NIR excess, at least in SN 1998S, is indeed due to a rising continuum with little contribution from line emission.
3.3.1 Free-Free Emission
We begin by considering the plausible emission processes that could explain the NIR continuum seen in SN 1998S. At day 355, the rise in the NIR continuum flux, , with increasing wavelength may be accounted for either by free-free emission or by a thermal component due to dust emission. Bound-bound and free-free processes are the dominant opacity source in the IR at early times. In the low temperature and density of the late time environment the bound-free component becomes small in the infrared because the excited levels become depopulated. Free-free emission then dominates at late times in the absence of dust.
In the optically thin limit, continuum flux is proportional to the emissivity, , where is the opacity and S the source function. For free-free processes, , and the corresponding source function is given by a black body, , because the free electrons are thermalized. The latter relation holds for the IR if the temperature in the continuum-forming region is greater than 3000 K. For this case, . Thus, we can exclude this case for all the later spectra and especially for day 355.
If the continuum is optically thick in the IR due to free-free radiation, the flux is , where is the wavelength-dependent photospheric radius. The flux then depends on the radial depth from which the emission arises. For free-free absorption, . We assume that where would correspond to constant temperature as might represent a strongly NLTE atmosphere and would correspond to an LTE atmosphere with constant luminosity. Finally, we assume a power law density profile .
There are two limiting cases we can consider for the electron density, one in which the electron density is constant, due, for instance, to ionization by -rays, and one in which the electron density scales with the total (ion) density. The corresponding flux ratio at two wavelengths of the same optical depth ( 1) is then:
| (3) |
where corresponds to the case of constant and corresponds to the case with . This expression gives a constant slope for .
For the spectra of day 355, . We find that if the rise in the continuum to the red in the day 355 spectrum is due to optically-thick, free-free emission, the density slope must be fairly flat, 1 to 2. The only exception for this simple model is the case where (constant electron density) and (LTE atmosphere with declining T), for which could be as large as 2.5, still a rather shallow density gradient. Thus, if the continuum at day 355 is due to optically-thick free-free emission, then as the ejecta expand and turn optically thin, the continuum slope must decrease. If such a decline is not seen, then the implication is that the continuum is not due to free-free radiation.
At this time, optically thick free-free emission cannot be ruled out, although the required flat density slopes at the NIR photosphere are rather extreme. It is possible that the ejecta could remain optically thick at day 355, but to check this quantitatively requires a better understanding of the inner density and velocity profiles than are available. Any such estimates are also complicated by possible asymmetries in the ejecta.
3.3.2 Thermal Dust Emission
An alternative explanation for the late-time NIR continuum is thermal dust emission. If the continuum at day 355 is due to thermal emission from a dust of carbonates, it must have a corresponding blackbody temperature less than the 1600 K evaporation temperature (Gail & Sedlmayr (1984)). The peak of such a blackbody is at about 1.8 µm. Since we see no obvious continuum peak at this or shorter wavelengths, any dust in SN 1998S must be cooler than 1600 K. Carbonates start to condense below 1400 to 1100 K. T=1400 K corresponds to a Wien peak at 2.07 µm, so even this temperature may be an upper limit for our data.
We tried matching the day 355 data to blackbody curves with temperatures ranging from 1000 to 1400 K. This was complicated somewhat by the relatively large uncertainty in the relative flux level between the K-band and the shorter wavelength 0.95–1.75 region. Within a wavelength region that is observed with a single spectroscopic setting, the relative flux is set by the instrumental response and the telluric absorption correction, and should be accurate to 5% or better (at least outside of the regions of strong telluric absorption). Between data taken with different spectroscopic settings, however, the relative flux is only set by the photometric flux calibration, and is therefore subject to the 20–30% uncertainty in the absolute flux levels. Thus between the 0.95–1.75 µm and 1.99–2.40 µm regions (see Table 1) the relative fluxing is rather uncertain, and in matching the data to blackbody curves we treated the absolute flux level of the K-Band as a free parameter as long as the shifts in the data were less than about 30%. So for each temperature, the flux level was matched to the H-band region, and the K-band was then lowered or raised to match the level of the blackbody curve. For each temperature we could then judge the ‘fit’ by how well the blackbody curve matched the shape of the resulting (flux level adjusted) spectrum.
This procedure revealed that the 355d NIR continuum seen in SN 1998S could be well matched by a single blackbody with a temperature of K. This is illustrated in the top half of Figure 11, where a 1200 K blackbody curve is overlayed on first the unshifted data (top spectrum), and then on the same spectrum with the K-band region shifted down 16% (second spectrum from the top). Therefore the rise in the continuum towards the red in the day 355 data is consistent with, but does not prove the existence of, emission from hot dust.
Figure 11 also shows the late-time NIR spectrum for another Type IIn supernova, SN 1997ab. SN 1997ab was discovered on 11 April 1996 in objective prism data taken for the Hamburg Quasar survey, and was classified as a “Seyfert-1” Type II supernova (Type IIn) after a spectroscopic follow up on 28 February 1997 (Hagen & Reimers (1997)). Because it was quite luminous, on 11 April 1996 and faded to only by 2 March 1997 it was linked with the slow-fading SN IIn like SN 1988Z and SN 1987F (Hagen, Engels, & Reimers (1997)).
Our NIR spectra of SN 1997ab were taken on the same nights as those of SN 1998S at day 355, and reduced in the same fashion. One sees a very similar NIR continuum in SN 1997ab even though it was observed at a substantially later time (day 1064+). In fact, applying the same blackbody matching procedure to SN 1997ab as we did to SN 1998S again yielded a 1200 K temperature, although the temperature is probably a bit less constrained due to the lower signal-to-noise of the SN 1997ab spectrum. The striking similarity of the NIR continuum of SN 1998S and that of SN 1997ab suggests that the continuum in both objects is caused by the same physical process.
Assuming the NIR continuua of these objects are really due to 1200 K blackbody emission, then the implied NIR luminosities are erg s-1 for SN 1998S, and erg s-1 for SN 1997ab. If the assumption of a blackbody is wrong, a lower limit on the NIR continuum luminosities can be estimated from just the observed 0.95–2.40 µm flux, yielding luminosities of erg s-1 for SN 1998S and erg s-1 for SN 1997ab. In either case, the NIR luminosities for these two SNe are considerable.
Because SN 1998S and SN 1997ab have large NIR luminosities at such late time, we can rule out radioactive decay as the power source for the near-infrared continuum. This can be seen through a comparison of our observed NIR luminosities to the total radioactive power of SN 1987A at epochs similar to the ages of SN 1998S and SN 1997ab. For , the dominant energy source in SN 1987A was 56Co decay, and the total radioactive power was erg s-1 at t , which declined to erg s-1 by t (McCray (1993) and references therein). While this is just barely be enough to explain the SN 1998S luminosity at day 355 if all of the radioactive energy went directly into the NIR continuum via dust heating, it fails to explain the SN 1997ab luminosity at t by five orders of magnitude. Obviously a different power source is needed to explain this late time continuum.
3.3.3 Dust Emission Scenarios
If the continuum is due to thermal emission from dust, then one can ask the following: Where is the dust is located, how is it being heated, and why is the dust temperature the same in two objects that are of considerably different age? Here we discuss possible scenarios that could explain this late-time NIR continuum.
Perhaps the simplest model is that we are simply seeing emission from newly formed dust in the ejecta. Many novae display similar infrared excesses, often accompanied with a coincident drop in the optical flux, and this has been interpreted as evidence for dust forming in the expanding nova shells (Gehrz (1988), hereafter G88). This newly formed dust almost always has a temperature of T 1000–1200 K, suggesting that this is the characteristic temperature at which conditions are right for dust to condense (G88). In the 1–2.4 µm region, thermal emission would be dominated by this hottest component of the newly formed dust, and so the similar temperatures seen in both SN 1998S and SN 1997ab might be interpreted as an indication that dust is still forming in both of these objects. However, such an interpretation would require that either the epoch of dust formation is quite long, (on the order of years) or that we coincidentally observed both SN 1998S and SN 1997ab just as the dust was forming. Furthermore, this scenario still leaves the question of the very large late-time energy source for SN 1997ab unanswered.
Another possibility is that the emission is an infrared echo. In this scenario, dust formed in the ejected circumstellar envelope long before the explosion, and it is heated by the initial UV/optical flash of the supernova as it propagates outward into the surrounding material (Bode & Evans (1980); Dwek (1983)). The late-time energy source is then the luminosity of the supernova near maximum light, perhaps solving some of the energy requirement problems. For a spherically symmetric distribution of dust, the IR echo is dominated by emission from the hottest dust, and as the IR echo ages, the observed temperature should drop due to geometric dilution (Graham & Meikle (1986)). This model has been successfully used to explain the NIR light curve of SN 1982E (Graham et al. (1983); Graham & Meikle (1986)). This interpretation, however, would again require that the identical temperatures seen in both SN 1998S and SN 1997ab are purely accidental. Also, it is debatable whether the large observed NIR luminosity of SN 1997ab more than three years after maximum can be explained in the infrared echo model.
A third scenario is suggested by the Type IIn classification of SN 1998S and SN 1997ab. As both events show evidence of strong interaction with a dense circumstellar medium, it is plausible that the NIR continuum is due to dust heated by the circumstellar interaction. This interaction could power the observed NIR emission either directly through shock heating, or by heating the dust with X-ray emission from the interaction region. If the dust is X-ray heated, then we would expect an X-ray luminosity at least as large as the observed NIR luminosity. The large observed NIR fluxes for SN 1998S and SN 1997ab might be consistent with the late-time X-ray luminosities seen in some Type IIn objects. The X-ray luminosity SN 1988Z, for example, was erg s-1 more than six years after maximum (Fabian & Terlevich (1996)), so the large NIR luminosity of SN 1997ab three years after maximum could be powered by a similarly strong interaction. While we can not rule out X-ray heating, the direct conversion of bulk flow kinetic energy to heat through shock heating is certainly a more energetically economical scenario.
In either case, the dust could be pre-existing dust in the CSM, or newly formed dust in the supernova ejecta. Circumstellar dust could be heated by the outer blast wave, while dusty ejecta could be heated by a reverse shock traveling backwards into the supernova envelope. Likewise X-rays could heat any dust with a relatively unobscured line of sight to the interaction region, and so the NIR emission could be from either a dusty CSM or dusty ejecta. As discussed above (§3.2) the decline of the red-peak of the three-peak profile is strong evidence for the formation of dust in the ejecta of SN 1998S. While this dust could certainly be the source of the NIR emission, we cannot rule out the possibility that the emitting dust was pre-existing dust in the circumstellar disk. L99 inferred quite high densities ( cm-3) for the CSM, and it would not be unreasonable to suppose that dust formed in such an environment. Also, as discussed above, asymmetries in the H seen by L99 in spectra that pre-dates our day 225 data might be indicative of dust in the circumstellar disk around SN 1998S.
In principle, since we know both the temperature and the luminosity, we can infer an effective surface area for the emitting region. If the emitting region is a sphere, then the luminosity is given by , which yields effective radii of A.U. for SN 1998S, and A.U. for SN 1997ab. Both are consistent with ejecta expanding at an average velocity of km s-1 since the explosion. Deviations from spherical symmetry, or clumping of the dust will drive the effective radius up, perhaps greatly, so this implied emission radius is really only a lower limit. Since this limit is consistent with emission from either the ejecta or the CSM, we are unable to use this to distinguish between the two possible sources for the emitting dust.
Having the NIR continuum powered by the circumstellar interaction would help explain the similar temperatures seen in SN 1998S and SN 1997ab. Unlike the dust formation and IR echo scenarios which have energy sources that decline with time, the interaction would provide a fairly constant source of energy which could continuously heat the dust. Thus the observed temperature would not necessarily be expected to drop. The characteristic 1200 K temperature might be understood as the highest temperature allowed without destroying the dust grains. Since the 1–2.4 µm region is not sensitive to cooler dust we would always expect to measure a 1200 K temperature as long as the interaction is providing enough energy to keep a significant amount of dust at this temperature.
Thus, on balance we find that the luminous late-time NIR continuum in SN 1998S and SN 1997ab appears consistent with dust emission being powered by a strong circumstellar interaction. This interpretation is supported by the fact that of the previously observed supernovae exhibiting a late time infrared excess, five (SN 1994Y, SN 1993J, SN 1979C, SN 1980K, and SN 1985L) showed evidence of strong interaction with a surrounding circumstellar medium (Clocchiatti et al. (1994); Chugai & Dansiger (1994); Fransson, Lundqvist, & Chevalier (1996); Fesen & Matonick (1993); Fesen & Becker (1990); Fesen (1998)). On the basis of our data, we are unable to distinguish between direct shock heated dust and dust heated by X-rays from the interaction zone. X-ray observations of SN 1998S and SN 1997ab may be able to address this question.
4 Conclusions
We have presented near-infrared spectra of SN 1998S from about three months to almost a year after maximum. At day 95, the spectrum was quite similar to the day 192 spectrum of SN 1987A, exhibiting emission from H, He, CO, and a variety of low ionization features. As this is the third detection of CO in a very small sample of Type II SNe with NIR spectra, CO emission may be a fairly common feature of these events. Much more late-time NIR spectroscopy of Type II SNe is needed to address this question adequately.
An examination of the CO emission in SN 1998S indicates that the temperature of the CO region was 2000 K at day 95, perhaps as high as 3000–4000 K. There appears to be some excess emission shortward of 2.28 µm which might be a blue wing to the CO profile, which would indicate that the CO is moving at 2000 – 3000 km s-1. The lack of strong bandhead structure indicates that the CO is probably moving at least as fast as was observed in SN 1987A.
The later spectra of SN 1998S exhibit multi-peak emission line profiles in the hydrogen and helium lines. The high velocity peaks of the circumstellar features were shown to be emission from an equatorial ring, while the low velocity peak is consistent with a shocked population of dense clumps. This indicates that the circumstellar environment of SN 1998S has a strong disk shaped component.
The post 200d NIR spectrum of SN 1998S was dominated by a red continuum that is especially prominent rising to longer wavelengths in the data of day 355. This red continuum was also observed in the Type IIn SN 1997ab more than 1064 days after maximum, and the striking similarity of the NIR spectra suggest a common cause for the continuum in both objects. The emission seen in these objects is likely related to near-infrared excesses seen in the photometry of a number of other supernovae. This continuum could be due to free-free emission, but only if the ejecta is optically thick and only if the density profile at the effective photosphere is rather shallow. On the other hand, the NIR continuua in both SN 1998S and SN 1997ab are matched quite well by a 1200 K blackbody consistent with emission from hot dust.
The inferred NIR luminosities are quite high ( erg s-1 for SN 1997ab) and radioactive heating can be ruled out as a power source purely from energy requirement considerations. We find that the continuum is likely due to dust heated by the interaction with the CSM, either by direct shock-heating, or by absorption of X-rays from the interaction region. While there is strong evidence that dust has formed in the ejecta of SN 1998S, we cannot say whether the observed dust emission is from the ejecta, or from pre-existing dust in the circumstellar medium.
References
- Aretxaga et al. (1999) Aretxaga, I., Benetti, S., Terlevich, R. J., Fabian, A. C., Capellaro, E. Turatto, M. & Della Valle, M 1999, MNRAS, in press
- Avrett et al. (1996) Avrett E., Höflich P., Uitenbroek H., Ulmschneider P. 1996, Cool Stars, Stellar Systems, and the Sun, Eds. R. Pallivicini & A. K. Dupree, p.105. (San Francisco: Astronomical Society of the Pacific)
- Bode & Evans (1980) Bode M.F., Evans A. 1980, MNRAS, 193, 21
- Cao, Qiu, & Qiao (1998) Cao L., Qiu Y. L., & Qiao Q. Y. 1998, IAU Circ. 6830
- Catchpole & Glass (1987) Catchpole R., & Glass I. 1987, IAU Circ. 4457
- Chandrasekhar (1945) Chandrasekhar S. 1945, ApJ, 101, 95 & 328
- Chugai & Dansiger (1994) Chugai N. N., & Danziger I. J. 1994 MNRAS, 268, 173
- Clocchiatti et al. (1994) Clocchiatti A., et al. 1994 IAU Circ. 6065
- Dalgarno, Du & You (1990) Dalgarno A., Du M.L. You J.H. 1990 ApJ, 349, 675
- De Vaucouleurs et al. (1991) De Vaucouleurs G., De Vaucouleurs A., Corwin Jr. H.G., Buta R.J., Paturel G., & Fouque P. 1991, Third Reference Catalog of Bright Galaxies, Version 9 (New York: Springer-Verlag)
- Dwek (1983) Dwek E. 1983, ApJ, 274, 175
- Dwek et al. (1983) Dwek E., et al. 1983, ApJ, 274, 168
- Elias et al. (1986) Elias J. H., Matthews K., Neugebauer G., & Soifer B. T. 1986 BAAS, 18, 1016
- Evans et al (1996) Evans A., Geballe T. R., Rawlings J. M. C., & Scott A. D. 1996 MNRAS, 282, 1049
- Fabian & Terlevich (1996) Fabian A.C. & Terlevich R. 1996 MNRAS, 280, L5
- Fassia et al. (1998) Fassia A., Meikle W. P. S., Geballe T. R., Walton N. A., Pollacco D. L., Rutten R. G. M., & Tinney C. 1998, MNRAS, 299, 150
- Fesen & Becker (1990) Fesen R. A., & Becker R. H. 1990, ApJ, 351, 437
- Fesen & Matonick (1993) Fesen R. A., & Matonick D. M., ApJ, 407, 110
- Fesen (1998) Fesen R. A. 1998 AJ, 115, 1107
- Filippenko (1997) Filippenko A. V. 1997, ARA&A, 35, 309
- Filippenko & Moran (1998) Filippenko A. V. & Moran E. C. 1998, IAU Circ. 6830
- Fransson, Lundqvist, & Chevalier (1996) Fransson C., Lundqvist P., & Chevalier R. A. 1996, ApJ, 461, 993
- Gail & Sedlmayr (1984) Gail H.P. & Sedlmayr E. 1984, A&A, 132, 163
- Garnavich, Noriega-Crespo & Moro-Martin (1996) Garnavich P., Noriega-Crespo A., & Moro-Martin A. 1996, IAU Circ. 6314
- Garnavich, Jha, & Kirshner (1998) Garnavich P., Jha S., & Kirshner R. 1998, IAU Circ. 6860
- Garnavich et al. (1998a) Garnavich P., Jha S., Kirshner R. & Huchra J. 1998, IAU Circ. 6832
- (27) Garnavich P., Jha S., Kirshner R., Gerardy C., Fesen R., Calkins M., & Szentgyorgyi A. 1998, IAU Circ. 7058 (G98b)
- Garnavich, Challis, & Kirshner (1998) Garnavich P., Challis P., & Kirshner R. 1998, IAU Circ. 7047 (GKC98)
- Gearhart et al. (1999) Gearhart, R., Wheeler, J. C. & Swartz, D. A. 1998, ApJ, 510, 944
- Gehrz (1988) Gehrz R. D. 1988, ARA&A, 26, 377 (G88)
- Gerardy et al. (1998) Gerardy C. L., Fesen R. A., Wheeler J. C., & Höflich P. 1998, BAAS, 193.4707
- Graham et al. (1983) Graham J. R., Meikle W. P. S., Selby M. J., Allen D. A., Evans A., Pearce G., Bode M. F., Longmore A. J., & Williams P. M. 1983 Nature, 304, 709
- Graham & Meikle (1986) Graham J. R., & Meikle W. P. S. 1986 MNRAS, 221, 789
- Hagen, Engels, & Reimers (1997) Hagen H. -J., Engels D., Reimers D. 1997 A&A, 324, 29
- Hagen & Reimers (1997) Hagen M. -J. & Reimers D. 1997 IAU Circ. 6589
- Hanson, Conti, & Rieke (1996) Hanson M. M., Conti P. S., & Rieke M. J. 1996, ApJS, 107, 281
- Hanson, Rieke, & Luhman (1998) Hanson M. M., Rieke G. H., & Luhman K. L. 1998, AJ, 116, 1915 (HRL98)
- Hoffleit & Jaschek (1982) Hoffleit D, with Jaschek C. 1982, The Bright Star Catalog, 4th Revised Edition (New Haven: Yale University Observatory)
- Höflich (1988) Höflich P. 1988, PASA, 7, 434
- Höflich, Sharp, & Zorec (1989) Höflich P., Sharp C. & Zorec J. 1989, Particle Astrophysics, ed. E.B. Norman, p. 186, (World Scientific, Singapore)
- Höflich (1991) Höflich P. 1991, Supernovae, ed. S. Woosley, (Springer Press)
- Kurucz (1994) Kurucz R. L. 1994, Solar Abundance Model Atmospheres for 0,1,2,4,8 km/s, Kurucz CD-Rom No. 19
- Leonard et al. (1999) Leonard D. C., Filippenko A. V., Barth A. J., & Matheson T. 1999 ApJ, in press. (L99)
- Lepp, Dalgarno, & McCray (1990) Lepp S., Dalgarno A., & McCray R. 1990, ApJ, 358, 262
- Lewis et al. (1994) Lewis J. R., et al. 1994 MNRAS, 226, 27
- Li, Li, & Wan (1998) Li, W. -d., Li C., & Wan, Z. 1998, IAU Circ. 6829
- Liu & Dalgarno (1994) Liu W. & Dalgarno A. 1994, ApJ, 428, 139
- Liu & Dalgarno (1995) Liu W. & Dalgarno A. 1995, ApJ, 454, 479
- Liu, Dalgarno, & Lepp (1992) Liu W., Dalgarno A., & Lepp S. 1992, ApJ, 396, 679
- Livingston & Wallace (1991) Livingston W., & Wallace L. 1991 July, NSO Tech. Rept. #91–001
- Massey et al. (1988) Massey P., Strobel K., Barnes J. V., & Anderson E. 1988, ApJ, 328, 315
- Massey & Gronwall (1990) Massey P, & Gronwall C. 1990, ApJ, 358, 344
- McCray (1993) McCray R. 1993, ARA&A, 31, 175
- Meikle et al. (1989) Meikle W. P. S., Allen David A., Spyromilio J., & Varani G.-F. 1989, MNRAS, 238, 193 (M89)
- Merrill (1980) Merrill K. M. 1980, IAU Circ. 3444
- Mihalas, Kunatz & Hummer (1975) Mihalas D., Kunasz R.B., Hummer D.G., 1975, ApJ, 202, 465
- Mihalas, Kunatz & Hummer (1976) Mihalas D., Kunasz R.B., Hummer D.G., 1976, ApJ, 210, 419
- Persson et al. (1998) Persson S. E., Murphy D. C., Krzeminski W., Roth M., & Rieke M. J. 1998, ApJ, 116, 2475
- Petuchowski et al. (1989) Petuchowski S.J., Dwek E., Allen J.E., Nuth, J.A. 1989, ApJ, 342, 406
- Turatto et al. (1993) Turatto, M., Cappellaro, E., Danziger, I. J., Benetti, S., Gouiffes, C., & Della Valle, M. 1993, MNRAS, 265, 128.
- Qiu (1998) Qiu Y. L. 1998, IAU Circ. 6835
- Schlegel (1990) Schlegel, E. M. 1990, MNRAS, 244, 269
- Sharp & Höflich (1989) Sharp C. & Höflich P. 1989, Highlights of Astronomy, Vol. 8, p.207
- Spyromilio et al. (1988) Spyromilio J, Meikle W. P. S., Allen D. A., & Learner R. C. M. 1988, Nature, 334, 327
- Spyromilio & Leibundgut (1996) Spryomilio J, & Leibundgut B. 1996, MNRAS, 283, L89 (SL96)
- Telesco et al. (1981) Telesco C., Becklin E., Koehler R., & Gatley I. 1981 IAU Circ. 3613
- Wallace, Hinkle & Livingston (1993) Wallace L., Hinkle K., & Livingston W., 1993 April, NSO Tech. Rept. #93–001
- Wang et al. (1999) Wang L., Howell A., Höflich P., Wheeler J.C. 1999, ApJ, submitted
- Woosley & Weaver (1995) Woosely, S. E. & Weaver, T. A. 1995, ApJS, 101, 181
| Observation | Wavelength | Spectral | Spectroscopic | Infrared |
|---|---|---|---|---|
| Epoch | Coverage | Resolution | Observation | Photometry |
| (J.D. 2450895+) | (µm) | (km s-1) | Date | Date |
| 95 | 1.10 – 1.35 | 425 | 22 Jun 1998 | 20 Jun 1998 |
| 1.47 – 1.80 | 345 | 20 Jun 1998 | 20 Jun 1998 | |
| 1.99 – 2.40 | 400 | 20 Jun 1998 | 20 Jun 1998 | |
| 225 | 0.95 – 1.75 | 430 | 29 Oct 1998 | 01 Nov 1998 |
| 1.99 – 2.40 | 430 | 01 Nov 1998 | 01 Nov 1998 | |
| 260 | 0.95 – 1.75 | 430 | 04 Dec 1998 | 04 Dec 1998 |
| 1.99 – 2.40 | 430 | 04 Dec 1998 | 04 Dec 1998 | |
| 355 | 0.95 – 1.75 | 430 | 08–09 Mar 1999 | 08–09 Mar 1999 |
| 1.99 – 2.40 | 430 | 08–10 Mar 1999 | 08–09 Mar 1999 |
| Epoch | J | H | K |
|---|---|---|---|
| (J.D. 2450895+) | (mag) | (mag) | (mag) |
| 95 | |||
| 225 | |||
| 260 | |||
| 355 |
| Epoch | Line | Observed | ||
|---|---|---|---|---|
| (J.D. 2450895+) | (µm) | Identification | (µm) | Fluxaain units of erg s-1 cm-2 |
| 95 | 1.129 | O I | 1.1287 | 9 |
| 1.194 | Mg I | 1.1828 | 6 | |
| 1.284 | H I (Pa) | 1.2818 | 24 | |
| 1.503 | Mg I | 1.5031 | 4 | |
| 1.57 – 1.79 | H I (Br Series) | 1.570 – 1.737 | 14 | |
| Si I | 1.5888 | ” | ||
| [Fe II] | 1.5994, 1.6440, 1.6772 | ” | ||
| [Si I] | 1.6068, 1.6454 | ” | ||
| Mg I | 1.7109 | ” | ||
| 2.062 | He I | 2.0581 | 1 | |
| 2.171 | H I (Br) | 2.1655 | 6 | |
| 2.29 – 2.43 | CO () | 2.294 – 2.512 | 19 | |
| 225 | 1.085 | He I, H I (Pa) | 1.0830, 1.0938 | 13 |
| 1.13 | O I | 1.1287 | 3 | |
| 1.12 | Mg I | 1.1828 | 2 | |
| 1.285 | H I (Pa) | 1.2818 | ||
| 2.29 – 2.40 | CO () | 2.294 – 2.512 | 5 | |
| 260 | 1.079 | He I, H I (Pa) | 1.0830, 1.0938 | 9 |
| 1.281 | H I (Pa) | 1.2818 | 5 | |
| 355 | 1.076 | He I, H I (Pa) | 1.0830, 1.0938 | 6 |
| 1.277 | H I (Pa) | 1.2818 | 2 |
Appendix A Carbon Monoxide Emission Models
In order to analyze the SN 1998S CO spectrum, a total of 96 parameterized, spherically symmetric, and highly simplified models were calculated. In all of our models, the CO bands are optically thick and, consequently, cannot be treated in the Sobolev approximation. Instead, we solve the non-relativistic radiation transport equations in comoving frame using the method of Mihalas, Kunatz & Hummer (1975, 1976).
Power law density profiles have been studied with with . We assumed temperature profiles given by the analytic solution for scattering dominated atmospheres (Chandrasekhar (1945)) which represents a good first order solution for scattering dominated photospheres (e.g. Höflich (1991)). Thus, we use the following expression:
where
and the Rosseland optical depth is defined by the corresponding opacity
The parameter C represents the geometrical dilution of the radiation field in the optically thin case and it is taken as
with
Effective temperatures and photopsheric radii have been studied in the range between 3000 to 5500 K and cm, respectively. For low temperatures, the photosphere is ionization bound. The matter above the ionization region contributes little to the continuum optical depth and, consequently, the mass of the envelope above the photosphere is a free parameter which has been varied between 0.2 and 5 . Note that changing the mass above the photophere has a very similar effect to a variation of the C O abundances. Solar abundances were assumed. Bound-free and free-free opacities and the occupation numbers have been included in local thermodynamical equilibrium which has been found to be a good approximation for the IR (within our model assumptions). The full time dependent rate equations have been solved for the formation of CO including radiative, collisional and charge exchange processes according to Petuchowski et al. (1989) with modifications according to Avrett et al. (1996). The cross sections have been taken from Petuchowski et al. (1989) and Dalgarno, Du & You (1990), and references therein.
For the formation of CO, we include three-body association
and radiative associations
For the dissociation, we include
charge exchange reactions,
and radiative dissociation
with photon energies above 11.1, 8.3 and 14 eV, respectively. For the UV flux, we assume a geometrically diluted black body with .
The time-dependent rate equations were then integrated for a given time. For simplification, the photospheric radius and luminosity is assumed to be constant over this period of time. In Figure 12, we give the change of the CO abundance as a function of the assumed integration/formation time normalized to a duration of 90 days for the formation. In this example, the first overtone of CO is formed between 1.1 and 1.5 cm. The CO-abundance may be uncertain by a factor of 70% due to the uncertainty in the duration CO formation in SN1998S. Despite this uncertainty, the decoupling regions of photons change by only about 1/2 of a scale height, which implies a small radial change. Therefore, the results on the final spectra are rather insensitive. In our example, the CO emission changes by about 15%. For all the models in Figure 7, the duration of the CO-formation was set to 30 days.