The nature of the Vela X-ray ”jet”
Abstract
The nature of the Vela X-ray ”jet”, recently discovered by Markwardt & Ögelman (1995), is examined. It is suggested that the ”jet” arises along the interface of domelike deformations of the Rayleigh-Taylor unstable shell of the Vela supernova remnant; thereby the ”jet” is interpreted as a part of the general shell of the remnant. The origin of deformations as well as the general structure of the remnant are discussed in the framework of a model based on a cavity explosion of a supernova star. It is suggested that the shell deformations viewed at various angles appear as filamentary structures visible throughout the Vela supernova remnant at radio, optical, and X-ray wavelengths. A possible origin of the nebula of hard X-ray emission detected by Willmore et al. (1992) around the Vela pulsar is proposed.
Key Words.:
Shock waves – pulsars: individual: Vela – ISM: bubbles – ISM: individual objects: Vela supernova remnant – ISM: supernova remnants – X-rays: ISM1 Introduction
Recent observations of the Vela supernova remnant (SNR) by the ROSAT X-ray telescope revealed (Markwardt & Ögelman (1995)) a filamentary feature of irregular shape extended for about to the south-southwest from the Vela pulsar position (see also Harnden et al. (1985)). The characteristic length and width of this feature were estimated to be 6.5 and 1.7 pc, respectively, at the pulsar distance of 500 pc. The feature appears at energies above 0.7 keV (Markwardt & Ögelman (1995)) and, as it was shown by ASCA observations of Markwardt & Ögelman (1997; hereafter MÖ (97) ), is visible to energies of at least 7 keV. The end (”head”) of the X-ray feature coincides (Harnden et al. (1985); Markwardt & Ögelman (1995)) with the center of the brightest radio component of the Vela SNR, known as Vela X. Markwardt & Ögelman (1995) interpreted the X-ray filament as a ”cocoon” of hot plasma enveloping a one-sided jet emanating from the Vela pulsar (see also Frail et al. 1997 (hereafter FBMÖ ), MÖ (97)). In particular, FBMÖ suggested that the Vela ”jet” represents a channel along which energy is supplied from the pulsar into the radio source Vela X. Therethrough they supported the proposal of Weiler & Panagia (1980) that the Vela X is a plerion, i.e. a nebula powered by the pulsar. Wijers & Sigurdsson (1997) presented another view of the nature of the X-ray ”jet”. According to their scenario, the pre-supernova system was a binary, and the ”jet” is a channel, produced by a supersonically moving companion star, refilled by the material of the exploding star. We propose here an alternative explanation for the origin of the Vela X-ray ”jet”. We suggest that the ”jet” arises along the interface of domelike deformations of the shell of the SNR, which is projected by chance near the line of sight to the Vela pulsar. This explanation agrees with our (Gvaramadze 1998a ) proposal that the radio source Vela X is a part of the general shell of the Vela SNR (see also Milne & Manchester (1986)) and implies the similar origin of filamentary structures visible throughout the remnant in radio, optical and X-ray ranges. In Sect. 2, we examine the correlation between the ”jet” and the radio source Vela X, and discuss the existing models of the Vela X-ray ”jet”. In Sect. 3, we briefly review the observational data relevant to our model of the Vela SNR, which we outline in the same section. The origin of filamentary structures and the nature of the X-ray ”jet” are considered in Sect. 4. Sect. 5 deals with some issues related to our model. Sect. 6 summarizes the work.
2 The radio source Vela X and the X-ray ”jet”
The radio source Vela X is the brightest of three main radio components constituting the Vela SNR (e.g. Rishbeth (1958), Wilson & Bolton (1960), Milne (1968)). The maximum of its emission is shifted for about to the south-southwest from the pulsar. Radio observations of Milne (1995) and FBMÖ showed that a significant part of the radio emission of the Vela X appears as a system of highly polarized (, in places ), linear filaments (the characteristic width of which is about ), while the brightest one extends from the pulsar towards the center of the Vela X. Weiler & Panagia (1980) suggested that the Vela X is a plerion. The main arguments in support of this point of view (lately advocated by Dwarakanath (1991), FBMÖ , and Bock et al. (1998)) are a high degree of polarization of radio emission at high frequences, and a flat radio spectrum (these are the distinctive properties of pulsar-powered nebulae; e.g. Weiler & Sramek (1988)). Recent observational data allow us to disagree with the suggestion of Weiler & Panagia (1980). Our counter-arguments are the following. The high degree of polarization is not an exclusive property of the Vela X; observations of Duncan et al. (1996) revealed an ”arm” of polarization (up to ) running from the Vela X site to a latitude of . A comparison of the radio and optical images of the Vela SNR shows that the polarized ”arm” correlates with optical filaments in the western half of the Vela SNR (Bock & Gvaramadze (1999)), whose origin could be attributed to projection effects in the Rayleigh-Taylor unstable shell of the remnant (see Gvaramadze 1998a and Sect. 4). This means that highly polarized structures could be connected not only with pulsar-powered nebulae, but also with the shell deformations, whose interaction leads to the compression (i.e. amplification) of the (regular) magnetic field accumulated in the shell (see Sect. 3.3). As regards to the second argument, it was shown by Gvaramadze (1998a) that discrepancies in the determination of a spectral index for Vela X (Milne (1968); Weiler & Panagia 1980; Milne (1980); Milne & Manchester (1986); Weiler & Sramek (1988); Dwarakanath 1991; Milne 1995) are connected with smoothing of radio filaments on low-frequency maps, that leads to low values of the index. This instrumental effect is less pronounced at high frequencies, and the results obtained in this case are more reliable. So Milne (1995) showed that the spectral index of Vela X has a value between -0.4 and -0.8, i.e. close to the spectral indices of two other main radio components of the Vela SNR (known as Vela Y and Vela Z), which are equal to -0.5 (e.g. Dwarakanath 1991).
Another problem of the plerionic interpretation (mentioned by Milne & Manchester (1986)) is the non-central location of the Vela X. FBMÖ believe that the finding of the one-sided pulsar jet solves this problem. Let us consider their model at length.
FBMÖ found that the brightest radio filament not only stretches from the pulsar to the center of the Vela X, but also outlines the eastern edge of the X-ray ”jet”. They mentioned that this is the sole peculiarity of the brightest filament, which allows to distinguish it from other ones. At the same time, FBMÖ suggested that the brightest filament is a part of a cylindrical sheet enveloping the X-ray ”jet”. They connected the origin of this sheet with the compression of the ambient magnetic field by a freely expanding ”cocoon” of hot, X-ray-emitting plasma. The ”cocoon” in its turn arises in the course of interaction of a one-sided jet (originated due to some reason from the pulsar) with the ambient medium. As a possible observational test for their model, FBMÖ proposed that the radio spectral index of the brightest filament (the ”cocoon”) should be different from that of the rest parts of the Vela X. However, this proposal conflicts with the result of Milne (1995) that the spectral index of Vela X is uniform from filament to filament.
One of the problems of the jet model was pointed out and discussed by the authors of the model (FBMÖ , MÖ (97)). The point is that the model cannot explain the irregular shape of the ”jet” (it is wide close to the pulsar, then narrows, and then widens again; see Fig. 1 of Markwardt & Ögelman (1995), or Fig. 3 of FBMÖ ). According to the model, the width of the ”jet” should be maximum close to the pulsar and then monotonically decrease outwards.
As an argument in support of their model, MÖ (97) mentioned that only the X-ray ”jet” has a high-temperature ( keV) component, while other X-ray filaments in the Vela SNR have temperatures of keV. This however conflicts with the observations by Aschenbach (1998). The right panel of Fig. 1 of his paper shows that some features visible at radio, optical and/or soft X-ray wavelengths (e.g. the X-ray protrusion labelled by Aschenbach et al. (1995) as D/D’ and the U-type optical filament on the south edge of the remnant (see e.g. Fig.1 in the present paper or Fig. 2 in Gvaramadze 1998b )) have obvious hard ( keV) X-ray counterparts.
Another difficulty of the model is connected with the jet momentum. Wijers & Sigurdsson (1997) (see also Kawai & Tamura (1996)) noted that the momentum available in the pulsar emission is few orders of magnitude lower than the required jet momentum.
Also not clear is how the ”cocoon” (i.e. a thin cylindrical sheet enveloping the jet) can emit the X-ray radiation with spectral characteristics nearly identical to those of a portion of the SNR at least to the east from the jet (MÖ (97)).
Wijers & Sigurdsson (1997) proposed an alternative solution of the ”jet” problem. They suggested that the ”jet” is an asymmetrically expanding bubble filled with the material from near the core of the supernova (SN) star. The expansion of the bubble is powered by the pulsar spindown energy, while the asymmetry is due to the effect of the former companion star (a pulsar or a late-type main-sequence star), which creates a low-density channel in the circumstellar medium.
However, this model also predicts that the ”jet” should be wider towards the Vela pulsar.
The more serious difficulty of the model is that the bubble (the expansion velocity of which is about ) will never catch a cavern around the companion star (whose velocity is estimated to be in the range of ). This is easy to see from the following. The maximum radius of the trailing part of the cavern created by a companion star (let us choose for example a pulsar) is (e.g. Lipunov (1992))
where is the pulsar spindown luminosity, and are the number density and the temperature exterior to the bubble, respectively (the notations and numbers are adopted from Wijers & Sigurdsson (1997)). This estimation shows that there is no sufficiently long, low-density channel behind the companion star. The situation is even worse if one uses a set of parameters ( from the new model of the Vela ”jet” by MÖ (97).
The origin of the X-ray ”jet” was also discussed in our paper (Gvaramadze 1998a ), where we suggested that the ”jet” arised due to the Mach reflection of two semi-spherical shocks (domelike deformations of the SNR’s shell). This proposal was intended for the explanation of the ”jet” temperature of 1.2 keV given by Markwardt & Ögelman in their first (1995) paper, but it fails to explain the hard component of the X-ray emission (MÖ (97)), and the general appearance of the ”jet”.
3 The Vela SNR
3.1 General structure
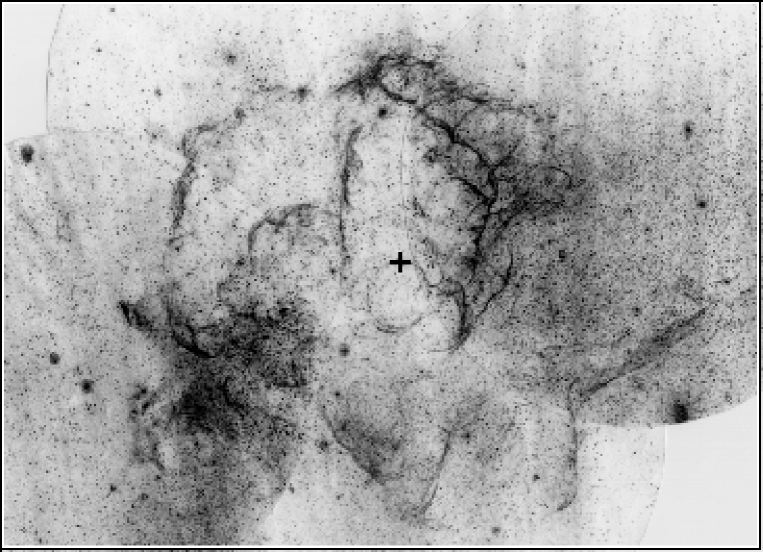
The Vela SNR is one of the nearest and most extended SNRs. It has about the same size of pc) in radio (Duncan et al. 1996), optical (Parker et al. (1979)) and X-ray (Aschenbach et al. 1995) ranges. In all these spectral ranges the Vela SNR appears as a shell source with a distinct asymmetry along the line perpendicular to the Galactic plane (see Fig.1). The northeast half of the main body of the remnant (faced towards the Galactic plane) has a well determined circular boundary of radius , whereas the southwest half is very disordered, with some (X-ray) features extended up to from the center (associated with the Vela pulsar position). There also exist several features protruding far outside the northeast rim of the remnant (Aschenbach et al. 1995; Strom et al. (1995); Duncan et al. 1996; Gvaramadze 1998a,b). The origin of these extended features and protrusions were considered by Gvaramadze (1998b) and Bock & Gvaramadze (1999). The age of the remnant was estimated to be years (Lyne et al. (1996)).
3.2 The X-ray data
The first spatially resolved X-ray maps of the Vela SNR (Kahn et al. 1985; hereafter KGHS ) confirm the early result (e.g. Seward et al. (1971), Gorenstein et al. (1974)) that the soft X-ray emission is dominated in the northwest and southeast quadrants of the remnant, though they also reveal some limb-brightening on the northeast edge. KGHS found that the X-ray emission is distributed in a patchy way, with significant spectral and intensity variations on angular scales ranging from several arcminutes to a few degrees. Another interesting finding of KGHS is that the soft X-ray structures generally correspond with optical filaments. Subsequent observations of the Vela SNR reveal (Seward (1990); Aschenbach et al. 1995) that the X-ray extension of this remnant is much larger than that which was found by KGHS . Particularly, Seward (1990) found a long, faint arc in the western part of the SNR, which was interpreted as a rim of the SNR’s shell (see also Aschenbach (1993)). The spectral analysis of the soft X-ray emission showed (KGHS ) that the emission is softer towards the Galactic plane. The characteristic X-ray temperature was estimated as keV, although a region of hard X-ray emission (with a temperature keV) of radius to the south-southwest of the pulsar was also discovered. Willmore et al. (1992; hereafter WESW ) found an elongated structure of hard X-ray emission (in the 2.5 - 25 keV band) in the center of the remnant. This structure stretches nearly symmetrically for about on either side of the pulsar in the northeast-southwest direction. WESW suggested that this structure is a synchrotron nebula (in Sect. 5 we discuss an alternative explanation of this structure). Then Markwardt & Ögelman (1995) discovered the X-ray ”jet”, which in its turn correlates with radio (Milne 1995; FBMÖ ) and optical (see Sect. 4) filaments. As it was mentioned above, the ”jet” extends to the south-southwest from the pulsar, so it is not aligned with the elongated structure found by WESW , though they are partially intersected close to the pulsar. And the last important result of X-ray studies of the Vela SNR is the discovery of a net of arcs and loops of intense soft X-rays which covers the whole remnant (Aschenbach (1997)).
It should also be noted that Aschenbach et al. (1995) proposed that the Vela SNR is immersed in a large-scale region of hot ( K) plasma (Aschenbach et al. 1995). Such hot surroundings are not unexpected if the Vela SNR is located inside the Gum Nebula, which was suggested to be an old SNR (Reynolds (1976)). We discuss this proposal in Sect. 5 and conclude that the Vela SNR is rather projected on this region (or vice versa), than is physically associated with it.
3.3 Model of the Vela SNR
The main point of our model of the Vela SNR is the statement that the general shape of the Vela SNR might be explained as a result of the interaction between the SN ejecta/shock and the pre-existing wind-driven shell created by the SN progenitor star in a density-stratified interstellar medium (with a density gradient perpendicular to the Galactic plane). It is obvious that the density gradient is not connected with the global stratification of the gaseous disk of the Galaxy (the scale-height of the disk few times exceeds the size of the Vela SNR), but caused by a density inhomogeneity of the local interstellar medium. Indeed, the existense of a large-scale region of enhanced density to the northeast of the Vela SNR (i.e. towards the Galactic plane) follows from the observations of Dame et al. (1987) and Dubner et al. (1992, 1998).
Preliminary analysis suggests that the Vela SNR is a result of type II supernova explosion, and that a progenitor star was a 15-20 star with mechanical luminosity in the range . This follows from the fact that though the Vela SNR expands in the low-density ambient medium, the size of this remnant is relatively small (as compared with sizes of wind-driven bubbles and shells created by more massive and luminous stars111See recent observations of such bubbles by Cappa and Benaglia (1998).).
The ionizing radiation of the progenitor star creates an H II region, the inner, homogenized part of which gradually expands due to the continuous photoevaporation of density inhomogeneities in stellar environs (McKee et al. (1984)). If is much smaller than some characteristic wind luminosity, , where is the stellar ionizing flux in units of and is the mean density the ambient medium would have if were homogenized, the stellar wind flows through a homogeneous medium with the number density and temperature K (for the sake of simplicity we neglect the density decrease due to the expansion of the H II region). E.g. for B0.5 V star with (Osterbrock (1989)) and , and for (Wallerstein & Silk (1971), Gorenstein et al. (1974)) one has that , therefore we can use the self-similar solutions by Avedisova (1972) and Weaver et al. (1977) to describe the early evolution of a wind-driven bubble in a homogeneous medium.
Initially the bubble is surrounded by a thin, dense shell of swept-up interstellar gas of radius
where , but eventually the gas pressure in the bubble becomes comparable to that of the ambient medium, and the bubble stalls, while the shell disappears. This happens at the moment i.e. is more than ten times smaller than the time spent by the SN progenitor star as a core hydrogen burning star, which is years (see e.g. Vanbeveren et al. (1998), Salasnich et al. (1999)). The radius of the stalled bubble is
Since the star continues to supply the energy in the bubble, the radius of the bubble continues to grow, , until the radiative losses in the bubble interior becomes comparable to . It can be shown that this happens for , where years. Then the bubble recedes to some stable radius , at which radiative losses exactly balance (D’Ercole (1992)):
The time needed for the bubble to shrink to is about years, where km/s is the isothermal sound speed in the ambient medium photoionized by the central star (D’Ercole (1992)). The great bulk of radiative losses is connected with a thin spherical layer close to , where nearly the whole mass of the bubble gas is concentrated. The main body of the bubble is occupied by a hot, tenuous gas with the number density (D’Ercole (1992)) and temperature . The mass of the bubble gas can be estimated from the following relation
where is a coefficient in the cooling function for the temperature range K (see McKee & Cowie (1977)), and is the mass of a hydrogen atom.
Before a star exploded as a supernova it becomes for a short time, years, a red supergiant (e.g. Vanbeveren et al. (1998)). The H II region outside the bubble cools off and recombines, while the radiative losses in the bubble interior are negligible on time-scales of . As a result, the bubble supersonically reexpands in the external cold medium and creates a new dense shell (see D’Ercole (1992); cf. Shull et al. (1985)). Let us assume that before the supernova exploded, the shell expands up to the radius of pc, i.e. nearly to the current radius of the Vela SNR. The mean expansion velocity of the shell is about 30 km/s. The number density of the shell can be estimated by the formula
| (1) |
where is the thickness of the shell. The strength of the magnetic field accumulated inside the shell can be estimated from the following relation
| (2) |
where is the strength of the local interstellar magnetic field (here we neglect, for the sake of simplicity, the effects connected with the magnetic poles, which should inevitably arise in a more realistic approach to the problem (e.g. Ferrière et al. (1991))). The thickness of the shell is determined by the balance of the thermal pressure of the hot bubble plasma, the magnetic pressure of the shell, and the ram pressure, so we have
| (3) |
The strength of the local interstellar magnetic field can be scaled from the mean Galactic magnetic field strength G by the following relation , where is the mean Galactic number density, i.e. for , one has G. To estimate the parameters of the shell we assume that at the moment of supernova explosion the shell velocity is equal to 10 km/s. From equation (3) one has that the shell thickness is . Given , we can estimate the number density (see equation (1), , and the strength of the magnetic field in the shell (see equation (2)), . The mass of the shell is
| (4) |
It is known that the mass of a shell is a decisive factor, which determines the evolution of a SN shock (e.g. Franco et al. (1991)). If the mass of a shell is smaller than , where is the mass of a SN ejecta, the SN shock overruns the shell and continues to evolve adiabatically (as a Sedov-Taylor blast wave). For more massive ones, the SN shock merges with the shell, and the reaccelerated shell evolves into a momentum-conserving stage, that is
| (5) |
where and are the radius and the velocity of the SNR’s shell (the former wind-driven shell), respectively. We believe that just this situation takes place in the Vela SNR. Indeed, a progenitor star ends its evolution as a red supergiant (e.g. Vanbeveren et al. (1998)), therefore the mass of the supernova ejecta is , i.e. (see equation (4)).
It is also known from numerical simulations (e.g. Tenorio-Tagle et al. (1991)) that the reaccelerated shell acquires a kinetic energy , where is the initial explosion energy, . For the current radius of the Vela SNR pc, the mass of the shell is . Assuming that the current expansion velocity of the Vela remnant’s shell is (see Jenkins et al. (1984))222Note that this is the mean velocity of the shell expansion, whereas some portions of the shell (deformations) expand with much higher speeds (e.g. Wallerstein & Silk (1971), Jenkins et al. (1984), Danks & Sembach (1995)). one has , that corresponds to the initial explosion energy (for ) .
4 Deformations of the WDS and the origin of filamentary structures
4.1 Characteristic scale of deformations
After the supernova exploded, the SN ejecta/shock expands almost freely333For simplicity, we neglect the influence of a slow, dense material lost by the SN progenitor star during the red supergiant stage on the propagation of the SN shock through the bubble interior (see however Sect. 5). until it catches up with the wind-driven shell. The impact of the SN ejecta/shock with the shell causes the development of Rayleigh-Taylor instability (e.g. Sharp (1984)). For the crude order of magnitude estimation of the characteristic scale of the instability (i.e. the characteristic scale of deformations of the SNR’s shell) one can use the following well-known formula444Three-dimensional MHD simulations of the Rayleigh-Taylor instability developed on the boundary between two semi-infinite slab regions showed (Jun et al. (1995)) good correspondence with the predictions of the linear theory. Analogous numerical simulations but for a finite-thickness magnetized spherical layer (i.e. a wind-driven shell) reaccelerated by a blast wave would be highly desirable. (see e.g. Blake (1972))
| (6) |
where and are, respectively, the magnetic field strength and the number density in the reaccelerated wind-driven shell (now the SNR’s shell), is the acceleration of the shell caused by the impact of the SN ejecta/shock. and can be estimated by the following formulae
where km/s is the initial expansion velocity of the SNR (see eq. (5)), is the characteristic radius of the Vela SNR ( pc), pc is the characteristic thickness of the SNR’s shell. For one has the estimation , where is the crossing time of the SN shock through the shell (we assume that the interaction time, i.e. the time of reacceleration, is of the same order as the crossing time (cf. Chevalier & Liang (1989))), , and is the SN shock velocity in the shell, . For the mean number density of the bubble gas, , and for the mass of the ejecta (see Sect. 3.3), one has and . Then from (6) one has pc. This is a reasonable value, taking into account the roughness of our analysis. Note, however, that the scale of deformations depends on the mass (as well as the magnetic field) distribution over the SNR’s shell, and should undergo considerable changes from place to place. We see from Fig.1 that the instability initiates small-scale deformations in the northeast (more massive, see Sect. 3.3) half of the shell, thereby does not significantly disturb its initially circular shape. The situation is more dramatic in the southwest (less massive) half of the SNR. The dynamical force of the SN ejecta strongly deforms the shell and even disrupts it in places (see Fig.1). A hot gas escapes through the gaps in the SNR’s shell and forms radial outflows partially bounded by filamentary structures (see Gvaramadze (1998a,b), where an overlay of contours of soft X-ray emission (Aschenbach et al. 1995) with a mosaic of optical photographs (Parker et al. (1979)) is presented). The large-scale domelike deformations of the remnant’s shell, if looked at sideways, appear as U-type or arclike filaments; numerous examples of such structures exist along the southeast, south and southwest edges of the Vela SNR. The same deformations but viewed head-on appear as circular filaments; two prominent circular filaments are visible in the central part of the Vela SNR (see Fig.1). We interpret these partially
intersecting filaments as outlines of two ”blisters” on the surface of the SNR, and suggest that these ”blisters” interact with each other due to the lateral expansion555The anonymous referee mentioned that due to the projection effect these blisters may not be physically adjacent. Though this is not impossible, we believe that the interaction of blisters really takes place (see Sect. 4.2).. The characteristic size of the ”blisters” is about pc).
4.2 The interaction of deformations and the origin of filamentary structures
The growth of the deformations of the shell is accompanied by the mass redistribution over their surfaces. The matter streams down from the tops of deformations towards the periphery and accumulates there. The density contrast increases still more on the nonlinear stage of the Rayleigh-Taylor instability, when nearby ”blisters” come into contact with each other. The origin of dense sheets of matter (the so-called spikes) radially moving with the nearly ”free-fall” velocity (in the reference system of the expanding shell) is the result of this interaction. The most dense spikes arise in the regions of collective interaction of several deformations.
The obvious indications of the collective interaction of deformations exist in the central part of the Vela SNR, in particular, to the south and west from the Vela pulsar (Fig.1; see also the excellent image of the Vela SNR by Miller & Muzzio (1975)). Fig.2 shows
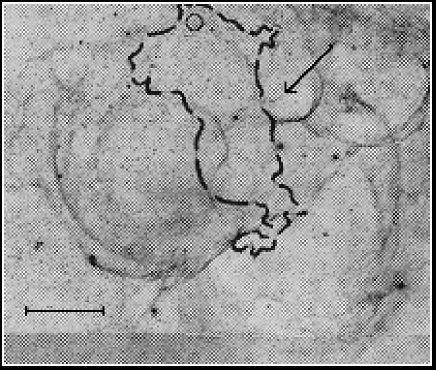
two circular filaments, which we interpreted in Sect. 4.1 as outlines of two interacting ”blisters” on the SNR’s shell. The ”blisters” are surrounded by a few less pronounced deformations of smaller sizes, one of which (shown by the arrow) contacts with the northwest edge of the eastern ”blister”, not far from the Vela pulsar position. Note that the pulsar is situated just on the (northern) edge of the eastern ”blister”. The ”blisters” meet each other in the area shifted for about to the south-southwest from the pulsar. It is of interest that this area666We interpret this area as a Mach shock arising in the course of collision of two semi-spherical shock waves, or as a splash of the antispike, which arises on the nonlinear stage of the Rayleigh-Taylor instability of a thin shell (see Ott (1972), Verdon et al. (1982)). Our interpretation is testable. It would be interesting to measure (e.g. through the absorption lines in spectra of background stars (e.g. Jenkins et al. (1984))) the expansion velocities of the shell in the region of interction of ”blisters”. One might expect the velocity in this region to change abruptly (Gvaramadze 1998a ), which is a result of the passage through the surface of the tangential discontinuity or the boundary of the antispike., outlined by distinctly visible optical filaments, coincides both with the ”head” of the X-ray ”jet” and with the center of the radio source Vela X. Moreover, the optical filament on the east edge of the area traces about 60 percent of the X-ray ”jet” (see Fig.2 and Fig.3). Another
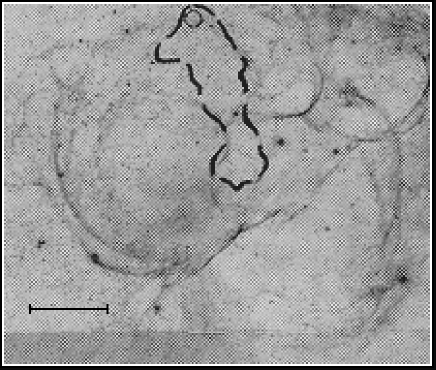
interesting fact is that most of radio filaments of the radio source Vela X are lying within the region bounded by two circular filaments (the outlines of the ”blisters”) and showing a fairly good correlation with optical ones (Gvaramadze 1998a ). These facts suggest that the filamentary structures visible throughout the Vela SNR in radio, optical and X-ray ranges have a common nature, and that their origin is connected with the deformations of the shell.
It is generally accepted that the origin of optical filaments is connected with the interaction between adiabatic (Sedov-Taylor) SN shocks and interstellar clouds (Bychkov & Pikel’ner (1975); McKee & Cowie (1975); De Noyer (1975)), or with projection effects in radiative shocks, whose fronts are rippled due to the refraction and reflection by density inhomogeneities in the ambient medium (Pikel’ner (1954); Sofue (1978)). The last mechanism is applicable only to old SNRs, as it cannot explain the nearly same optical and X-ray sizes of many remnants. The first one though can explain the correlation of optical and X-ray emission but fails to explain the diversity of sheetlike filaments typical for middle-aged remnants (e.g. the Cygnus Loop). Instead of this we suggest that the origin of filaments is connected with projection effects in the Rayleigh-Taylor unstable shell (the former wind-driven shell). The shell deformations viewed at different angles appear (at radio, optical and soft X-ray ranges) as arclike and looplike filaments when our line of sight is tangential to their surfaces. In our model, the optical emission is expected to come from the outer layers of the shell, where the transmitted SN shock slows to become radiative, while the soft X-ray emission represents the inner layers of the shell heated by the SN shock up to X-ray temperatures (cf. Shull et al. (1985)). This explains why the optical emission outlines so tightly the contours of the soft X-ray emission, as well as the general correlation of optical filaments and soft X-ray structures. However, it should not be one-to-one correspondence of optical and X-ray filaments. For example, it is quite possible that the less massive portions of the SNR’s shell were completely overtaken by the transmitted SN shock, and therefore are too hot to emit in the optical range. Apparently this is the reason why we do not see an optical counterpart to the long, faint arc of soft X-rays found by Seward (1990) in the west (less massive) half of the Vela SNR. It is clear that the thickness of adiabatic parts of the SNR’s shell should be of the same order of magnitude as that of the former wind-driven shell. The thickness of the arc is about 2 pc (Aschenbach (1993)), i.e. close to our estimation of the thickness of the wind-driven shell, pc.
4.3 Emission measure
Let us discuss the emission measure of a thermal gas in SNRs. For normal cosmic abundances it is
| (7) |
where is the electron number density, is a line of sight thickness of the region occupied by the emitting gas. It is usually assumed that is constant, and, in the case of a shocked gas, is equal to the immediate postshock density; e.g. for adiabatic shocks and for a specific heat ratio . The thickness of the postshock emitting region is , where is the radius of the shock. Substituting in the last relation, one has for spherical shock waves that . This estimation implies that the X-ray appearance of Sedov-Taylor remnants should be limb-brightened.
If the gas behind the shock is in the thermal pressure equilibrium, then
where is the immediate postshock temperature. This relation helps to explain the general softening of the X-ray emission of the Vela SNR towards the Galactic plane (i.e. towards the region of enhanced density), as well as the anticorrelation of small-scale spectral and intensity variations of the soft X-ray emission (KGHS ). Besides that, the observable variations of the brightness in regions with the same spectral characteristics might be explained by changes of (see (7)). Guided by these arguments, KGHS proposed that the X-ray appearance (in the 0.2-2 keV band) of the Vela SNR is connected with the SN shock expansion in a clumpy medium, and concluded that the progenitor star’s ionizing radiation was too weak to homogenize the surrounding medium (see McKee et al. (1984)). Another conclusion made by KGHS is that the hard X-ray emission from the region to the south of the pulsar is nonthermal. This is a consequence of their assumptions that the emitting gas is in the thermal pressure equilibrium and that the line of sight extent of the emitting gas is nearly constant and equal to the diameter of the remnant. The analysis of the spectral and intensity variations of the soft X-ray emission of the Vela SNR by Bocchino et al. (1994, 1997) was also based on the Sedov-Taylor SN blast wave model, and they also came to the conclusion that the SN shock propagates through the clumpy medium.
Our model offers an alternative explanation for the spectral and intensity variations; such variations arise in a natural way when our line of sight crosses the deformations of the shell. In particular, the model explains the origin of numerous arcs and loops observed in soft X-rays (Aschenbach (1997)). The model could also explain the general appearance of the remnant in soft X-rays. As mentioned in Sect. 3.2, the soft X-ray emission of the Vela SNR does not show limb-brightening except on the northeast edge. Our explanation is as follows. The shell deformations result in the increase of the effective ”thickness” of the shell. The ”thickening” is however not uniform around the shell. The shell deformations are less pronounced on the northeast edge of the remnant (the more massive, and, correspondingly, the more stable part of the shell), and we see the limb-brightening in this direction. The farther from the Galactic plane, the larger the scale of deformations, and the larger the ”thickness” of the shell. This manifests in two wide regions of soft X-ray emission in the northwest and southeast directions.
It follows from our model that the main volume of the hot interior of the Vela SNR does not significantly contribute to the overall emission of the remnant (see however Sect. 5). Indeed, substituting and pc in (7), one has , i.e. few orders of magnitude smaller than the emission measure estimates derived for the Vela SNR’s shell (KGHS ) and ”jet” (MÖ (97)). Therefore we conclude that the hard X-ray emission might be connected with the innermost layers of the SNR’s shell. We suggest that this emission is thermal and originate in the hot medium evaporated from the shell, and, in particular, from the dense spikes. We also suggest that hard X-ray emission should appear as bright spots in places where spikes penetrate deeply enough in the hot interior of the remnant to be effectively evaporated and heated to high temperatures, and where the line of sight extent of the evaporated gas exceeds that of the gas evaporated from the adjacent parts of the SNR’s shell. Some regular structures of relatively hard X-ray emission could arise in regions of collective interaction of deformations. The length and radial extent of these structures should be of the same order of magnitude as the scale of deformations, whereas the width is about the same as the thickness of the shell. It should be mentioned however that hard X-ray structures should be less regular than soft X-ray structures since the regions occupied by the hot evaporated gas are wider than spikes from which the gas was evaporated. Note that a large number of spots of hard ( keV) X-ray emission was detected throughout the Vela SNR by WESW . We agree with the anonymous referee that this detection is marginal (only at 3 level or less) and that many of spots may be random fluctuations. But as it follows from the above discussion, the possible existence of these spots is not unexpected in our model. Moreover, our model predicts that spots of hard X-rays should correlate with soft X-ray structures and optical filaments. As we already mentioned in Sect. 2, some structures in the Vela SNR visible at radio, optical and soft X-ray wavelengths show good correspondence with hard X-ray features. This correspondence however should not be exact, taking into account the large radial extent of deformations, and the effect of projection.
It is known that the magnetic field suppresses the transverse heat conduction, therefore the magnetic field accumulated in the shell should decreases the rate of the mass exchange between the shell and the hot interior of the SNR. At the same time, one can expect that the impact of the SN ejecta/shock with the wind-driven shell initiates not only large-scale deformations of the shell, but also small-scale turbulent motions inside the shell itself, especially in its innermost layers, where the shell’s material experiences the strongest acceleration. As follows from (6), the stronger the acceleration, the smaller scale of deformations. Shull (1983) found turbulent motions in the Vela SNR’s shell with speeds up to and the characteristic scale of deformations pc. The turbulent mixing of the shell’s material with the gas in the remnant’s interior leads to the tangling of the magnetic field lines, and to the subsequent dissipation of the field in the inner layers of the shell. This, in its turn, promotes the shell evaporation (see e.g. Cowie & McKee (1977)). The reconnection of the magnetic field lines inside the Rayleigh-Taylor spikes could be responsible for an additional evaporation of the shell’s material.
4.4 The X-ray ”jet” as a dense filament in the shell
Proceeding from the aforementioned, we suggest that the Vela X-ray ”jet” is a dense filament in the Vela SNR’ shell. There are two main arguments in support of this suggestion. The first one is that the X-ray ”jet” correlates with the optical and radio filaments, which should be the parts of the shell. The second one is that the spectra of the ”jet” and its surroundings (the SNR’s shell) are ”virtually identical” (MÖ (97)). The Vela ”jet” is less than twice brighter than the ”background” shell. One can see from (7) that this enhanced brightness could easily be explained by a small increase of , or by an even smaller increase of the local density. The question arises however why we do not see many ”jets”, even not projected on the pulsar? The possible answer is that there is no suitable conditions to see them. The ”jets” should appear in areas which we observe nearly head-on, i.e. in the center of the remnant; they should be well-shaped, i.e. should arise in regions of collective interaction of deformations; and they should be long enough to be interpreted as ”jets”, i.e. the scale of interacting deformations should be sufficiently large. We see only one region on the Vela SNR’s surface which could satisfy all of these requirements, and just this region is connected with the Vela ”jet”. However, we do not exclude a possibility of finding another, less prominent, ”jets” in the region to the west from the pulsar.
Our model does not predict any specific shape of the ”jet”. It could be arbitrary, as its geometry depends only on the freak of chance. We see that the width of the ”jet” is minimum in the place where the small-scale deformation of the shell (see Fig.2 and Fig.3) interacts with the northwest edge of the eastern ”blister”. We also see that the ”jet” has an appendix to the east from the pulsar. This appendix has the ”right” curvature, taking into account the position of the pulsar on the edge of the eastern ”blister”. From the analysis of the distribution of radio filaments over the surface of the radio source Vela X we came to the conclusion (Gvaramadze 1998a ) that the regular magnetic field in the Vela SNR’s shell, if it exists, should cross the shell along the southeast-northwest axis (i.e. parallel to the Galactic plane). The magnetic field introduces an asymmetry in the mass distribution along the periphery of domelike deformations (since the matter slides preferentially along the field lines), and therefore we could expect some density enhancement on the northwest and southeast outskirts of the ”blisters”. The Vela ”jet” lies just on the northwest edge of the eastern ”blister”, where in addition to the possible magnetic effect, the collective interaction of deformations favours its appearance.
MÖ97 showed that the X-ray spectrum of the ”head” of the ”jet” can be explained by the thermal emission of two-component plasma, with a low-temperature component of temperature keV and pc, and a high-temperature component of temperature keV and pc. They also mentioned that these values are indistinguishable, within the errors, from the parameters characterizing the emission of the ”background” portion of the SNR located more than from the ”jet”. Let us adopt these parameters. Then, assuming that the line of sight thickness of the ”jet” varies from 2 to 9 pc (i.e. it is of the same order of magnitude as the scale of deformations), one can see that the number density of the emitting plasma should be in the range . Though these estimates are quite reasonable, they give only a rough idea about the real parameters of the emitting region, since two of three free parameters for the fitting of the spectrum (namely, the emission measure and the temperature) could suffer significant changes along our line of sight. An additional (third) thermal component introduced by MÖ (97) to describe the predominance of the ”background” shell emission at energies below 0.7 keV confirms the intricacy of the problem. Though the fitting of the spectrum is beyond the scope of our paper, we suggest that the spectrum of the ”jet” should be described by a multi-component thermal model rather than by a mixed thermal–non-thermal model (MÖ97).
5 Discussions
Let us briefly discuss some issues related to our model of the Vela SNR.
It is worthwhile to note that our model offers a natural explanation for the ”unusual” velocity field inherent to the Vela remnant’s shell. The absorption data by Jenkins et al. (1984) revealed that the line of sight component of the gas velocity does not gradually decrease towards the edges of the remnant (as it should be according to the standard Sedov-Taylor model), but rather shows a chaotic behaviour (see also Jenkins et al. (1976), Danks & Sembach (1995)). Jenkins et al. (1984) suggested that some processes should exist which induce transverse motions in the shell. The existence of laterally expanding deformations of the remnant’s shell provides such a process (cf. Meaburn et al. (1988)).
Another issue which has some connection to our model of the Vela SNR as well as to the problem of the X-ray ”jet” is the origin of the hard X-ray nebula found by WESW . As mentioned in Sect. 3.2, WESW suggested that this nebula is powered by the Vela pulsar, i.e. it is a plerion. Their suggestion was based on the partial overlapping of the nebula with the radio source Vela X, and on the spectrum of the nebula, which was fitted by a power-law model (though it was stressed that the data do not allow to discern the thermal and nonthermal forms of the spectrum). WESW estimated the 4-25 keV flux from the nebula to be , that at a distance of 500 pc corresponds to a luminosity of . What we propose is that the nebula is a dense material lost by the SN progenitor star during the red supergiant stage, and reheated to the observed temperatures after the SN exploded. Let us assume that this material is homogeneously dispersed over the whole volume of the nebula, and shocked to the temperature 10 keV. Then assuming that the nebula is an oblate spheroid (see Fig. 1 of WESW ) with the minor and major semi-axis equal to, respectively, pc) and pc), one has that the number density of the nebula should be to give the observed flux. This density corresponds to the mass of the emitting gas of , that is a resonable value, taking into account that the mass lost by the progenitor star during the red supergiant stage is about (see Sect. 3.3).
In Sect. 3.2 we noted that Aschenbach et al. (1995) proposed that the Vela SNR is immersed in a large circular area of X-ray emitting gas. It was suggested that this area of about radius is the hot interior of the Gum Nebula (which is thought to be an old SNR) and that the Vela SNR is located inside it. But this proposal contradicts to the existence of the optical shell of the Vela SNR and therefore we believe that the Vela SNR is rather projected on the ares of hot gas (or vice versa), than is physically associated with it.
In conclusion we stress that the scenario presented in this paper for the formation of shell deformations (i.e. filaments) is valid even if the wind-driven shell does not exist at the moment of the SN explosion. In this case, the SN shock wave hits the wall which bounds a cavity created by the stellar wind. The density jump at the wall results in the abrupt deceleration of the SN shock with the subsequent transition to the radiative stage of the shock evolution (provided that the column density of the swept-up interstellar matter is higher than , where is the velocity of the transmitted shock in units of 100 km/s (McKee & Hollenbach (1980))) accompanied by the formation of a thin, rippled shell.
6 Summary
We have suggested that the Vela X-ray ”jet” arises along the interface of domelike deformations of the shell of the Vela supernova remnant; thereby the ”jet” has been interpreted as part of the general remnant’s shell. Our suggestion was based on the comparative analysis of available images of the remnant, and particularly on the general correlation of filamentary structures visible throughout the Vela supernova remnant in radio, optical, and X-ray ranges. We have proposed that the origin of filaments is connected with projection effects in the Rayleigh-Taylor unstable shell; the instability results from the impact of the supernova ejecta/shock with the pre-existing wind-driven shell created by the supernova progenitor star. The shell deformations appear as arclike and looplike filaments when our line of sight is tangential to their surfaces. The optical emission is expected to come from the outer layers of the shell, where the transmitted supernova shock slows to become radiative, while the soft X-ray emission represents the inner layers of the shell heated by the supernova shock up to X-ray temperatures. The hard X-ray component is attributed to the evaporately enhanced medium in the hot interior of the remnant close to the shell. The nonlinear evolution of the Rayleigh-Taylor instability results in the formation of dense spikes, whose deep penetration in the hot interior of the remnant could lead to the origin of bright spots of hard X-rays. We have examined the general appearance of the Vela supernova remnant, and particular attention has been paid to the soft X-ray structure of the remnant. A possible origin of the nebula of hard X-ray emission around the Vela pulsar was also discussed. It has been suggested that the nebula is a dense material lost by the supernova progenitor star during the red supergiant stage, and reheated after the supernova exploded.
Acknowledgements.
I am grateful to I.Appenzeller and M.Camenzind for their hospitality during my stay at the Heidelberg Observatory, where this work was partially carried out. I am also grateful to B.Aschenbach, N.Bochkarev, M.Gilfanov and J.Trümper for useful discussions, to R.Wijers (the referee) for the interesting correspondence, and to A.D’Ercole for important advices and hospitality during my visit to the University of Bologna. My thanks also goes to the anonymous referees, whose suggestions appreciably changed the paper, to J.Grassberger for assistance in preparing the figures, and to D.Grilli for carefully reading the manuscript. This work was partially supported by the Deutsche Forschungsgemeinshaft (DFG) and the Russian Foundation for Basic Research (grants: 96-02-00071 and 97-02-16486).References
- Aschenbach (1993) Aschenbach B., 1993, Adv. Space Res., 13, (12)45
- Aschenbach (1997) Aschenbach B., 1997, in: X-Ray Imaging and Spectroscopy of Cosmic Hot Plasmas, eds. F.Makino, K.Mitsuda, Univ. Acad. Press, Tokyo, p. 333
- Aschenbach (1998) Aschenbach B., 1998, Nat, 396, 141
- Aschenbach et al. (1995) Aschenbach B., Egger R., Trümper J., 1995, Nat, 373, 587
- Avedisova (1972) Avedisova V.S., 1972, SvA, 15, 708
- Blake (1972) Blake G.M., 1972, MNRAS, 156, 67
- Bocchino et al. (1994, 1997) Bocchino F., Maggio A., Sciortino S., 1994, ApJ, 437, 209
- (8) Bocchino F., Maggio A., Sciortino S., 1997, ApJ, 481, 872
- Bock & Gvaramadze (1999) Bock D.C.-J., Gvaramadze V.V., 1999 (in preparation)
- Bock et al. (1998) Bock D.C.-J., Turtle A.J., Green A.J., 1998, AJ, 116, 1886
- Bychkov & Pikel’ner (1975) Bychkov K.V., Pikel’ner S.B., 1975, SvA Lett., 1, 14
- Cappa and Benaglia (1998) Cappa C.E., Benaglia P., 1998, AJ, 116, 1906
- Chevalier & Liang (1989) Chevalier R.A., Liang E.P., 1989, ApJ, 344, 332
- Cowie & McKee (1977) Cowie L.L., McKee C.F., 1977, ApJ, 211, 135
- Dame et al. (1987) Dame T.M., Ungerechts H., Cohen R.S. et al., 1987, ApJ, 322, 706
- Danks & Sembach (1995) Danks A.C., Sembach K.R., 1995, AJ, 109, 2627
- De Noyer (1975) De Noyer L.K., 1975, ApJ, 196, 479
- D’Ercole (1992) D’Ercole A., 1992, MNRAS, 255, 572
- Dwarakanath (1991) Dwarakanath K.S., 1991, JA&A, 12, 199
- Dubner et al. (1992, 1998) Dubner G., Giacani E., Cappa de Nicolau C., Reynoso E., 1992, A&AS, 96, 505
- (21) Dubner G.M., Green A.J., Goss W.M., Bock D.C.-J., Giacani E., 1998, AJ, 116, 813
- Duncan et al. (1996) Duncan A.R., Stewart R.T., Haynes R.F., Jones K.L., 1996, MNRAS, 280, 252
- Ferrière et al. (1991) Ferrière K.M., Mac Low M.-M., Zweibel E.G., 1991, ApJ, 375, 239
- (24) Frail D.A., Bietenholz M.F., Markwardt C.B., Ögelman H., 1997, ApJ, 475, 224 (FBMÖ)
- Franco et al. (1991) Franco J., Tenorio-Tagle G., Bodenheimer P., Różyczka M., 1991, PASP, 103, 803
- Gorenstein et al. (1974) Gorenstein P., Harnden F.R., Tucker W.H., 1974, ApJ, 192, 661
- (27) Gvaramadze V.V., 1998a, Astronomy Letters, 24, 178
- (28) Gvaramadze V.V., 1998b, in: The Local Bubble and Beyond, eds. D.Breitschwerdt, M.Freyberg, J.Trümper, Springer-Verlag, Heidelberg, p. 141
- Harnden et al. (1985) Harnden F.R., Grant P.D., Seward F.D., Kahn S.M., 1985, ApJ, 299, 828
- Jenkins et al. (1976) Jenkins E.B., Silk J., Wallerstein G., 1976, ApJS, 32, 681
- Jenkins et al. (1984) Jenkins E.B., Wallerstein G., Silk J., 1984, ApJ, 278, 649
- Jun et al. (1995) Jun B.-I., Norman M.L., Stone J.M., 1995, ApJ, 453, 332
- (33) Kahn S.M., Gorenstein P., Harnden F.R., Seward F.D., 1985, ApJ, 299, 821 (KGHS)
- Kawai & Tamura (1996) Kawai N., Tamura K., 1996, in: Pulsars: Problems and Progress, eds. S.Johnston, M.A.Walker, M.Bailes, ASP, San Francisco, p. 367
- Lipunov (1992) Lipunov V.M., 1992, Astrophysics of Neutron Stars, Springer-Verlag, Berlin
- Lyne et al. (1996) Lyne A.G., Pritchard R.S., Graham-Smith F., Camilo F., 1996, Nat, 381, 497
- Markwardt & Ögelman (1995) Markwardt C.B., Ögelman H., 1995, Nat, 375, 40
- MÖ (97) Markwardt C.B., Ögelman H., 1997, ApJ, 480, L13 (MÖ97)
- McKee & Cowie (1975) McKee C.F., Cowie L.L., 1975, ApJ, 195, 715
- McKee & Cowie (1977) McKee C.F., Cowie L.L., 1977, ApJ, 215, 213
- McKee & Hollenbach (1980) McKee C.F., Hollenbach D.J., 1980, ARA&A, 18, 219
- McKee et al. (1984) McKee C.F., Van Buren D., Lazareff R., 1984, ApJ, 278, L115
- Meaburn et al. (1988) Meaburn J., Hartquist T.W., Dyson J.E., 1988, MNRAS, 230, 243
- Miller (1973) Miller E.W., 1973, PASP, 85, 764
- Miller & Muzzio (1975) Miller E.W., Muzzio J.C., 1975, Sky Telesc., 49, 94
- Milne (1968) Milne D.K., 1968, Aust. J. Phys., 21, 201
- Milne (1980) Milne D.K., 1980, A&A, 81, 293
- Milne (1995) Milne D.K., 1995, MNRAS, 277, 1435
- Milne & Manchester (1986) Milne D.K., Manchester R.N., 1986, A&A, 167, 117
- Osterbrock (1989) Osterbrock D.E., 1989, Astrophysics of Gaseous Nebulae and Active Galactic Nuclei, Univ. Science Books, Mill Valley
- Ott (1972) Ott E., 1972, Phys. Rev. Lett., 29, 1429
- Parker et al. (1979) Parker R.A.R., Gull T.R., Kirschner R.P., 1979, An Emission-Line Survey of the Milky Way, NASA SP-434, Washington
- Pikel’ner (1954) Pikel’ner S.B., 1954, Izv. Krym. Astrofiz. Obs., 12, 93
- Reynolds (1976) Reynolds R.J., 1976, ApJ, 206, 679
- Rishbeth (1958) Rishbeth H., 1958, Aust. J.Phys., 11, 550
- Salasnich et al. (1999) Salasnich B., Bressan A., Chiosi C., 1999, A&A, 342, 131
- Seward et al. (1971) Seward F.D., Burginyon G.A., Grader R.J., Hill R.W., Palmieri T.M., Stoering J.P., 1971, ApJ, 169, 515
- Seward (1990) Seward F.D., 1990, in: Imaging X-Ray Astronomy, ed. M.Elvis, Cambridge Univ. Press, p. 241
- Sharp (1984) Sharp D.H., 1984, Physica, 12D, 3
- Shull (1983) Shull P., 1983, ApJ, 269, 218
- Shull et al. (1985) Shull P., Dyson J.E., Kahn F.D., West K.A., 1985, MNRAS, 212, 799
- Sofue (1978) Sofue Y., 1978, A&A, 67, 409
- Strom et al. (1995) Strom R., Johnston H.M., Verbunt F., Aschenbach B., 1995, Nat, 373, 590
- Tenorio-Tagle et al. (1991) Tenorio-Tagle G., Różyczka M., Franco J., Bodenheimer P., 1991, MNRAS, 251, 318
- Vanbeveren et al. (1998) Vanbeveren D., De Loore C., Van Rensbergen W., 1998, A&AR, 9, 63
- Verdon et al. (1982) Verdon C.P., McCrory R.L., Morse R.L., Baker G.R., Meiron D.I., Orszag S.A., 1982, Phys. Fluids, 25, 1653
- Wallerstein & Silk (1971) Wallerstein G., Silk J., 1971, ApJ, 170, 289
- Weaver et al. (1977) Weaver R., McCray R., Castor J., Shapiro P., Moore R., 1977, ApJ, 218, 377
- Weiler & Panagia (1980) Weiler K.W., Panagia N., 1980, A&A, 90, 269
- Weiler & Sramek (1988) Weiler K.W., Sramek R.A., 1988, ARA&A, 26, 295
- Wijers & Sigurdsson (1997) Wijers R.A.M.J., Sigurdsson S., 1997, MNRAS, 290, 276
- (72) Willmore A.P., Eyles C.J., Skinner G.K., Watt M.P., 1992, MNRAS, 254, 139 (WESW)
- Wilson & Bolton (1960) Wilson R.W., Bolton J.G., 1960, PASP, 72, 331