Tracing the vertical composition of disc galaxies through colour gradients††thanks: Based on observations obtained at the European Southern Observatory, La Silla, Chile
Abstract
Optical observations of a statistically complete sample of edge-on
disc-dominated galaxies are used to study the intrinsic vertical colour
gradients in the galactic discs, in order to constrain the effects of
population gradients, residual dust extinction and gradients in the
galaxies’ metal abundance. For the majority of our sample galaxies, the
colours and colour gradients in the range
most likely reflect the intrinsic galactic properties (where is
the vertical scale height).
It appears that the intrinsic vertical colour gradients are either
non-existent, or small and relatively constant as a function of position
along the galaxies’ major axes. On average, the earlier-type galaxies
exhibit smaller vertical gradients than the later types; our
results are consistent with the absence of any vertical colour gradient
in the discs of the early-type sample galaxies. In most galaxies
small-scale variations in the magnitude and even the direction of the
vertical gradient are observed: at larger galactocentric distances they
generally display redder colours with increasing z height, whereas
the opposite is often observed in and near the galactic centres.
For a significant fraction of our sample galaxies another mechanism in
addition to the effects of stellar population gradients is required to
explain the magnitude of the observed gradients. The non-zero colour
gradients in a significant fraction of our sample galaxies are likely
(at least) partially due to residual dust extinction at these z
heights, as is also evidenced from the sometimes significant differences
between the vertical colour gradients measured on either side of the
galactic planes.
We suggest that initial vertical metallicity gradients, if any, have
likely not been accentuated by accretion or merging events over the
lifetimes of our sample galaxies. On the other hand, they may have
weakened any existing vertical metallicity gradients, although they also
may have left the existing correlations unchanged.
keywords:
galaxies: abundances – galaxies: fundamental parameters – galaxies: photometry – galaxies: spiral – galaxies: statistics1 Vertical colour and metallicity gradients
The study of metal abundances in the disks of external spiral galaxies has traditionally been performed using colours and colour gradients. Although, in theory, the use of line strengths allows to determine stellar population parameters more accurately, the spatial and spectral resolution required for this purpose are so large that thusfar such a study has not been attempted.
In contrast to the large number of studies of radial colour gradients in moderately inclined and face-on spiral galaxies (e.g., de Jong 1996, and references therein), the vertical colour behaviour of highly inclined and edge-on galaxies has not received much attention. In highly inclined galaxies, the interpretation of intrinsic colours and colour gradients is severely hampered by the presence of dust in the galactic planes, which causes the dust lane to appear as a red feature in vertical colour profiles (e.g., Hamabe et al. 1979, 1980; van der Kruit & Searle 1982a,b; Sasaki 1987; Wainscoat, Freeman & Hyland 1989; Aoki et al. 1991; Jansen et al. 1994; de Grijs, Peletier & van der Kruit 1997).
In those galaxies, in which the dust lane is spatially resolved, the presence of Hii regions and a young, blue population of massive O and B stars very close to the galactic plane, the “young disc”, can be inferred from the vertical colour profiles. As was noted by, e.g., van der Kruit & Searle (1982b) for NGC 5907 and Wainscoat et al. (1989) for the southern edge-on galaxy IC 2531, the relative prominence of the young disc in the bluer passbands, where reddening plays an increasingly important role, means that it is very blue compared to the dominant (“thin”) disc component. The blue stars of which the light is observed must therefore be located at sufficiently large radii, in order to compensate for dust absorption. The young stellar population in our Galaxy also resides in a very thin young disc with a much smaller scale height than that of the old-disc stars (e.g., Bahcall & Soneira 1980).
1.1 Probing the composition of the Galaxy
Because of our unique position within the Galaxy, studies of the Galactic disc obviously provide the most detailed information about the vertical composition of spiral galaxy discs. On the other hand, our location in the Galaxy also prevents us from probing its stellar populations out to large distances along the Galactic plane, due to the presence of interstellar extinction in the plane. Studies of the Galactic abundance distribution based on statistically complete samples of tracer stars are therefore predominantly confined to lines of sight (close to) perpendicular to the Galactic plane.
For studies of the composition of the integrated stellar population in the Galactic disc, the choice of a sample of representative tracer stars is very important. Ideally, one would like to select samples of long-lived (i.e., of the order of the lifetime of the Galaxy), but unevolved (main-sequence) stars that are easily observable. Although intrinsically bright tracer candidates are desirable in terms of observing time, they suffer from a number of characteristics that make them less suitable (see Gilmore, Wyse & Jones 1995 for a discussion).
K-type giants have been used extensively, but one must first identify K giants from among the significantly larger number of K dwarfs with similar apparent magnitudes and colours. Therefore, F and early G-type dwarfs are generally considered as the most desirable probes, because they are the brightest of the unevolved stars that were formed during or shortly after the formation epoch of the Galaxy. Since their atmospheres are well-mixed and they are ubiquitous throughout the Galaxy, their chemical abundances provide us with a fossil record of the integrated star formation and chemical enrichment history during the early stages of the formation of the Galaxy. Moreover, when using these stars as tracers of the Galactic chemical enrichment history, one does not need to apply model-dependent corrections for dead stars (cf. van den Berg 1962; Schmidt 1963; Tinsley 1980).
1.2 Metallicity gradients in the Galactic disc
Although a large number of studies have focused on the presence and size of a vertical metallicity gradient in the Galactic disc (e.g., Hartkopf & Yoss 1982; Grenon 1987; Yoshii, Ishida & Stobie 1987; Yoss, Neese & Hartkopf 1987; Norris & Green 1989; Majewski 1992; Reid & Majewski 1993; Jønch-Sørensen & Knude 1994; Jønch-Sørensen 1995; Trefzger, Pel & Gabi 1995; Robin et al. 1996; Buser, Rong & Karaali 1998), the values for the actual decrease of mean metal abundance of the old thin disc component with increasing distance from the Galactic plane vary significantly. This apparent disagreement is partly due to the different sample selection criteria used to trace the abundance gradient, as well as to differences in the definitions of the Galactic disc components used by various authors.
In particular, the observed metallicity gradients may be affected by the admixture of the different disc components if the sample stars used to trace these gradients are not easily separable for each of these components. Both Yoss et al. (1987) and Majewski (1992) show that the metallicity distributions of their sample F and G dwarfs at different z-heights above the Galactic plane are non-Gaussian, implying a mixture of stellar populations at all heights above the plane. Yoss et al. (1987) argue that the thin young and the thin old disc are essentially equally dominant for pc; the thin old disc is most evident for pc, whereas the thick disc starts to show up for pc and dominates for pc, above which the main contribution is that of the Galactic halo.
Close examination of the available metal abundance data reveals that the metallicity gradient is steeper within 800-1000 pc of the Galactic plane than for kpc (e.g., Hartkopf & Yoss 1982; Yoss et al. 1987; Jønch-Sørensen 1995; Trefzger et al. 1995), which corresponds to a change in the relative dominance of the old thin and the thick disc components.
The mean abundance gradient for kpc is of order dex kpc-1 (Hartkopf & Yoss 1982; Yoshii et al. 1987; Yoss et al. 1987; Norris & Green 1989; Buser & Rong 1995; Jønch-Sørensen 1995; Trefzger et al. 1995). On the other hand, Majewski (1992) and Jønch-Sørensen (1995) argue that their data are consistent with no metallicity gradient at all in the thick-disc region, while the non-Gaussian nature of the abundance distribution as a function of z-height may cause the detection of an artificial gradient. However, Trefzger et al. (1995) caution that the decreasing completeness of the absolutely faintest stars in the tracer samples means that with increasing distances one tends to lose preferentially the metal-poor stars, which, in turn, causes the observed metallicity gradients to flatten. The good agreement between their and other studies leads them to believe that this effect is insignificant, though.
Most direct studies of the abundance gradient are restricted to stars in the old thin disc, which is also the main disc component that we observe in other galaxies. Modern estimates of the mean metallicity gradient in the pc closest to the Galactic plane (Hartkopf & Yoss 1982; Yoshii et al. 1987; Yoss et al. 1987; Jønch-Sørensen & Knude 1994; Buser & Rong 1995; Trefzger et al. 1995; see also Robin et al. 1996; Buser et al. 1998) are in the range dex kpc-1. All of these results have been obtained from in situ samples, along sight lines closely perpendicular to the Galactic plane and centered on the position of the Sun, thereby ignoring possible radial metallicity gradients. Jønch-Sørensen (1995) observed F and early G-type (main sequence) stars in six selected directions of the Galaxy and tried to solve for radial and vertical gradients simultaneously. His best results for pc are dex kpc-1 and dex kpc-1 for the vertical and radial gradients, respectively. This may indicate that the effects of such a small radial metallicity gradient on the expected vertical abundance gradients are small or negligible, in particular if the origin of either gradient is different.
1.3 External galaxies: what do we know?
Colour distributions and colour gradients are sensitive to the metal abundances and their gradients of the integrated stellar populations in galaxies.
Although radial colour gradients in moderately inclined and face-on galaxies have been studied extensively, in general indicating bluer colours with increasing galactocentric distance (e.g., de Jong 1996, and references therein), only for a few relatively large and well-resolved edge-on galaxies vertical colour gradients have been measured.
In highly inclined galaxies, the interpretation of intrinsic colours and colour gradients is severely hampered by the presence of dust in the galactic planes. However, from a comparison with published colours of moderately inclined Sc galaxies, Kuchinski & Terndrup (1996) have shown that for these late-type galaxies there is little or no reddening away from the dust lane. Since statistical studies have shown that the dust content of Sc galaxies is large compared to other disc-dominated galaxy types (e.g., de Grijs et al. 1997), we may assume that the effects of reddening on the intrinsic galaxy colours away from the dust lane are largest for these galaxy types. Thus, colours and colour gradients measured at those distances from the galactic planes where the influence of the dust lane is negligible likely reflect the intrinsic galactic properties. Detailed studies of the intrinsic colours of galactic discs perpendicular to their planes (e.g., Hamabe et al. 1979; Hegyi & Gerber 1979; van der Kruit & Searle 1981; Jensen & Thuan 1982) are consistent with a small or no vertical colour gradient outside the dust lane region (see also de Grijs et al. 1997).
Although colour gradients along the minor axis may be due to some intrinsic bulge property111However, Peletier & Balcells (1996, 1997) showed, for their sample of 30 field spiral and lenticular galaxies, that the bulge colours on the minor axis and the inner disc colours taken in wedge apertures at 15∘ from the major axis at 2 K-band scale lengths are very similar., van der Kruit & Searle (1981) observed that, at various galactocentric distances, the vertical colours of NGC 891 are getting systematically bluer with greater height above the plane. On the other hand, Jensen & Thuan (1982) did not find any evidence for a similar vertical colour gradient in NGC 4565 in the region where the old thin disc dominates. However, as soon as the light of the thick disc starts to dominate a small perpendicular colour gradient is present in their data, in the sense that the disc colours become redder with increasing distance from the galactic plane. A similar result has recently been obtained for NGC 5907 (Lequeux et al. 1996, 1998; Rudy et al. 1997), which was interpreted as an extended stellar halo redder than the galactic disc or a very thick disc component.
The conversion of broad-band colour gradients to abundance and population gradients in external galaxies is controversial, unfortunately. For the detailed analysis of the luminosity and colour profiles of edge-on galaxies one needs to adopt a priori assumptions concerning the evolutionary stellar population synthesis, the initial mass function, the metallicity and the star formation history, as well as about the dust geometry and its characteristics. Due to the relative insensitivity of broad-band colours to these characteristics, in particular because of the age/metallicity degeneracy in the colours of an integrated stellar population (Worthey 1994), spectral line studies seem to be a more effective tool to disentangle metallicity and age effects, as well as population gradients.
However, spectral line strength indices are relatively hard to measure, and are also degenerate to age and metallicity, although to a lesser extent than broad-band colours. Since local colours correlate strongly with each other (de Jong 1996, Peletier & Balcells 1996, 1997) they can be used as indicators of the gross properties of galaxies, in the absence of dust, where the various wavelength ranges can be used as diagnostics for different overall galaxy properties. In this respect, de Jong’s (1996) statistical study is one of the first large surveys of spiral galaxy properties based on multiple passband optical and near-infrared observations.
Fisher, Franx & Illingworth (1996) published one of the very few studies dealing with abundance gradients perpendicular to the galactic planes in highly-inclined galaxies other than our own. Based on Mg2 spectral line observations of 20 S0 galaxies, they conclude that the minor axis behaviour of the 9 galaxies in their edge-on subsample is noticeably different from that found along the major axis. Whereas the major axis Mg2 profiles decrease with radius and flatten as the bulge light contribution decreases and the disc starts to dominate, the minor axis gradients display a uniformly decreasing Mg2 strength with distance from the galactic plane, reaching lower values than those of the major axis metallicities.
2 Approach
2.1 Sample selection, observations, and reduction techniques
The selection of our statistically complete sample of edge-on disc-dominated galaxies, and the (optical) observations and data reduction techniques on which the results presented in this paper are based were described in detail in de Grijs (1997, 1998) and de Grijs & Peletier (1999). Here, we summarize the selection criteria that were applied to the galaxies in the Surface Photometry Catalogue of the ESO-Uppsala Galaxies (ESO-LV; Lauberts & Valentijn 1989):
-
1.
Inclination selection: ;
-
2.
Diameter selection: (: blue angular size at a surface brightness mag arcsec-2);
-
3.
Galaxy type selection: S0 – Sd, and
-
4.
Morphology selection: non-interacting and undisturbed galaxies.
The ESO-LV is statistically complete for diameter-limited samples with (de Grijs 1997), based on completeness tests (e.g., Davies 1990; de Jong & van der Kruit 1994). Our observed subsample is characterized by (for ), which implies statistical completeness for the criteria outlined above.
In de Grijs (1997, 1998), we compared our photometry to that of de Vaucouleurs et al. (1991; RC3), Mathewson, Ford & Buchhorn (1992) and Mathewson & Ford (1996), and Barteldrees & Dettmar (1994). From the detailed comparison of our photometry to theirs, using both luminosity profiles and total magnitudes, it was shown that we can accurately reproduce their results (e.g., for the comparison of total magnitudes we find , and ).
2.2 The determination of vertical colour gradients
The determination of colours and colour gradients in our sample galaxies requires a careful matching of the individual observations taken through different filters, or with different telescope/instrument combinations on different nights.
First, if our multi-passband observations of a single galaxy were obtained with different telescope/instrument combinations, we rebinned the images to a common reference frame (under conservation of the observed flux), such that the highest-quality observations (generally those taken with the Danish 1.54m telescope), or the largest number of observations that were taken with the same telescope/instrument combination, remained unaffected.
The rebinning and the alignment of the individual images were performed using the standard IRAF222The Image Reduction and Analysis Facility (IRAF) is distributed by the National Optical Astronomy Observatories, which is operated by the Association of Universities for Research in Astronomy, Inc., under cooperative agreement with the National Science Foundation. tasks magnify, rotate, and imalign. We determined the rotation angles and alignment offsets using common (foreground) stars in the individual frames. Only in those rare cases where foreground stars were completely lacking the galactic centres were used for the alignment.
In order not to be hindered by contamination of the galaxy luminosity by foreground star light, we used the I-band images to mask out those areas contaminated by foreground stars. We used the mask thus obtained to correct for foreground star contamination in all passbands.
Secondly, we extracted vertical luminosity profiles at a number of positions along the major axes of the sample galaxies. A semi-logarithmic binning algorithm was applied to the galaxies, both radially and vertically, to retain an approximately constant overall signal-to-noise (S/N) ratio in the resulting vertical profiles. This binning algorithm was applied to all individual passbands of a given galaxy with exactly identical parameters, to facilitate the subsequent construction of the vertical colour profiles.
We rejected those profiles with poor S/N ratios (generally the outermost profiles) and those that were clearly affected by artifacts in the data or foreground stars. For all galaxies we were able to sample the vertical luminosity distribution at various positions along the major axis outside the region where the bulge contribution dominates. For galaxies of types we could determine the luminosity profiles for at least 4 of these independent positions in each passband.
The photometric calibration of the luminosity profiles was done using the calibration parameters obtained in de Grijs (1997, 1998).
Finally, we combined the calibrated vertical luminosity profiles obtained in the individual passbands into our final, calibrated colour profiles, in , , and . Due to the low S/N ratios and the snapshot nature (and the resulting shallow profiles) of our near-infrared -band observations (de Grijs 1997; de Grijs & Peletier 1999), we will not discuss any optical/near-infrared colour gradients.
The positions of the galactic centres and the galactic planes were determined by folding the profiles and under the assumption of symmetrical light distributions with respect to the planes.
Colour gradients in all our vertical colour profiles were obtained by fitting straight lines to the data points within user-specified vertical ranges (in units of the galaxy’s scale height), using a reduced least-squares minimization routine. In all our sample galaxies, we determined the presence and magnitude of the possible colour gradients at each sampled position by examining the colour profiles on each side of the galactic planes separately. In the following section, we will discuss the effects of choosing different vertical fitting ranges, and present the results for our entire sample of edge-on disc galaxies.
3 Statistical trends
3.1 The extent of the dust lane: choosing the vertical fitting range
The correct choice of the vertical fitting range to study the presence of possible colour gradients is important for two reasons:
-
1.
At small distances from the galactic planes, the observed colours are affected by the in-plane interstellar extinction in the galaxies, causing the dust lane to appear as a red feature in vertical colour profiles (Sect. 1.3), superposed on the intrinsically bluer disc population. Thus, choosing a lower fitting limit too close to the galactic planes will artificially increase the measured slope and result in an erroneous interpretation of the colour gradient.
-
2.
Fortunately, however, as already mentioned in Sect. 1.3, Kuchinski & Terndrup (1996) have shown that there is little or no reddening away from the dust lane in their sample of Sc galaxies, which are typically the dustiest galaxy types. Therefore, colours and colour gradients measured at those distances from the galactic planes where the influence of the dust lane is negligible likely reflect the intrinsic galactic properties. However, at large z distances, the S/N ratios of the individual luminosity profiles, from which the colour profiles were constructed, decrease significantly, causing the S/N ratios of the colour profiles to become even poorer.
Obviously, any choice of the vertical fitting range that will give us a good representation of the vertical colour gradient at any one position will therefore include only those data that are mostly unaffected by the dust lane, but of which the S/N ratio is still sufficient (we only used luminosity profiles with S/N in the fitting ranges used to construct the colour profiles).
In de Grijs et al. (1997) we showed that the vertical extent of the dust lane in our sample galaxies is clearly revealed by the minor axis colour profiles presented in that paper. These colour profiles likely indicate the maximum extent of the dust lanes, since its maximum effect is expected in the galactic centres (cf. the colour maps in de Grijs 1997 and de Grijs et al. 1997). From the minor axis colour profiles in de Grijs et al. (1997), we estimate that – for the majority of our sample galaxies – we can use a lower limit (where is the scale height of the dominant old thin disc component), and an upper limit . The determination of the scale heights of our sample galaxies was discussed in detail by de Grijs et al. (1997) and de Grijs (1998). Briefly summarized, we fitted the generalized vertical density laws proposed by van der Kruit (1988) to the vertical luminosity profiles of the sample galaxies for which we had -band observations available; for the other galaxies we used an iterative fitting routine to determine the slope of their vertical I-band luminosity distributions between 1.5 and 4.0 . In both cases, we decided to use our longest-wavelength observations to best approximate the vertical luminosity (and presumably mass) distributions (de Grijs et al. 1997, de Grijs 1998).
By choosing various fitting ranges within these boundaries and by treating both sides of the galactic planes separately we can exclude profiles that are affected by any remaining extinction effects due to the dust lane and by any effects due to poor S/N ratios at high z heights (or large radial distances). In addition, this method will help us to filter out the effects of foreground stars, stellar warps and patchy spiral arms.
3.2 Vertical colour gradients
To obtain estimates of the colour gradients that are least affected by artifacts due to extinction or poor S/N ratios, we applied our colour gradient fitting routine to the sample galaxies using three vertical fitting ranges: and , for all three colours discussed in Sect. 2.2.
Close examination of the results obtained from these three fitting ranges led us to conclude that the total acceptable range, , produced – in general – the most representative vertical colour gradients as a function of projected galactocentric distance: any small-scale variations due to excess out-of-plane extinction, foreground star light or artifacts due to low S/N ratios in the outer regions are smoothed out by this relatively large vertical range, which we will use in the subsequent colour gradient analysis. From the point-to-point variation between adjacent data points, it is clear that the results obtained from both the inner range, , and the outer range, show greater scatter than those of the total range.
Next, we examined the individual colour profiles and their corresponding colour gradients for each of our sample galaxies visually, combined with the original galaxy images, in order to assess the quality of the fits and the usefulness of the profiles for our purposes. The adoption of this quality evaluation procedure enabled us to reject those profiles that were clearly affected by dust (either because of a very prominent dust lane or due to residual dust features), foreground stars, inclined spiral arms, or very low S/N ratios.
As a result, the colour profiles for eight of our sample galaxies (ESO 321-G10, ESO 340-G08, ESO 377-G07, ESO 435-G50, ESO 444-G21, ESO 506-G02, ESO 555-G36, and ESO 575-G61) proved to be too noisy, or dominated by the colours of the sky background at , due to the shallow nature of the individual luminosity profiles used to construct the colour profiles. In addition, for a number of galaxies, we were forced to adjust the vertical fitting range because of various reasons (e.g., significant reddening due to dust extending into the adopted fitting range, a limited number of data points to produce reliable fits, etc.).
In Fig. 1 we show the resulting colour gradients as a function of projected galactocentric distance for our largest colour baseline, , for all of our sample galaxies, and sorted by (revised) Hubble type, T (indicated in the upper left-hand corner of each panel). We have plotted the results obtained from either side of the plane by open squares and filled circles, respectively. The latter represent the side of the galactic plane least affected by extinction, if appropriate. However, one should note that in some cases the dust lane corrugates, in which case the least (most) dusty side refers to the side where the majority of the profiles are least (most) affected by extinction. The fits were done in the range ; for exceptions see the caption of Fig. 1.

Although one can immediately see that the detected vertical colour gradients are small and relatively constant as a function of position along the galaxies’ major axes, in most galaxies small-scale variations in the magnitude, and even the sense of the colour gradients are observed. The differences are in the sense that the outer regions generally display redder colours with increasing z-distance, whereas the opposite behaviour is often observed in and near the galactic centres. In addition, it is also clear that although the results obtained from either side of the galactic planes agree reasonably well, small differences between both sides are appreciated in almost all of our sample galaxies. These are unlikely to be caused by incorrect background subtractions, since we are comparing relative colours within a given galaxy. In all cases, the background emission in the field of view of our programme galaxies could be well represented by a two-dimensional plane, determined by the flux in regions sufficiently far away from the galaxies themselves in order not to be affected by residual galactic light. For the majority of our observations, these planes were closely approximated by constant flux values across the CCD field. The remaining uncertainties in the background contribution are due to poisson noise statistics (see de Grijs [1997] for a detailed overview of the image reduction techniques used).
We will discuss the observed colour behaviour for those sample galaxies for which we have high-quality colour profiles, and those that show significant point-to-point variations, either on one side or compared to the other side of the plane, or significant non-zero gradients.
For the detailed (projected) two-dimensional behaviour of colour as a function of position within our sample galaxies, we refer the reader to the colour maps for 24 of the galaxies in de Grijs et al. (1997) and the colour maps for all galaxies in de Grijs (1997, Chapter 9).
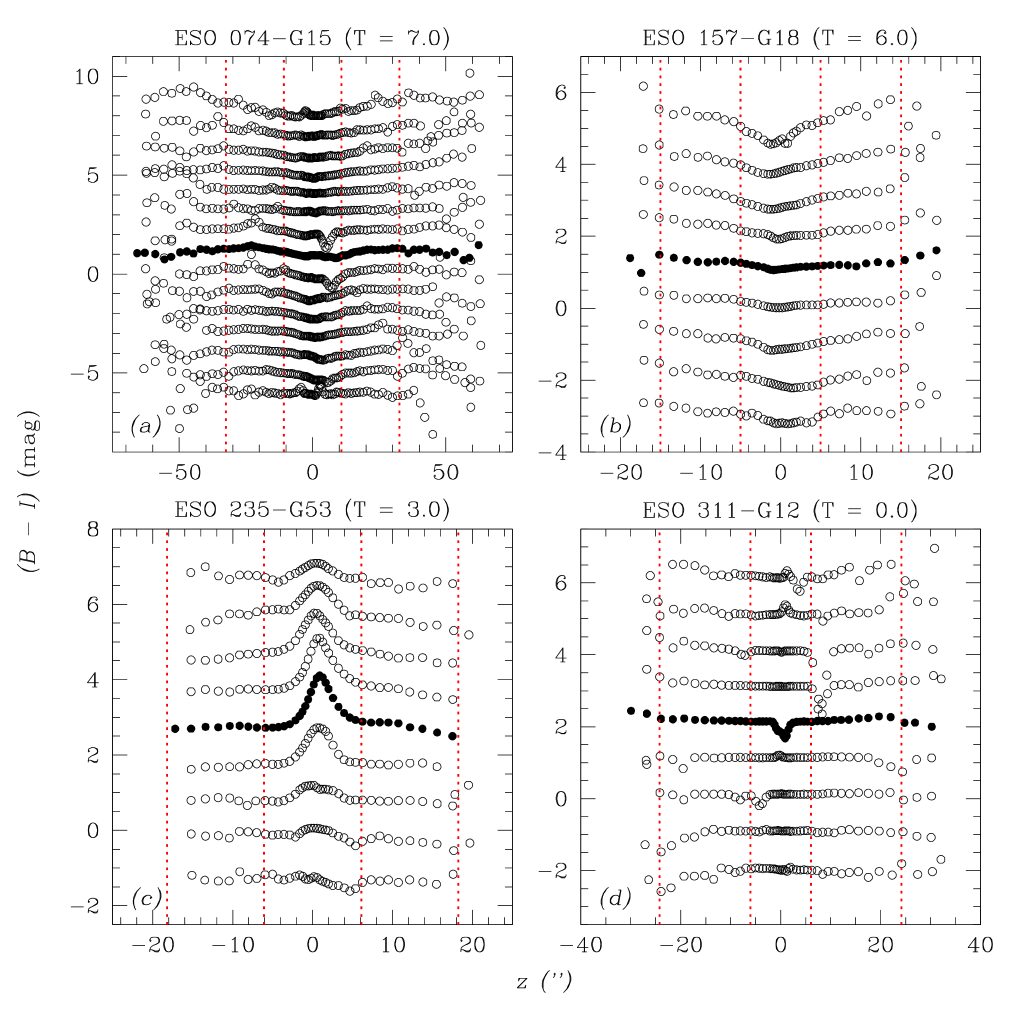
In Fig. 2 a number of the colour profiles, extracted at various positions along the galaxies’ major axes, are shown for a few of the most instructive sample galaxies. The calibrated colours apply to the colour profiles at the galactic centres; offsets in colour, in increments of mag, have been applied to the other profiles for reasons of clarity and display purposes.
-
•
ESO 033-G22 is a very regular, late-type galaxy with a clear dust lane that obscures the galactic centre on one side of the plane. Since it resides in a field with a large number of foreground stars, the erratic behaviour of the vertical colour profiles is likely caused by the superposition of these on the galactic light profiles. (T = 7.0)
-
•
The vertical colour profiles on either side of the plane of ESO 041-G09 show a significant difference, due to a broad dust lane on one side of the galaxy; a number of the colour profiles are significantly affected by foreground stars. (T = 5.7)
-
•
ESO 074-G15 is a very late-type galaxy with irregular dust patches scattered across its disc. It does not display a clear galactic centre, and its disc shows significant, irregular thickening on one side of the galactic centre. Its large projected size lends it very well for a detailed study of its colour behaviour. (Fig. 2a; T = 7.0)
-
•
Due to the relative absence of foreground stars around ESO 141-G27, except for two bright stars that are viewed on top of the galaxy, and because of its almost perfect edge-on orientation, the vertical colour profiles on either side of the plane show a symmetrical behaviour. The colours become redder with increasing distance from the plane; based on its appearance, we cannot rule out that this is due to a small out-of-plane projection of the dust in the spiral arms. (T = 6.0)
-
•
The colour profiles on one side of the plane of ESO 142-G24 are clearly affected by its dust lane; the side that is relatively unaffected by extinction effects does not show any significant or systematic vertical colour gradient. (T = 6.7)
-
•
Despite its regular appearance, ESO 157-G18 is clearly dusty and shows irregularly located regions of high extinction throughout its disc, which may be the cause of the small vertical colour gradient, indicating redder colours with increasing z height. (Fig. 2b; T = 6.0)
-
•
Although ESO 201-G22 shows some evidence for a patchy dust distribution on its dusty side, its colour gradients on the side that is relatively unaffected by extinction also show redder colours with height above the plane. (T = 5.0)
-
•
ESO 202-G35 is one of our least inclined sample galaxies; it clearly shows its projected spiral arms and the dust lanes associated with these. Any measured vertical colour gradients are therefore compromised by extinction, rendering a direct interpretation of its colours troublesome. (T = 3.0)
-
•
The highly warped galaxy ESO 235-G53 shows a clean-cut dust lane that divides the galactic bulge neatly in two (almost) equal parts. Apart from this dust lane, the colour profiles are hardly affected by residual dust extinction, but the warping of its disc requires a careful modeling of its plane. Its “dust-free” colours indicate a blueing of the disc with increasing z height. (Fig. 2c; T = 3.0)
-
•
ESO 240-G11 is a beautiful example of a disc-dominated system that is unfortunately clearly affected by patches of dust across its disc. The side that is relatively little affected by the ubiquitous extinction indicates a small (or even the absence of a) vertical colour gradient. (T = 4.8)
-
•
ESO 263-G15 shows an irregular dust lane that cuts through the middle of the galactic centre, where we observe bluer colours with increasing distance from the plane, which are likely little affected by extinction. At larger galactocentric distances the colour profiles change to indicate redder colours with height, which is almost certainly due to the patchy extinction observed at these radii, as well as the presence of young stars, and thus active star formation, close to the galactic plane. (T = 6.0)
-
•
Much of the scatter and noise in the vertical colour profiles and the derived gradients in ESO 286-G18 is likely due to the low S/N in our B-band image. Colour profiles can be obtained with acceptable accuracy only at radii relatively close to the galactic center; they are consistent with the absence of any vertical colour gradient. (T = 4.0)
-
•
Almost all of the outer-disc colour profiles of ESO 288-G25 that are mostly unaffected by dust indicate redder colours with increasing height above the plane; in these profiles, the effects of dust are virtually non-existent in the z range used for our analysis. (T = 4.0)
-
•
ESO 311-G12 is a very smooth-looking early-type spiral that does not show any significant extinction effects. Although it resides in a region that is relatively heavily populated by foreground stars, its vertical colour profiles are hardly affected by those; they are consistent with no colour gradient at all over the z range from 1.0 to 3.0 . (Fig. 2d; T = 0.0)
-
•
Our low S/N B-band observation of ESO 315-G20, which is further compromised by a very bright foreground star located just outside the main bulge region, is the likely cause for the noisy behaviour of the magnitude of the vertical colour gradient with galactocentric distance. At those radii where the S/N is sufficient to accurately examine the vertical gradient, our results indicate that any such gradient is probably non-existent. (T = 10.0)
-
•
ESO 322-G73 is an early-type galaxy with a small disc-component, which shows a clearly disturbed morphology, that may be due to an interaction with a nearby galaxy in the same group. Apart from the red feature associated with the in-plane dust lane, the dust-free regions in its vertical colour profiles are essentially featureless and consistent with a zero gradient. (T = )
-
•
ESO 358-G26 and ESO 358-G29 are among the earliest galaxy types in our sample, and do not show any evidence for a sizable amount of extinction. The vertical colour profiles are featureless and entirely consistent with no gradient at all. (ESO 358-G26: Fig. 2e, T = ; ESO 358-G29: T = )
-
•
Our observations of ESO 383-G05 show that although the inner part of the galaxy is well-behaved, showing a bright bulge divided by a prominent dust lane, the outer regions are highly irregular. It appears that an out-of-plane spiral arm obscures part of the main stellar disc component, which is undoubtedly the cause for the erratic behaviour of the open symbols in Fig. 1. The other side of the plane appears to be very regular and hardly affected by extinction or warping; the corresponding vertical colour gradients do not show any significant deviation from zero. (T = 3.7)
-
•
ESO 416-G25 is characterized by a very thin disc and a clear dust lane that divides the bulge in two equal parts, leaving patches of dust in the disc at larger galactocentric distances. Its vertical colour gradients seem to indicate redder colours with increasing height above the plane, similarly on either side of the plane. (T = 3.0)
-
•
ESO 435-G25 consistently shows bluer colours with increasing z height, although we cannot determine whether we are observing the intrinsic galaxy colours or the effects of residual dust extinction at progressively higher positions in the disc. The galaxy shows a very prominent dust lane, extending from the galactic centre to the edge of the disc, as well as into the higher stellar layers, as is evidenced by dust features that can be traced up to a few scale heights. (Fig. 2f; T = 5.0)
-
•
Outside the region where its dust lane creates a red feature in its vertical colour profiles, ESO 437-G62 shows essentially unchanging colours with increasing height above the plane. The galaxy image looks very smooth and does not show any evidence for residual extinction effects. (Fig. 2g; T = 3.0)
-
•
The effects of dust in ESO 446-G18 are obvious if one examines the appropriate panel in Fig. 1: the side that is most affected by extinction shows a clear change in the sense of the vertical colour gradient, whereas the colour gradient on the other side remains relatively constant and close to zero at those radii where the effects of residual extinction are negligible. (Fig. 2h; T = 3.0)
-
•
The colours of ESO 460-G31 are significantly affected by extinction over the entire disc-dominated radial range, which make a direct interpretation of the vertical colour gradients unreliable. (T = 4.5)
-
•
ESO 487-G02 shows a behaviour of its colour profiles that is remarkably similar to that shown by ESO 437-G62; its vertical colour profiles are consistent with a zero gradient outside the region dominated by the strong dust lane in the plane. (T = 3.5)
-
•
As one of our earliest-type sample galaxies, ESO 500-G24 does not show any evidence for a significant amount of extinction, nor does it show any noticeable vertical colour gradient at any one position along its major axis. (T = )
-
•
ESO 505-G03 is clearly a disturbed galaxy with a patchy dust content and a thin disc. However, based on its appearance, the reddening of its colours with increasing z height might well be real and not due to extinction effects. (T = 7.0)
-
•
Finally, ESO 509-G19 shows redder colours with increasing distance from the plane. Visual examination of the individual observations lead to the conclusion that this can be attributed to residual dust effects at these z heights. (T = 4.0)
In summary, from the detailed examination of the vertical colour profiles (Figs. 1 and 2) it appears that the vertical profiles, at least those extracted on the side of the galactic plane that is least affected by extinction, are consistent with no gradient at all. Although the individual panels of Fig. 1 are often rather noisy, we can clearly see that in a significant number of cases (%) the non-zero colour gradients on the “dust-free” side of the galactic planes show increasingly red colours with distance from the plane for profiles that were extracted at progressively greater galactocentric distances. This may, in fact, be caused by the presence of young stars at small z heights at these galactocentric distances, where active star formation is ongoing. In this case, we observe increasingly large vertical age gradients at progessively greater galactocentric distances, while the metallicity gradients might remain approximately similar. Only in a few cases we observe a general blueing with z height, for all of the colour profiles of a given galaxy. We will now investigate whether these gradients correlate with global galaxy parameters.
3.3 Correlations with fundamental galaxy parameters
Initial visual examination of the panels in Fig. 1 hints at a possible dependence of the magnitude and scatter in the vertical colour gradients on galaxy type. Therefore, we determined the average vertical colour gradient and its (1) standard deviation for each of our galaxies, based on the results obtained in the previous section. The results of this exercise are presented in Fig. 3, where we do indeed detect apparent correlations between these parameters. The correlations are in the sense that the range of possible vertical colour gradients and their corresponding scatter is larger for the spiral galaxy types (, or Sb) than for the earliest, lenticular types (, or S0).
In de Grijs et al. (1997) and de Grijs (1998) we found that, even at z distances between 1.5 and , luminosity profiles parallel to the galaxies’ minor axes are still non-negligibly affected by dust extinction. The distribution of vertical colour gradients in Fig. 3 is reminiscent of the distribution of the ratios of I to K-band radial scale lengths in de Grijs et al. (1997) and de Grijs (1998) that indicated residual extinction effects in the later-type sample galaxies.
However, there does not appear to be any correlation between the average colour gradients and their observational dispersions, for none of the colours studied in this paper, and for neither of the sides of the galactic planes. This suggests that, for a given galaxy, residual dust effects are not solely responsible for the observed scatter among the magnitudes of the vertical colour profiles.

We also examined possible correlations between the observed vertical colour gradients and other fundamental galaxy parameters, like their radial and vertical scale parameters, rotational velocities, and absolute (I-band) magnitudes, but did not detect any clear trends among these parameters.
Finally, we investigated possible correlations between radial and vertical colour gradients. We used the ratios of the B and I-band scale lengths of our sample galaxies as indicators of their radial colour gradients (see de Grijs 1998 and references therein). However, other than the observation that galaxies without measurable radial gradient generally do not exhibit any vertical colour gradient either, we do not find any significant correlation between the radial and vertical colour gradients, in any of the three colours studied in this paper. This result is consistent with our suggestion that the vertical colour gradients we measure are likely intrinsic, while the radial colour gradients are mainly reflecting residual extinction effects (de Grijs et al. 1997, de Grijs 1998).
4 Stellar population gradients from broad-band colours
Broad-band colours are relatively easy to obtain and are therefore the most widely used colour diagnostics to date. Moreover, they immediately reveal the approximate nature of a galaxy, which is to first order determined by the dominant stellar population and dust content.
The interpretation of the vertical colour gradients obtained in the previous section depends predominantly on the fundamental question whether one would expect any measurable vertical stellar population gradient over the range used in our analysis, and if so, what its magnitude would be. In the following, we will base the answer to this question on the observational evidence in our own Galaxy, due to observational constraints (e.g., spatial resolution).
The dust-free colours of a composite stellar system (i.e., a galaxy) are a function of its age and star formation history. Thus, in order to address this question, we first need to obtain the dependence of the system’s mean age on the height above the Galactic plane. Although this seems to be a rather fundamental question, surprisingly little work has been done in this field.
Jønch-Sørensen (1995) observed, for his sample of F and early G-type stars, that all stars younger than 4 Gyr were found at pc, whereas the minimum age increases with increasing height above the Galactic plane up to at least kpc, where the minimum age is 4-5 Gyr. He also shows that the logarithmic age distribution for stars found at kpc can be represented by a Gaussian distribution with a mean age of Gyr, approximately constant with z height. The width of the Gaussian distribution is comparable to the approximate accuracy of his age estimates for the faintest stars.
Knude (1997) studied a statistically significant sample of young ( Gyr) sharply defined main sequence / subgiant A stars in the direction of the North Galactic Pole, with a sample median age of 0.75 Gyr, and concluded that they show a very clear trend of mean age with z height, increasing almost linearly to Gyr at pc, after which the mean age distribution levels off and remains approximately constant up to the completeness limit at 450 pc.
Apart from these papers, no other reference has been made to the Galactic mean age distribution as a function of height above the plane. Therefore, we will discuss two alternative and interdependent methods to obtain this information:
-
1.
by supplementing the vertical metallicity gradients discussed above (Sect. 1.2) with the Galactic age-metallicity relation (AMR); and
-
2.
by combining the age-velocity dispersion relation (AVR) with the dependence of the velocity dispersion on z height.
In either case, the observational results are controversial and show large discrepancies, however.
4.1 The age – metallicity relation
The well-known dependence of metal abundance on age of the stars and open clusters in our Galaxy is one of the most important constraints on chemical evolution theories, although, after almost two decades of research in this field, a consensus on the exact correlation has not yet been reached.
4.1.1 The solar neighbourhood AMR
In a landmark paper, Twarog (1980) published the first detailed study of the local (solar neighbourhood) AMR, in which he concluded that the metallicity increased by a factor of about 4 between 13 and 4 Gyr ago, and only slightly since then. Although Carlberg et al. (1985) claimed to have detected a serious discrepancy with Twarog’s (1980) AMR for the younger stars, based on new metallicity and age calibrations, and differences in their sample selection, modern determinations of the solar neighbourhood AMR, based on high-accuracy observations of homogeneous samples of representative Galactic disc tracers, agree relatively well, within the large scatter about the relation (see Sect. 4.1.2), with Twarog’s (1980) original determination (e.g., Nissen, Edvardsson & Gustafsson 1985; Knude, Schnedler Nielsen & Winther 1987; Lee, Ann & Sung 1989; Meusinger, Reimann & Stecklum 1991; Edvardsson et al. 1993; Ng & Bertelli 1998; see Meusinger et al. 1991 and Carraro, Ng & Portinari 1998 for reviews), although Edvardsson et al.’s (1993) AMR gives slightly lower abundances (by dex in [Fe/H]) for stars in the age range from about 7 to 11 Gyr (see also Rocha-Pinto & Maciel 1997).
Estimates of the slope for the solar neighbourhood AMR range from none (Freeman 1991, for stars with ages between 3 and 10 Gyr), 0.02 dex Gyr-1 (Carlberg et al. 1985, Gyr; Lee et al. 1989, Gyr), and 0.04 dex Gyr-1 (Meusinger et al. 1991, Gyr; Jønch-Sørensen 1995, Gyr) to 0.07 dex Gyr-1 (Edvardsson et al. 1993, Gyr; Carraro et al. 1998, Gyr; Ng & Bertelli 1998, Gyr). The most recent slope determinations, which are based on Hipparcos data, indicate that there is no apparent slope in the solar neighbourhood AMR for stars younger than 10 Gyr (Carraro et al. 1998; Ng & Bertelli 1998); the slope determined for the older stars agrees very well with Twarog’s (1980) original determination.
4.1.2 The scatter about the AMR
The most striking feature of these AMR determinations is the enormous intrinsic scatter around the average relation, which is generally obtained by binning in age intervals. This scatter, for a given age comparable to the overall increase in metallicity over the lifetime of the Galaxy, makes the correlation for the younger stars rather weak. Although it has been found to be relatively easy to explain the average trend by theoretical models involving infall of gas, either from the intergalactic medium or from the Galactic thick disc (Sommer-Larsen & Yoshii 1990), at a rate of about half the star formation rate (SFR, e.g., Twarog 1980; Carlberg et al. 1985; Strobel 1991; see Meusinger et al. 1991 for a review; Pilyugin & Edmunds 1996a,b), possibly combined with radial inflow across the disc (Carlberg et al. 1985, but see Lacey & Fall 1985 and Meusinger et al. 1991), causing metal enrichment to occur in the disc, it has proven no easy task to explain the observed scatter about the relationship in terms of realistic physical processes.
Several mechanisms have been suggested to be responsible for the observed spread in metal abundance at any given age (see Carraro et al. 1998 for a review):
-
1.
Diffusion of stellar orbits into the solar neighbourhood by scattering off molecular clouds, transient spiral waves, or infalling gas clouds, causing the mixing of stars originating from different Galactocentric distances, where the stellar population might have evolved at a different rate (e.g., Grenon 1987; Edvardsson et al. 1993; François & Matteucci 1993; Jønch-Sørensen 1995). However, even after correcting the observations for the expected effect associated with this mechanism as well as for any spatial abundance gradient, the remaining scatter remains sufficiently large to require additional mechanisms (Edvardsson et al. 1993; see also Carraro et al. 1998). In addition, Pilyugin & Edmunds (1996b) point out that this effect would require a larger scatter for older stars compared to the younger population, which is not supported by the observations.
-
2.
Self-enrichment of the gas due to non-instantaneous mixing, causing local inhomogeneities to arise in the metallicity distribution (Malinie et al. 1993). This could be triggered by the infall of gas, or by sequential bursts of star formation (e.g., Edvardsson et al. 1993; Pilyugin & Edmunds 1996b; van den Hoek & de Jong 1997; Ng & Bertelli 1998). Carraro et al. (1998) note that although both infall of gas and sequential star formation are observed to occur in the solar neighbourhood, the combination of both mechanisms is required to explain the observed scatter. Finally, Pilyugin & Edmunds (1996b) argue that an irregular rate of accretion of unenriched gas will more effectively create the observed scatter.
-
3.
The admixture of stars associated with different Galactic structures, e.g., the thin disc, thick disc and halo components, each with its own local AMR (Strobel 1991; Jønch-Sørensen 1995). However, Pardi, Ferrini & Matteucci (1994) and Carraro et al. (1998) argue that this mechanism is not attractive, because of the low density of the thick disc and halo components in the solar neighbourhood.
4.1.3 Beyond the solar neighbourhood
An attempt to study the AMR outside the solar neighbourhood has been made by Jønch-Sørensen (1995), who studied an in situ sample of F and early G-type stars in six selected directions within the Galactic disc, and at z-heights typically below 2 kpc, thereby including both thin and thick disc stars. He found a remarkably similar thin-disc AMR ( kpc) to the local AMR discussed above, with a slope of dex Gyr-1 for stars in the age range from 2 to 12 Gyr.
Alternatively, the AMR for Galactic open clusters has been studied by a number of authors (e.g., Strobel 1991; Friel & Janes 1993; Carraro & Chiosi 1994; Carraro et al. 1998). Open clusters are supposed to be good tracers of the Galactic AMR, because their ages, abundances, and positions can be estimated to high accuracy, and they represent the old thin disc population (e.g., Strobel 1991; Friel & Janes 1993).
Although selection effects related to, among others, the cluster survival mechanisms, their position in the Galactic disc and the possible existence of a spatial metallicity gradient play a strong role in the determination of the open cluster AMR (e.g., Friel & Janes 1993; Carraro & Chiosi 1994; Carraro et al. 1998), the AMRs for open clusters and stars are essentially the same, including the large scatter about the relationship.
A similar relationship as for the solar neighbourhood stars has been found for the open clusters in the Galactic anticenter direction (Friel & Janes 1993) as well as in the LMC (e.g., Olzewski et al. 1991; Strobel 1991; Friel & Janes 1993), although chemical enrichment has taken place at a slower rate in the LMC than in the Galaxy.
4.2 The age – vertical velocity dispersion relation
Although it is well-known that the velocity dispersions of disc stars vary with age, the lack of accurate kinematical observations has prevented the detailed study of the correlation between the mean stellar age and their vertical velocity dispersions (referred to AVRz henceforth). In addition, a number of discrepant AVRz’s has appeared in the literature (e.g., Mayor 1974; Wielen 1977; Carlberg et al. 1985; Strömgren 1987; Freeman 1991; Meusinger et al. 1991; Gómez et al. 1997; see Haywood, Robin & Crézé 1997a,b for a comparison), adding confusion to the already obscure picture.
The AVR of stars in the solar neighbourhood traces the kinematical and dynamical evolution of the local Galactic disc and is an indicator of the heating mechanism by which the stellar random velocities are increased after their birth. This diffusion of the stellar orbits in the Galactic disc is caused by irregularities in the Galactic gravitational field (Wielen 1977; Wielen & Fuchs 1983), like the interaction with giant molecular clouds (e.g., Spitzer & Schwarzschild 1951, 1953; Lacey 1984) or recurrent transient spiral waves (e.g., Barbanis & Woltjer 1967; Carlberg & Sellwood 1985). Both mechanisms predict that the stellar velocity dispersions are a continuous function of age, such that for young stars constant (e.g., Carlberg et al. 1985), where represents the vertical velocity dispersion in the Galactic disc. For older stars, .
Wielen’s (1977) often referenced AVR showed a smooth increase of the stellar velocity with age, although for solar abundance stars the vertical velocity dispersion seems to become approximately constant in the age range from about 3-6 to 13 Gyr (e.g., Carlberg et al. 1985; Strömgren 1987; Freeman 1991; Gómez et al. 1997; Haywood et al. 1997a,b).
With the recent acquisition of highly accurate kinematical data and more accurate age dating techniques, it has become possible to study the features of the AVRz in more detail. Freeman (1991) argues that his AVRz, which is based on Edvardsson et al.’s (1993) new kinematically unbiased sample of nearby F and early G-type stars for which ages are known with high precision, appears to show three age zones in terms of the stellar vertical velocity dispersions, Gyr, Gyr, and Gyr. A similar conclusion is reached by Gómez et al. (1997), based on new observations of 2812 stars in the Hipparcos Catalogue (ESA 1997). Gómez et al. (1997) subdivide the youngest age bin into two subbins, i.e., stars with Gyr, corresponding to incomplete mixing, and stars between about 1 and Gyr.
The second age bin, which is characterized by the saturation of the vertical velocity dispersion at about 15-17 km s-1 (Gómez et al. 1997) to km s-1 (Freeman 1991), does not show any correlation of vertical velocity dispersion with age, and represents the old-disc population (Freeman 1991). Haywood et al. (1997a) split up the old-disc component into three further subdivisions (3-5, 5-7 and 7-10 Gyr) and caution that on neither the shape nor the level at which the AVRz saturates consensus has yet been reached. However, it appears that the disc heating saturates after 3-6 Gyr, because there seems to be no dynamical disc evolution between 3-6 and 10 Gyr.
The kinematics and metallicities of the stars in the highest-age bin indicate that they belong to the thick disc (Freeman 1991).
4.3 The dependence of mean age on height above the Galactic plane
From the discussion of the AMR, we adopt for the thin-disc ages associated with the stars in the vertical range of interest (between about 4 and 10 Gyr; Freeman 1991) the mean slope of 0.04 () dex Gyr-1, which also seems to apply to the first two scale heights of the old-disc population towards the North Galactic Pole (Jønch-Sørensen 1995), and is consistent with the most recent and highest-precision results.
As we discussed in Sect. 1.2, most modern estimates of the vertical metallicity gradient in the Galactic disc are in the range dex kpc-1. However, Jønch-Sørensen’s (1995) best results for pc and solved simultaneously for both a radial and a vertical gradient, indicate that the in situ vertical gradient is of order dex kpc-1, of which the error estimate partially overlaps with the range quoted before. Since Jønch-Sørensen’s (1995) analysis was done in a similar vertical range as that where we measured our colour gradients, and because he also properly accounted for the presence of possible radial colour gradients, we will adopt his result in the following analysis.
If we combine both dependences,
| (1) |
for Gyr, and
| (2) |
we derive
| (3) |
for Gyr.
To compare this dependence for the Galaxy to our results, obtained at z heights between , we need to know the Galactic thin disc scale height. From the overview by Sackett (1997), it appears that the most recent estimates of the Galactic thin disc scale height in the solar neighbourhood converge at kpc (Ojha et al. 1996; see also Kent, Dame & Fazio 1991). Thus, we should compare our results from external edge-on galaxies with the region kpc in the Galaxy; over this z range, the mean age of the dominant population increases only by about 2.6 Gyr (Eq. (3)); as a reminder, the mean age of the stars in the Galactic old thin disc for which Jønch-Sørensen (1995) obtained these relations is about 8 Gyr.
If we combine the most recent results on the AVR with the observation that the stellar velocity dispersion in the radial direction of A stars in the direction of the North Galactic Pole increases up to about 300 pc and might flatten out at higher z heights (although the data is rather noisy; Knude 1997), the results from the AVR analysis are consistent with the AMR data.
Now, we can combine this information with stellar population synthesis models of composite galactic systems, like the ones provided by Bruzual & Charlot (1993; henceforth BC93). The colours of a galactic stellar population at ages greater than about 0.2 Gyr depend sensitively on the star formation history assumed (BC93). Although the precise star formation histories of spiral galaxies are still heavily debated, estimates of the global star formation history over the lifetime of the Galaxy are generally consistent with a constant SFR (e.g., Twarog 1980; Meusinger et al. 1991).
Under these assumptions, the stellar population differences expected to manifest themselves in our broad-band colours, for an age range of 2.6 Gyr centered on the mean old-disc age of 8 Gyr (Jønch-Sørensen 1995), amount to , and mag. The corresponding population gradients are , and 0.03 mag in and , respectively. In Fig. 4 we show the evolution of our broad-band colours for a composite stellar population, based on the convolution integrals over time of the spectral energy distributions for a single stellar population of solar metallicity (BC93), for both the generally assumed constant SFR (solid lines) and an exponentially decaying SFR with an e-folding time scale of 8 Gyr, according to Pilyugin & Edmunds’ (1996a) best-fitting model to describe the Galactic AMR (dashed lines). To compute the colours in the time-dependent SFR case, we have assumed “closed box” evolution of the composite stellar population, i.e., without the infall of extragalactic gas, but including gas recycling (and metal enrichment) with an efficiency of 46% (Haywood et al. 1997b; see also Kennicutt, Tamblyn & Congdon 1994) until the present time, and assuming a Salpeter (1955) initial mass function for stellar masses ranging from 0.1 to 125 . If we assume that the exponentially decaying SFR advocated by Pilyugin & Edmunds (1996a) is a more representative description of the Galactic evolution, these broad-band vertical colour gradients due to population gradients increase to mag mag , and mag . Finally, for comparison, we have also included the canonical single-burst colour evolution (thin dotted lines in Figs. 4a–c; BC93). The colour gradients for these models are similar to those obtained from the models of composite stellar systems with a constant SFR, although these single-burst colours become significantly redder over their lifetimes.
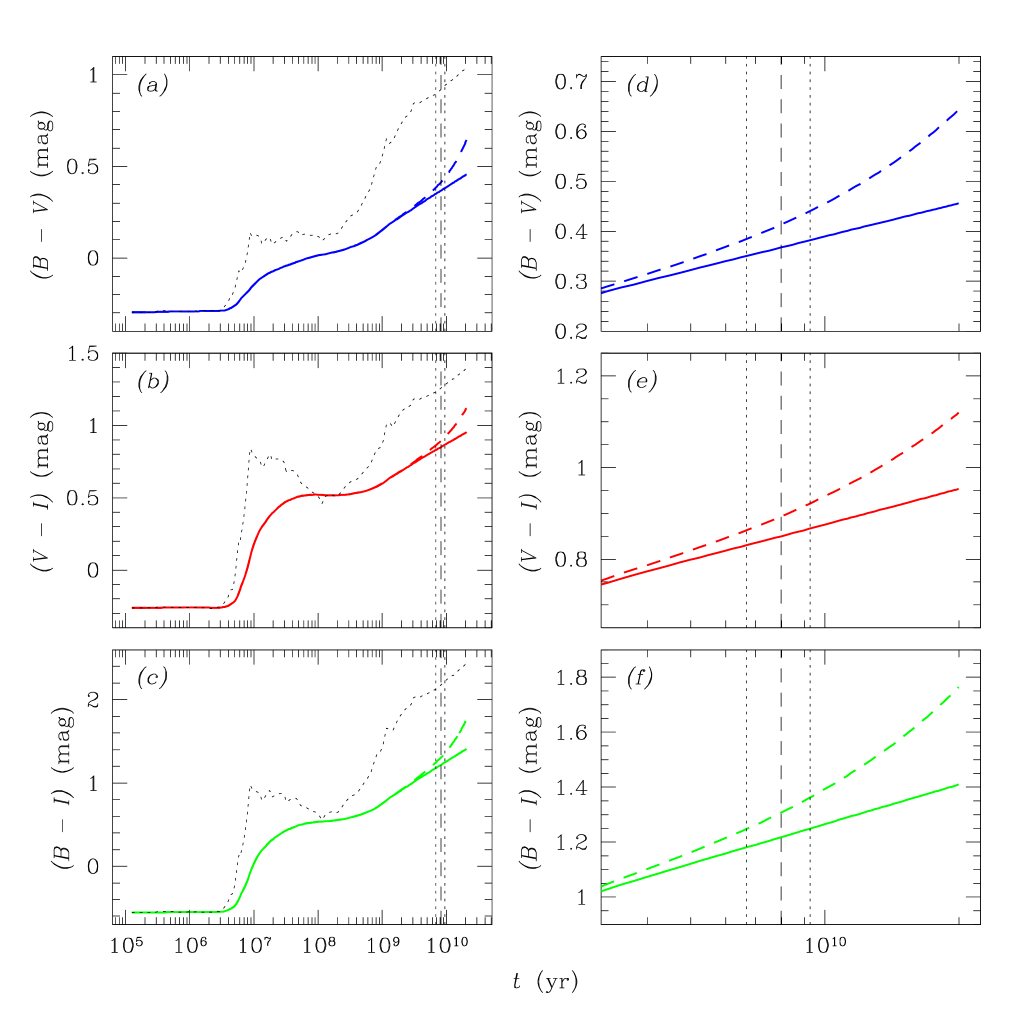
For simplicity, we will assume that these population gradients, and the star formation histories assumed to obtain them, are applicable to all our sample galaxies and are representative of their stellar populations, irrespective of galaxy type. If we examine Fig. 3 in detail, and in particular the panel corresponding to the average vertical colour gradients in the images, where any population gradients would show up most prominently, it turns out that about 17 and 26, or about 46 and 70% of our 37 sample galaxies exhibit average vertical colour gradients in excess of the population gradients expected from, respectively, an exponentially decaying SFR as discussed above, or a constant SFR.
Even though one should be cautious in interpreting these percentages, due to uncertainties in the model assumptions, it is obvious that for a significant fraction of our sample galaxies another mechanism is required to explain the magnitude of the observed gradients, like, e.g., residual dust extinction at the z heights studied in this paper (Sect. 3.2) or vertical metallicity gradients.
5 Vertical metallicity gradients
The colour and metallicity distributions in a galactic disc are the result of the composite star formation and chemical enrichment history of the galaxy over its lifetime, and not a representation of the composition of a single stellar population in the galactic disc at any given time. As Jønch-Sørensen (1995) argues, an evolution of the metallicity gradient with time may be expected because of the gas flows in a galaxy and also because of the dependence of chemical enrichment on, e.g., the gas fraction of the total mass and the star formation efficiency. Therefore, since the observed gradients are also affected by the disc dynamical evolution (i.e., orbit diffusion), the original gradients may be very hard to trace for stellar populations that are older than a few Gyr.
It is expected that, over the lifetimes of galaxies, galactic discs accrete a substantial number of lumps of stars, gas and dark matter, or satellite galaxies, through infall (cf. the Searle & Zinn [1978] Galaxy formation hypothesis). The effects of such minor mergers are not clear, however. Norris & Ryan (1989) and Norris & Green (1989) argue that such random merger events cannot explain the continuous metallicity behaviour as a function of height above the plane. However, Quinn, Hernquist & Fullagar (1993) argue that the correlations of abundance with scale height and vertical velocity are not destroyed by mergers; they show, based on numerical simulations, that an initial abundance gradient with z height can be accentuated by a merger, as is also seen in mergers of spherical systems and cosmological models of halo formation (see Quinn et al. 1993 for a review). On the other hand, Gilmore et al. (1995) argue that the dissipationless relaxation of the thin-disc constituents after a minor merger will weaken any existing metallicity gradient, but not destroy it completely (e.g., White 1980; Hernquist & Quinn 1993).
The analysis of the present sample may help distinguish between these scenarios. It is generally assumed that lenticular (S0) galaxies have undergone a greater of number significant interactions or accretion events than later-type spiral galaxies (see, e.g., Schweizer [1996] for a review). Combined with the observational evidence from Fig. 3, this suggests that initial vertical metallicity gradients, if any, have likely not been accentuated by these accretion or merging events. On the other hand, they may have weakened any existing vertical gradient in metal abundance, although we cannot rule out the possibility that they have left the existing correlations unchanged. Of course, this analysis depends critically on the assumptions made regarding the uniformity of the initial metallicity gradients as a function of galaxy type. To date, no models have been constructed that include the treatment of metal abundance during galaxy formation, however.
6 Summary and conclusions
We have analyzed optical B, V, and I-band observations and their corresponding colour maps of a statistically complete sample of edge-on disc-dominated spiral and lenticular galaxies. The main aim of this study was to examine the intrinsic vertical colour gradients in the discs of our sample galaxies, and to constrain the effects of population gradients, residual dust extinction and gradients in the galaxies’ metal abundance, based on the observed changes of broad-band colour with increasing height above the galactic planes.
For our current study, we needed to isolate those vertical ranges of our edge-on galactic discs that were as little as possible affected by reddening due to extinction, poor S/N ratios, foreground stars, or out-of-plane spiral arms. We concluded that, for the majority of our sample galaxies, the colours and colour gradients in the range most likely reflect the intrinsic galactic properties, since any small-scale variations in the vertical colour profiles due to external effects are smoothed out over this relatively large range.
From the detailed examination of the vertical colour profiles in our sample galaxies (Figs. 1 and 2), it appears that the intrinsic vertical colour gradients are either non-existent, or small and relatively constant as a function of position along the galaxies’ major axes. On average, the earlier-type galaxies exhibit smaller vertical gradients (and scatter among the average gradients) than the later types; our results are consistent with the absence of any vertical colour gradient in the discs of our early-type sample galaxies.
In most galaxies small-scale variations in the magnitude and even the direction of the vertical gradient are observed, in the sense that at larger galactocentric distances they generally display redder colours with increasing z height, whereas the opposite is often observed in and near the galactic centres.
About half to two-thirds of our sample galaxies exhibit average vertical colour gradients in excess of the population gradients expected from observational data of the Galaxy, based on the SFR assumed. Although one should be cautious in interpreting these results directly, due to the numerous model assumptions involved, it is obvious that for a significant fraction of our sample galaxies another mechanism is required to explain the magnitude of the observed gradients, like, e.g., residual dust extinction or vertical metallicity gradients.
The non-zero colour gradients in a significant fraction of our sample galaxies are likely (at least) partially due to residual dust extinction at these z heights, as is also evidenced from the sometimes significant differences between the vertical colour gradients measured on either side of the galactic planes. In addition, in the cases where we observe a blueing of the galactic disc with height above the plane, we cannot always rule out the possibility that this is due to extinction effects.
Finally, several scenarios have been proposed to describe the evolution of a vertical metallicity gradient over the lifetime of a galaxy, under the influence of infall or minor merger events. It is generally assumed that lenticular galaxies have undergone a greater of number significant interactions or accretion events than later-type spiral galaxies. Combined with the observational evidence from Fig. 3, this suggests that initial vertical metallicity gradients, if any, have likely not been accentuated by these accretion or merging events, as suggested by Quinn et al. (1993). On the other hand, they may have weakened any existing vertical gradient in metal abundance (Gilmore et al. 1995), although we cannot rule out the possibility that they have left the existing correlations unchanged.
Acknowledgments
During most of this work RdeG was supported by NASA grants NAG 5-3428 and NAG 5-6403. RdeG also wishes to thank the Department of Physics of the University of Durham for their hospitality on two visits. This research has made use of NASA’s Astrophysics Data System Abstract Service.
References
- [] Aoki T.E., Hiromoto N., Takami H., Okamura S., 1991, PASJ, 43, 755
- [] Barteldrees A., Dettmar R.-J., 1994, A&AS, 103, 475
- [] Bahcall J.N., Soneira R.M., 1980, ApJS, 44, 73
- [] Barbanis B., Woltjer L., 1967, ApJ, 150, 461
- [] Bruzual A., G., Charlot S., 1993, ApJ, 405, 538
- [] Buser R., Rong J.X., 1995, Baltic Astron., 4, 1
- [] Buser R., Rong J.X., Karaali S., 1998, A&A, 331, 934
- [] Carlberg R.G., Dawson P.C., Hsu T., vandenBerg D.A., 1985, ApJ, 294, 674
- [] Carlberg R.G., Sellwood J.A., 1985, ApJ, 292, 79
- [] Carraro G., Chiosi C., 1994, A&A, 287, 761
- [] Carraro G., Ng Y.K., Portinari L., 1998, MNRAS, 296, 1045
- [] Chen B., 1997, AJ, 113, 311
- [] Davies J.I., 1990, MNRAS, 244, 8
- [] de Grijs R., 1997, PhD Thesis, Univ. Groningen, the Netherlands
- [] de Grijs R., 1998, MNRAS, 299, 595
- [] de Grijs R., Peletier R.F., 1999, MNRAS, 310, 157
- [] de Grijs R., Peletier R.F., van der Kruit P.C., 1997, A&A, 327, 966
- [] de Jong R.S., 1996, A&A, 313, 377
- [] de Jong R.S., van der Kruit P.C., 1994, A&AS, 106, 451
- [] de Vaucouleurs G., de Vaucouleurs A., Corwin H.G., Jr., Buta R.J., Paturel G., Fouqué P., 1991, Springer-Verlag, New York (RC3)
- [] Edvardsson E., Andersen J., Gustafsson B., Lambert D.L., Nissen P.E., Tomkin J., 1993, A&A, 275, 101
- [] ESA, 1997, The Hipparcos and Tycho Catalogue, ESA SP-1200
- [] Fisher D., Franx M., Illingworth G., 1996, ApJ, 459, 110
- [] François P., Matteucci F., 1993, A&A, 280, 136
- [] Freeman K.C., 1991, in Sundelius B., ed., Dynamics of Disc Galaxies. Göteborg, p. 15
- [] Friel E.D., Janes K.A., 1993, A&A, 267, 75
- [] Gilmore G., Wyse R.F.G., Jones J.B., 1995, AJ, 109, 1095
- [] Gómez A.E., Grenier S., Udry S., Haywood M., Meillon L., Sabas V., Sellier A., Morin D., 1997, in ESA SP-402, Hipparcos – Venice 1997. Venice, p. 621
- [] Grenon M., 1977, in Müller E.A., ed., Highlights of Astronomy Vol. 4 Part ii. IAU, p. 55
- [] Grenon M., 1987, J. Astrophys. Astr., 8, 123
- [] Hamabe M., Kodaira K., Okamura S., Takase B., 1979, PASJ, 31, 431
- [] Hamabe M., Kodaira K., Okamura S., Takase B., 1980, PASJ, 32, 197
- [] Hartkopf W.I., Yoss K.M., 1982, AJ, 87, 1679
- [] Haywood M., Robin A.C., Crézé M., 1997a, A&A, 320, 428
- [] Haywood M., Robin A.C., Crézé M., 1997b, A&A, 320, 440
- [] Hegyi D.J., Gerber G., 1979, in Evans D.S., ed., Photometry, Kinematics, and Dynamics of Galaxies. Univ. of Texas Astron. Dept., Austin, p. 119
- [] Hernquist L., Quinn P.J., 1993, in Majewski S.R., ed., ASP Conf. Ser. Vol. 49, Galaxy Evolution – The Milky Way Perspective, Astron. Soc. Pac., San Francisco, p. 187
- [] Jansen R.A., Knapen J.H., Beckman J.E., Peletier R.F., Hes R., 1994, MNRAS, 270, 373
- [] Jensen E.B., Thuan T.X., 1982, ApJS, 50, 421
- [] Jønch-Sørensen H., Knude J., 1994, A&A, 288, 139
- [] Jønch-Sørensen H., 1995, A&A, 298, 799
- [] Kennicutt Jr. R.C., Tamblyn P., Congdon C.W., 1994, ApJ, 435, 22
- [] Kent S.M., Dame T.M., Fazio G., 1991, ApJ, 378, 131
- [] Knude J., 1997, A&A 327, 90
- [] Knude J., Schnedler Nielsen H., Winther M., 1987, A&A, 179, 115
- [] Kuchinski L.E., Terndrup D.M., 1996, AJ, 111, 1073
- [] Lacey C.G., 1984, MNRAS, 208, 687
- [] Lacey C.G., Fall S.M., 1985, ApJ, 290, 154
- [] Lauberts A., Valentijn E.A., 1989, The Surface Photometry Catalogue of the ESO-Uppsala Galaxies. ESO, Garching bei München (ESO-LV)
- [] Lee S.-W., Ann H.B., Sung H., 1989, JKAS, 22, 43
- [] Lequeux J., Fort B., Dantel-Fort M., Cuillandre J.-C., Mellier Y., 1996, A&A, 312, L1
- [] Lequeux J., Combes F., Dantel-Fort M., Cuillandre J.-C., Fort B., Mellier Y., 1998, A&A, 334, L9
- [] Majewski S.R., 1992, ApJS, 78, 87
- [] Malinie G., Hartmann D.H., Clayton D.D., Mathews G.J., 1993, ApJ, 413, 633
- [] Mathewson D.S., Ford V.L., Buchhorn M., 1992, ApJS, 81, 413
- [] Mathewson D.S., Ford V.L., 1996, ApJS, 107, 97
- [] Mayor M., 1974, A&A, 32, 321
- [] Meusinger H., Reimann H.-G., Stecklum B., 1991, A&A, 245, 57
- [] Ng Y.K., Bertelli G., 1998, A&A, 329, 943
- [] Nissen P.E., Edvardsson B., Gustafsson B., 1985, in Danziger I.J., Matteucci F., Kjär K., eds., Proc. ESO Workshop on Production and Distribution of CNO Elements. ESO, Garching bei München, p. 131
- [] Norris J.E., Green E.M., 1989, ApJ, 337, 272
- [] Norris J.E., Ryan S.G., 1989, ApJ, 336, L17
- [] Ojha D.K., Bienaymé O., Robin A.C., Creźé M., Mohan V., 1996, A&A, 311, 456
- [] Olzewski E.W., Schommer R.A., Suntzeff N.B., Harris H.C., 1991, AJ, 101, 515
- [] Pardi M.C., Ferrini F., Matteucci F., 1994, ApJ, 444, 207
- [] Peletier R.F., Balcells M., 1996, AJ, 111, 2238
- [] Peletier R.F., Balcells M., 1997, NewA, 1, 349
- [] Pilyugin L.S., Edmunds M.G., 1996a, A&A, 313, 783
- [] Pilyugin L.S., Edmunds M.G., 1996b, A&A, 313, 792
- [] Quinn P.J., Hernquist L., Fullagar D.P., 1993, ApJ, 403, 74
- [] Reid N., Majewski S.R., 1993, ApJ, 409, 635
- [] Robin A.C., Haywood M., Crézé M., Ojha D.K., Bienaymé O., 1996, A&A, 305, 125
- [] Rocha-Pinto H.J., Maciel W.J., 1997, MNRAS, 289, 882
- [] Rudy R.J., Woodward C.E., Hodge T., Fairfield S.W., Harker D.E., 1997, Nat., 387, 159
- [] Sackett P.D., 1997, ApJ, 483, 103
- [] Salpeter E.E., 1955, ApJ, 121, 161
- [] Sasaki T., 1987, PASJ, 39, 849
- [] Schmidt M., 1963, ApJ, 137, 758
- [] Schweizer F., 1996, in Kennicutt Jr. R.C., Schweizer F., Barnes J.E., eds., Saas-Fee Advanced Course 26, Galaxies: Interactions and Induced Star Formation. Springer-Verlag, Heidelberg, p. 105
- [] Searle L., Zinn R., 1978, ApJ, 225, 357
- [] Sommer-Larsen J., Yoshii Y., 1990, MNRAS, 243, 468
- [] Spitzer L., Schwarzschild M., 1951, ApJ, 114, 385
- [] Spitzer L., Schwarzschild M., 1953, ApJ, 118, 106
- [] Strobel A., 1991, A&A, 247, 35
- [] Strömgren B., 1987, in Gilmore G., Carswell R., eds., Proc. NATO Adv. Study Inst., The Galaxy. Reidel, Dordrecht, p. 229
- [] Tinsley B., 1980, Fund. Cosmic Phys., 5, 287
- [] Trefzger C.F., Pel J.W., Gabi S., 1995, A&A, 304, 381
- [] Twarog B.A., 1980, ApJ, 242, 242
- [] van den Berg S., 1962, AJ, 67, 1165
- [] van den Hoek L.B., de Jong T., 1997, A&A, 318, 231
- [] van der Kruit P.C., A&A, 192, 117
- [] van der Kruit P.C., Searle L., 1981, A&A, 95, 116
- [] van der Kruit P.C., Searle L., 1982a, A&A, 110, 61
- [] van der Kruit P.C., Searle L., 1982b, A&A, 110, 79
- [] Wainscoat R.J., Freeman K.C., Hyland A.R., 1989, ApJ, 337, 163
- [] White S.D.M., 1980, MNRAS, 191, 1P
- [] Wielen R., 1977, A&A, 60, 263
- [] Wielen R., Fuchs B., 1983, in Shuter W.L., ed., Kinematics, Dynamics and Structure of the Milky Way. Reidel, Dordrecht, p. 81
- [] Worthey G., 1994, ApJS, 95, 107
- [] Yoshii Y., Ishida K., Stobie R.S., 1987, AJ, 93, 323
- [] Yoss K.M., Neese C.L., Hartkopf W.I., 1987, AJ, 94, 1600