Properties of the Non-Thermal Emission in Plerions
Abstract
The synchrotron emission observed in plerions depends on the characteristics of the magnetic fields and relativistic electrons in these supernova remnants. Therefore an analysis of the spectral and spatial properties of this emission, combined with models for the evolution and structure of plerions, would allow one to investigate the evolution of the synchrotron nebula, the structure of the magnetic field, the distribution of the relativistic electrons, as well as to put contraints on the history of the energy input from the associated neutron star.
The identification of a new class of plerionic remnants, with spectral properties different from the Crab Nebula, has been proposed. The spectra of these objects typically show a sharp spectral break at very low frequencies (below 50 GHz), with a steep spectrum right beyond the break. In order to model the properties of their emission, a non-standard evolution of the pulsar output seems to be required.
X-ray observations of the synchrotron emission from the Crab Nebula are shown. They are compared with previous data, and their implications on the structure of the Crab are discussed. Recent millimetric data of this object are also presented. A spatially resolved analysis, based on radio, millimetric and X-ray data, will be carried on also for other plerions.
Osservatorio Astrofisico di Arcetri, Largo Fermi 5, 50125 Firenze (Italy)
1. Introduction
Not all supernova remnants (SNRs) show the “classical” shell-like structure. Some of them present instead a filled-center structure: the prototype is the Crab Nebula, but other objects with similar properties have been discovered since then. They are called filled-center SNRs, or Crab-like SNRs, or plerions (Weiler & Panagia 1978). Plerions are recognized not just on the basis of their morphology, but also of other properties, like: a flat power-law radio spectrum, with a spectral index ranging from 0.0 to 0.3; a high radio polarization, with a well organized pattern (not true for all plerions); a power-law X-ray spectrum, with photon index close to 2 (Asaoka & Koyama 1990); the detection of an associated pulsar (not true for all plerions — see Pacini, these Proceedings).
Although the details of the nature and structure of plerions are still unclear, there is a common agreement on the following points: a plerion is an expanding bubble, formed essentially by magnetic fields and relativistic electrons, and the observed synchrotron emission originates from these two components; a continuous supply of magnetic flux and relativistic particles is required, in order to explain the typical synchrotron emissivities, as well as the high frequency emission (from particles with synchrotron lifetimes shorter than the SNR age).
In a simplified approach, one may assume that magnetic fields and particles are uniformly distributed into the plerionic bubble: this approach (Pacini & Salvati 1973; Reynolds & Chevalier 1984; Bandiera et al. 1984) is usually adequate to explain the evolution of the overall nebular spectrum. However the homogeneity assumption is likely to be incorrect. New particles and magnetic flux are released by the associated pulsar, presumably near the pulsar wind termination shock (Rees & Gunn 1974; Kennel & Coroniti 1984a,b). Therefore the degree of homogeneity of the electrons distribution depends on how efficient are the mechanisms (diffusion, or advection) by which particles propagate through the nebula (see Amato, these Proceedings).
Also the structure of the magnetic field can be rather complex. From considerations on the MHD relations it follows that spherical models cannot account adequately for the field structure: it can have at most a cylindrical symmetry (Begelman & Li 1992), but more complicate patterns are suggested by observations. The comparison of high resolution maps at various frequencies may then give important clues on the structure on plerions, and on the processes governing the evolution of the magnetic field as well as of the particle distribution.
The outline of this paper is the following: I begin by reviewing the classical, simplified approach to the evolution of a plerion and of its emission; then I consider the case of the Crab Nebula, the prototype of this class, as well as of some other plerions with characteristics different from the Crab; finally I describe the results and perspectives of a multifrequency study, with high spatial resolution, of the Crab Nebula and ot and other plerionsher plerions.
2. Classical models of the evolution of the synchrotron emission
Classical models for the evolution of the synchrotron emission from a plerion as a whole (Pacini & Salvati 1973; Reynolds & Chevalier 1984; Bandiera et al. 1984) are based on the original analysis of Kardashev (1962). The starting points are the two basic synchrotron equations, that for the radiated power from an electron with energy (), and that for the typical frequency of radiation (): these formulae are averages over pitch angles, under the assumption of isotropy. If is the present distribution of electrons, and the magnetic field is constant throughout the nebula, it immediately follows that the synchrotron spectrum is given by . This relation establishes the well known connection between the particle distribution and the radiated spectrum (if , then ).
Let us consider, for instance, the synchrotron spectrum of the Crab Nebula. One may identify various spectral regions with different spectral indices: the radio, with ; the optical, with ; the X rays, with ; and a further steepening above 100 keV. All the changes of slope in correspond to breaks in : the issue is to determine which of them are intrinsic to the injected particle distribution, and which result from the evolution. Usually an original power-law distribution is assumed, with the aim of explaining all breaks as originated just from the evolution.
The basic ingredients are: 1. The evolution of the energy input from the spinning down pulsar (this input typically lasts for a time , and then falls down). 2. The fraction by which this power is shared between injected particles and field (usually assumed to be constant). 3. The expansion law of the nebula, , that at earlier times may be linear or even accelerated; but later on, with the passage of the reverse shock coming from the outer blast wave, the plerion may shrink, and then re-expand at a lower rate (Reynolds & Chevalier 1984).
The evolution of the magnetic field in the nebula is modelled by including the effects of the adiabatic losses; while for the evolution of particles both adiabatic and synchrotron losses must be taken into account. A special particle energy is that at which the timescales for adiabatic and synchrotron losses are comparable (): a break in the spectrum occurs at the frequency that corresponds to . Before the time this is the only evolutive break present in the spectrum. Kardashev (1962) showed that the change in the spectral index must be : this result can be directly tested on the data. After the time , a second break should appear in the distribution, at the energy : this is the “fossil break”, namely the adiabatic evolution of the break located at at the time . This break is at a frequency smaller than that of the truly evolutive break.
The Crab Nebula fits rather well into the scenario described above. In fact: 1. The classical law for the pulsar spin-down seems to be verified: the total energy released by the pulsar since its birth ( erg) is also consistent with the kinetic energy excess in the optical thermal filaments (due to their dynamical coupling with the plerionic bubble). 2. The efficiency in particle production is reasonably high: the present pulsar spin-down power () is comparable with the total synchrotron luminosity (). 3. The efficiency in magnetic field production is rather high: from the position of the break ( Hz) one may derive a nebular magnetic field mG, i.e. a magnetic energy erg, close to the total energy released by the pulsar. 4. The measured secular variation in radio (0.17% per yr; Aller & Reynolds 1985) agrees with the theoretical estimate (Véron-Cetty & Woltjer 1991). 5. The change in the spectral slope from radio to optical is , in agreement with Kardashev; however the further breaks at higher frequencies cannot be explained in this way, unless breaks in the injected distribution are invoked.
It can be noticed that in the Crab Nebula fields and electrons are in near equipartition. Is this equipartition typical for all plerions? Does equipartition hold at injection, or is it the result of a subsequent field-particle coupling?
3. Non Crab-like plerions
There is a bunch of plerions characterized by a spectral break at frequencies much lower than in the Crab Nebula: for instance, in 3C58 and in G21.50.9 the break is at 50 GHz; while in CTB87 it is at 20 GHz. Woltjer et al. (1997) discussed properties and evolutive implications for these objects. Beyond the low-frequency position of the break, they share other features, like a sharp break, with larger than the canonical value 0.5. Furthermore, in none of these objects pulsations from the expected neutron star have been detected yet.
It is hard to explain the observed break as the main evolutive break, since it would imply a very large nebular field. The most extreme case is that of CTB87, an extended plerion for which the estimated magnetic energy is greater than erg, well above that of the supernova explosion itself. This paradox can be solved if the break observed is the fossil break: in this case also the theoretical limit on across the break can be overcome, under the condition that the pulsar slow-down follows a very steep law (even though some difficulties remain, in modelling the break sharpness). This implies that the associated pulsar has slowed down considerably, and therefore has become much fainter than at the origin: this may be a reason why no pulsations are detectable.
Among these plerions, 3C58 is that posing more problems to models. In this object the sharpness of the break requires an abrupt decrease in the rate of injected particles. Beyond that, models must also account for the measured increase in the radio emission (Green 1987, and references therein). Woltjer et al. (1997) show that, in order to match the observations, a sudden change in the relative efficiencies of field and particles production is required: this could actually be associated to a recent “phase change” in the pulsar magnetosphere.
4. Plerionic components in composite SNRs
Composite SNRs are those in which a shell-like component (due to the interaction of the supernova ejecta with the ambient medium) co-exists with a plerionic component. Helfand & Becker (1987) introduced the class of composite SNRs and outlined their properties: they are old enough to have developed a shell component, but still young enough to host a detectable plerionic component.
Studying a composite SNR is more interesting than just studying independently a shell-like and a plerionic remnant, since the two components have the same origin (thus the same age and distance), and are interacting. Slane et al. (1998) discuss what kind of diagnostic tools can be used. For instance, the X-ray spectrum of the thermal shell allows one to evaluate its pressure and therefore, by assuming a (rough) pressure equilibrium with the plerion, the plerionic magnetic field. This is an estimate alternative to that based on the position of the evolutive break, and may then represent a test on the nature of that break.
In the cases in which the associated pulsar has not been detected yet, its most likely parameters may be estimated. If a pulsar has been already detected, its spin-down time may be used to estimate the SNR age, that should agree with the age derived from the thermal X-ray spectrum. Moreover one can derive the present pulsar energy output, and then the efficiency by which this energy is converted into magnetic fields and particles. This analysis has been already carried on for various composite SNRs, like G11.20.3 (Bandiera et al. 1996), CTA1 (Slane et al. 1997), N157B (Cusumano et al. 1998), MSH1162 (Harrus et al. 1998), G327.11.1 (Sun et al. 1999), G39.20.3 (Harrus & Slane 1999).
5. The Crab Nebula: results of a multifrequency analysis
The above considerations on the Crab Nebula, as well as those on other plerions, are mainly referring to their global properties. But a much deeper insight should follow from a combined study of the spatial-spectral properties of the synchrotron emission from these objects. I present here some results coming from a comparison of optical and X-ray maps of the Crab Nebula, and a preliminary analysis of millimetric observations of this plerion.
The Crab Nebula is a very bright object, over a wide range of frequencies: therefore it is an ideal target for a detailed multifrequency investigation with high spatial resolution. Our project has been inspired by the study of Véron-Cetty & Woltjer (1993) on the Crab synchrotron emission in the optical range: they produced a map of the optical spectral index, and showed that a spectral steepening occurs going outwards; they also noticed that the region with optical spectral index flatter than 0.7 matches the shape of the Crab in X rays.
We decided to carry on a detailed, quantitative comparison between optical and X rays: for this reason we have re-analyzed the Véron-Cetty & Woltjer (1993) optical data, while for the X rays we have used public data of ROSAT HRI. In the X-ray data reduction we have stressed, rather than the resolution, the sensitivity to regions with very low surface brightness. For this purpose we have deconvolved the map in order to eliminate the wings of the instrumental Point Spread Function, as well as the halo due to dust scattering. Details on the data analysis and on their interpretation are given by Bandiera et al. (1998).
As already pointed out by Hester et al. (1995) the outer and faint X-ray emission extends almost to the boundary of the optical nebula. We have then performed a quantitative analysis over a large area, by using pixels. Fig. 1 gives a plot of the optical-to-X averaged spectral index () versus the optical spectral index (), where each dot refers to a single pixel: unfortunately no high resolution spectral map in the X rays is available yet.
In the interpretation of this plot our underlining assumption is that, due to the evolution, the spectral indices of the particle distribution, in all energy ranges, tend to steepen: this corresponds to a softening of the emission spectrum at all frequencies, and translates into the requirement that the time evolution of a given bunch of particles produces a drift of the related dot towards the upper right direction of the plot.

The area of the plot can be then subdivided into zones. Most of the dots are in the region confined by the two lines labelled by and : let us call it the “Main Region” of the plot. All the pixels corresponding to the dots in the Main Region are located in the main body of the Crab Nebula, namely that obtained by cutting out the N-W and S-E elongations. The line , parallel to , indicates the cases of no spectral bending between optical and X rays (). Pixels with outline rather well the region of the X-ray “torus” (see e.g. Hester at al. 1995): in the plot they are located on the lower left side, in agreement with our expectation that this is the main location where to find freshly injected particles.
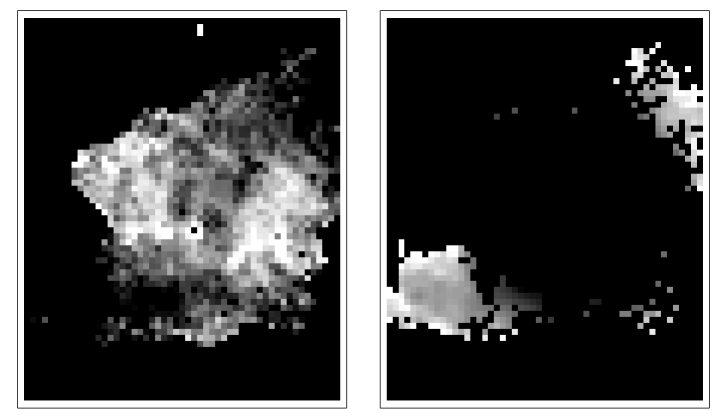
We introduced the quantity , that gives the position of a dot across the strip bounded by lines and : this quantity is related to the spectral bending between optical and X rays. A map of is given in Fig. 2-L: points with lower (namely points with a lower bending; brighter pixels in the map) are generally located in a thick “equatorial” belt. In particular, pixels with a very low bending coincide with some prominent thermal filaments. If the absence of bending is a sign of freshly injected, or re-accelerated, particles, then in these regions some secondary acceleration processes could take place.
Let us go back to the plot of Fig. 1. Following the scheme introduced above, the dots above line (“Secondary Region”) cannot be the result of a continuous evolution from dots originally located in the Main Region. They are more likely to represent the evolution of particles originally emitting a spectrum with not smaller that 1.75 (line ), and that afterwards, while moving outwards, have softened considerably their spectrum. Fig. 2-R gives a map of for all the points confined to the two lobes (brighter pixels indicate higher values of ): here a softening of the spectrum in the outer zones is apparent. In the lobes, the zones with harder spectra seem to lie on the prolongation of the X-ray “jets” (see Hester et al. 1995). This is very clear for the S-E lobe, and may be the indication that these particles are directly provided by the jets.
All these considerations are largely empirical. Moreover, some conclusions may be partly biased by projection effects: anyway the general results should remain valid. The first result is the great variety of local spectra in the nebula. This may be partly explained in terms of the evolution of electrons injected at the central torus; however, both in the regions with low optical-to-X spectral bending and in the polar lobes further particle components seem to be present, suggesting the presence of secondary acceleration (or re-acceleration) processes.
A similar result follows from recent observations at 230 GHz, with the IRAM 30 m telescope, in collaboration with R.Cesaroni and R.Neri: a comparison with a map at 1.4 GHz shows variations in the spectral index between the two frequencies. If confirmed, this result is very important. In fact the spectral index of the Crab Nebula in the radio shows very little spatial variations (Bietenholz et al. 1997) and, if there is only one channel of injection, the same behaviour is expected up to the evolutive spectral break ( Hz for the Crab). On the contrary, flatter spectra are found, between 1.4 and 230 GHz, in the central regions of the Crab Nebula, similarly as seen in the optical range. Further observations are however required, in order to confirm this result.
6. Conclusions
The comparison of high-resolution maps at different frequencies may provide a wealth of information on the plerions, and will help to clarify some open issues on these objects, like: how, where and by how many different mechanisms particles can be accelerated inside plerions? How do they propagate through the nebula? What is the structure of the magnetic field? How the evolution of a plerion and of the associated neutron star affect the synchrotron emission?
A big step towards the understanding of these objects will hopefully come with the arrival of the new generation X-ray telescopes, that will be able to perform spectral mapping with arcsec resolution. X-ray emitting electrons have very short lifetimes, typically of the order of the light crossing time of the nebula, and therefore from an X-ray spectral mapping one could derive information directly on the sites of the present-time injection. But another promising spectral range for effectively probing the physical conditions in the nebula is the millimetric one. In various plerions a spectral break is located near that range: spectral maps may then give indications on the spatial variations of the break position, and therefore on the magnetic structure of the nebula.
Even in the presence of such high quality observations, one may wonder how powerful the synchrotron emission is as a diagnostic tool. In fact it can provide just a mixed information on particles and magnetic field, and only projected along the line of sight. Therefore even the interpretation of high resolution spectral maps is generally not straightforward, unless theoretical models will be developed at a level of detail similar to that of the observations.
Acknowledgments.
Many of the results presented here come from discussions and collaborations with various persons: E.Amato, F.Bocchino, R.Cesaroni, R.Neri, F.Pacini, M.Salvati, P.Slane, L.Woltjer. This work is partly supported by the Italian Space Agency (ASI) through grant ARS-98-116.
References
Aller, H.D., Reynolds, S.P. 1985, ApJ, 293, L73
Asaoka, I., Koyama, K. 1990, PASJ, 42, 625
Bandiera, R., Pacini, F., Salvati, M. 1984, ApJ, 285, 134
Bandiera, R., Pacini, F., Salvati, M. 1996, ApJ, 465, L39
Bandiera, R., Amato, E., Woltjer, L. 1998, Mem.SAIt, 69, 901
Begelman, M.C., Li, Z.-Y. 1982, ApJ, 397, 187
Bietenholz, M.F., Kassim, N., Frail, D.A., Perley, R.A., Erickson, W.C., Hajian, A.R. 1997, ApJ, 490, 291
Cusumano, G., Maccarone, M.C., Mineo, T., Sacco, B., Massaro, E., Bandiera, R., Salvati, M. 1998, A&A, 333, L55
Green, D.A. 1987, MNRAS, 225, L11
Harrus, I.M., Slane, P.O. 1999, ApJ, 516, 811
Harrus, I.M., Hughes, J.P., Slane, P.O. 1998, ApJ, 499, 273
Helfand, D.J., Becker, R.H. 1987, ApJ, 314, 203
Hester, J.J., Scowen, P.A., Sankrit, R., et al. 1995, ApJ, 448, 240
Kardashev, N.S. 1962, Soviet Ast., 6, 217
Kennel, C.F., Coroniti, F.V. 1984a, ApJ, 283, 694
Kennel, C.F., Coroniti, F.V. 1984b, ApJ, 283, 710
Pacini, F., Salvati, M. 1973, ApJ, 186, 249
Rees, M.J., Gunn, J.E. 1974, MNRAS, 167, 1
Reynolds, S.P., Chevalier, R.A. 1984, ApJ, 278, 630
Slane, P., Seward, F.D., Bandiera, R., Torii, K., Tsunemi, H. 1997, ApJ, 485, 221
Slane, P., Bandiera, R., Torii, K. 1998, Mem.SAIt, 69, 945
Sun, M., Wang, Z.-R., Chen, Y. 1999, ApJ, 511, 274
Véron-Cetty, M.P., Woltjer, L. 1991, A&A, 251, L31
Véron-Cetty, M.P., Woltjer, L. 1993, A&A, 270, 370
Weiler, K.W., Panagia, N. 1978, A&A, 70, 419
Woltjer, L., Salvati, M., Pacini, F., Bandiera, R. 1997, A&A, 325, 295