Studies of Mira and semiregular variables using visual databases
Abstract
We use wavelets to investigate period and amplitude changes in Mira and semiregular variables and found a variety of behaviours. Period and amplitude changes often go together, perhaps because changes in amplitude are causing period changes via non-linear effects.
School of Physics, University of Sydney 2006, Australia
UMIST, Department of Physics, Manchester, UK
Wavelet analysis is useful for tracing changes in the periods and amplitudes of long-period variables. We have already published results for the semiregular R Dor, which appears to switch between two modes on a timescale of decades (Bedding et al. 1998). See also the work of Szatmáry, Kiss and coworkers (Kiss et al. 1999 and these Proceedings), and of Andronov (these Proceedings).
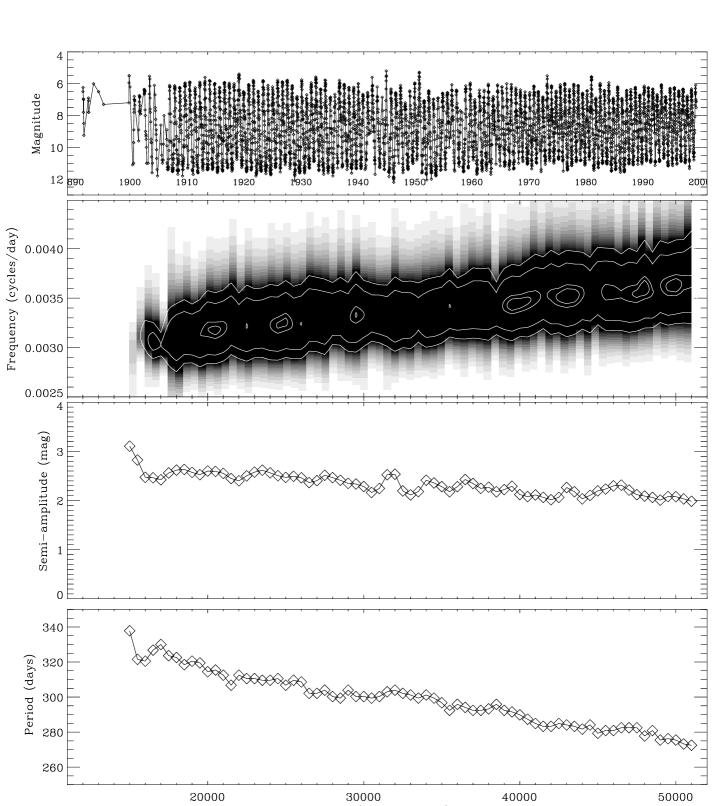
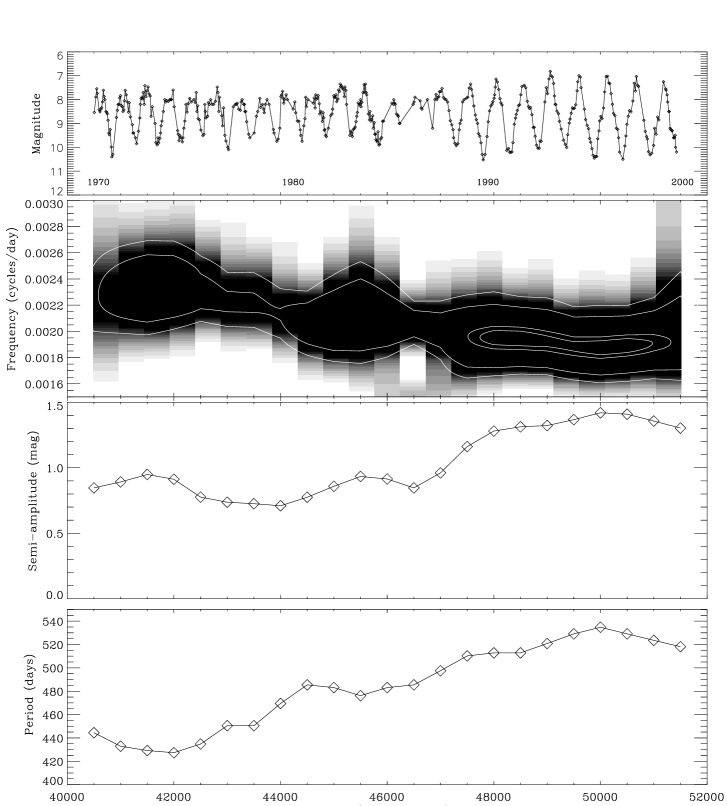
In the case of Miras, a few stars are known to have long-term period trends that may be related to adjustment after a helium-shell flash (Wood & Zarro 1981). A good example is R Aql, which has a gradually decreasing period and, as clear in Fig. 1, a previously unnoticed decrease in amplitude. We find a similar effect in other Miras known to have changing periods, such as W Dra and BH Cru (period and amplitude both increasing) and R Hya and T UMi (periods and amplitudes decreasing). The case of BH Cru is shown in Fig. 2.
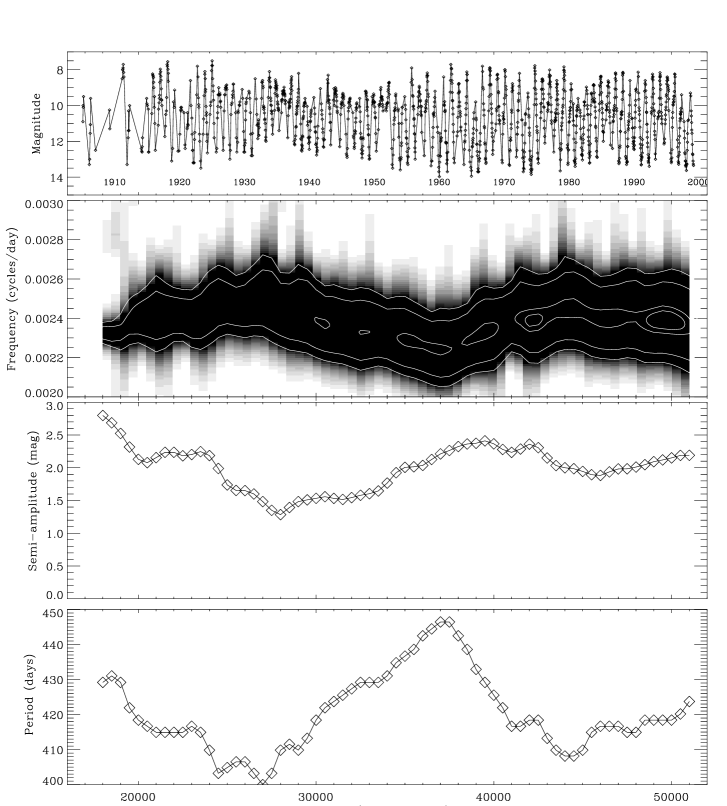
Other stars such as S Ori (Fig. 3) show repeated period changes, but still with matching amplitude changes. We suggest that, at least in some cases, the amplitude changes might cause the period changes via non-linear effects.
Acknowledgments.
We thank the many observers and those who maintain the visual databases of the AAVSO, RASNZ, AFOEV, VSOLJ and BAAVSS.
References
Bateson, F.M., McIntosh, R., Venimore, C.W. 1988, RASNZ PubVSS, 15, 70
Bedding, T. R., Zijlstra, A. A., Jones, A., Foster, G., 1998, MNRAS, 301, 1073
Foster, G., 1996, AJ, 112, 1709
Kiss, L.L., Szatmáry, K., Cadmus Jr., R.R., Mattei, J.A. 1999, A&A, 346, 542
Percy, J.R. & Au, W.W.-Y. 1999, PASP, 111, 98
Walker, W.S.G., Ives, F.V., Williams, H.O. 1995, Southern Stars, 36, 123
Whitelock, P.A., 1998, astro-ph/9801002
Wood, P. R. & Zarro, D. M., 1981, ApJ, 247, 247