The diversity of SCUBA-selected galaxies
Abstract
We present extensive observations of a sample of distant, submillimetre (submm) galaxies detected in the field of the massive cluster lens, Abell 1835, using the Submm Common-User Bolometer Array (SCUBA). Taken in conjunction with earlier observations of other submm-selected sources (Ivison et al. 1998; Smail et al. 1999; Soucail et al. 1999) we now have detailed, multi-wavelength observations of seven examples of the submm population, having exploited the combination of achromatic amplification by cluster lenses and lavish archival datasets. These sources, all clearly at , illustrate the wide range in the radio and optical properties of distant submm-selected galaxies. We include detailed observations of the first candidate ‘pure’ starburst submm galaxy at high redshift, a interacting galaxy which shows no obvious sign of hosting an AGN. The remaining sources have varying degrees of inferred AGN activity (three from seven of the most luminous show some evidence of the presence of an AGN) although even when an AGN is obviously present it is still not apparent if reprocessed radiation from this source dominates the submm emission. In contrast with the variation in the spectral properties, we see relatively homogeneous morphologies for the population, with a large fraction of merging or interacting systems. Our study shows that virtually identical spectral energy distributions are seen for galaxies which exhibit strikingly different optical/UV spectral-line characteristics. We conclude that standard optical/UV spectral classifications are misleading when applied to distant, highly obscured galaxies and that we must seek other means of determining the various contributions to the overall energy budget of submm galaxies and hence to the far-infrared extragalactic background.
keywords:
galaxies: starburst – galaxies: formation – galaxies: individual: SMM J140090252, SMM J140100253, SMM J140100252, SMM J140110252 – cosmology: observations – cosmology: early Universe1 Introduction
Following the commissioning of SCUBA (Holland et al. 1999) on the James Clerk Maxwell Telescope (JCMT) in 1996–97, surveys of the distant Universe have rapidly increased the sample of submm-selected galaxies. The survey on which this paper is based employed massive, intermediate-redshift clusters to magnify submm sources in the distant Universe and yielded a sample of seventeen strongly star-forming, dusty galaxies, mostly at (Smail, Ivison & Blain 1997; Smail et al. 1998a; Barger et al. 1999a; Blain et al. 1999a,b). This population is responsible for the bulk of the mm/submm background detected by COBE (Puget et al. 1996; Fixsen et al. 1998) as discussed by Blain et al. (1999a). Subsequent blank-field surveys have achieved comparable source-plane sensitivities (Barger et al. 1998, 1999b; Hughes et al. 1998; Eales et al. 1999) and have roughly tripled the number of submm-selected galaxies. As a result of these efforts, a broad consensus has already been reached on the surface density of submm galaxies down to the practical confusion limit for detection of 1.5 mJy (Blain, Ivison & Smail 1998).
There are several advantages to mapping the distant submm Universe through massive, well-constrained cluster lenses. The most relevant for this study is that the achromatic nature of the gravitational amplification means that not only is the effective depth of the submm maps increased, but that the counterparts at all other wavelengths are similarly amplified, allowing detailed follow-up observations to be obtained using the current generation of telescopes and instrumentation. A broad variety of follow-up observations are necessary to correctly categorise the submm sources. By obtaining redshifts, constructing complete SEDs, and using other diagnostics, the evolutionary status of the galaxies can be explored and the dominant source of power can be ascertained, be it gravitational (AGN) or stellar (starburst).
The brightest of the sources found so far with SCUBA was also the first to be discovered — SMM J023990136 (Ivison et al. 1998 — I98), a interacting galaxy behind the cluster Abell 370 with an intrinsic luminosity in excess of L⊙. An amplification factor of 2.4 (roughly a magnitude) brought SMM J02399 within reach of spectrographs on 4-m telescopes, and the presence of a dust-enshrouded AGN was immediately inferred from the high-excitation emission lines which dominate its rest-frame UV spectrum. This classification was subsequently confirmed by the characteristics of the radio counterparts seen in deep 5- and 1.4-GHz maps (Ivison et al. 1999; Owen et al., in prep). Despite the presence of an AGN, there is also evidence that significant star-formation activity has taken place and may be continuing. The presence of a large quantity of dust points to past activity, while the strength of the Balmer H emission line suggests a current star-formation rate (SFR) of order 103 M⊙ yr-1. The detection of a massive gas reservoir in this galaxy (Frayer et al. 1998) confirms that such a high SFR could be sustained for a considerable period of time, yrs.
Apart from obscured AGN, the only other components of the submm population so far identified by SCUBA surveys are a class of optically-faint but infrared-bright galaxies with extremely red colours (those with , e.g. Elston, Rieke & Rieke 1988). Brighter than , these galaxies could comprise 10 per cent of the submm population down to fluxes of mJy at 850 m (Smail et al. 1999). The broad spectral properties of this class are consistent with them being the high-redshift analogues of local ultraluminous galaxies (Dey et al. 1999; Smail et al. 1999). Moreover, they may account for 5 per cent or more of the total extragalactic background at all wavelengths, a small but non-negligible fraction.
In this paper, we describe detailed follow-up observations of a sub-sample of submm-selected galaxies discovered in the complete survey of Smail et al. (1998a) which comprised deep submm maps of seven massive clusters, reaching median 1 sensitivities around 0.7 mJy in the source planes. These particular galaxies lie behind the luminous X-ray cluster, Abell 1835, at . Without the amplification due to the cluster, their redshift identification and follow-up would have been challenging even for 10-m telescopes. Aided by the lensing, however, we are able to investigate their optical, infrared (IR) and radio morphologies, putting together spectral energy distributions (SEDs) spanning the rest frame from the Lyman limit to the radio.
The layout of this paper is as follows. First we describe optical, IR, submm and radio measurements of the submm sources (§2) and present the identification of their optical/IR/radio counterparts in §3. In §4 we then discuss their properties in the context of other luminous, dusty galaxies, and speculate on the likely source of power for their prodigious far-IR luminosities. Finally, we discuss the emerging picture of the submm galaxy population and how we can hope to refine our knowledge of these important contributors to the evolution of the co-moving luminosity density of galaxies (§5). We assume and km s-1 Mpc-1 throughout.
2 Observations
2.1 SCUBA and Very Large Array observations
A 23-ks jiggle-map integration of Abell 1835 was taken in outstanding conditions during 1998 January and April with SCUBA on the JCMT, recording data at both 450 and 850 m. The 850-m zenith atmospheric opacity, measured each hour with a skydip, was typically 0.15 and never worse than 0.20. The pointing was checked regularly using the blazar, 1413+135, and was very stable. Calibration maps of Uranus and the unresolved secondary calibrator, CRL 618, were also obtained.
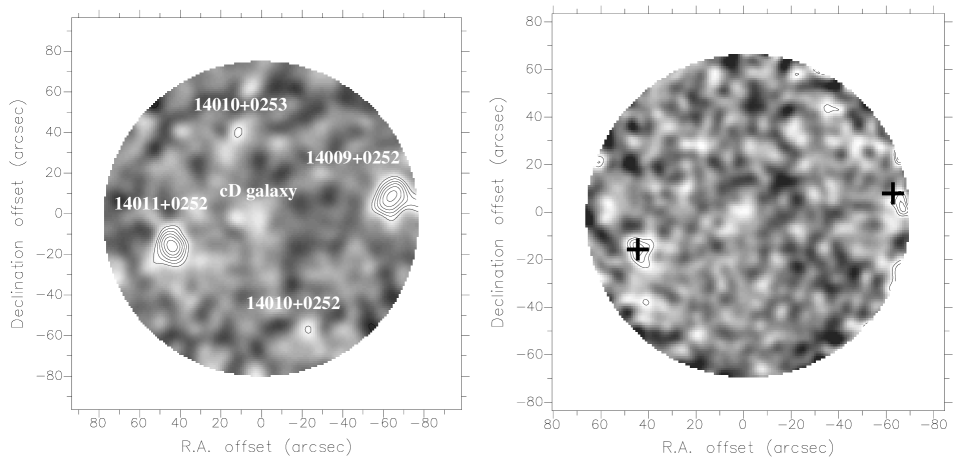
The data were reduced using the surf software package (Jenness & Lightfoot 1998). The rms map sensitivity at 850 m was 1.7 mJy beam-1 and two bright sources were detected (Fig. 1) at a significance of . These sources, SMM J14009+0252 and SMM J14011+0252 (hereafter SMM J14009 and SMM J14011), are discussed later (§3). A conservative estimate of the 1- positional uncertainty is , a value which includes the combined statistical and systematic errors. This is commensurate with the astrometric shifts seen in deep SCUBA images of known submm sources, e.g. HR 10, 4C 41.17, 8C 1435+635 (Ivison et al., in prep) and HDF850.1 (Downes et al. 1999).
SMM J14011 was also detected in the 450-m map (Fig. 1). When smoothed slightly (to 9′′ FWHM), the noise level at 450 m is 6.0 mJy beam-1 and the significance of the SMM J14011 detection is above (above using an aperture-based flux estimate, which is the most reliable method for faint sources at 450 m). The source is coincident with the 850-m position to within the statistical uncertainty of the centroiding on the 850-m beam.
Although the 450- and 850-m maps were obtained simultaneously, the field of view at 450 m is slightly smaller than that at 850 m (see Fig. 1); as a result, SMM J14009 lies close to the edge of the 450-m map. There is a 5- 450-m source ( mJy) south of the 850-m position ( south of the 1.4-GHz position — see later). We view it as likely that this emission is due to SMM J14009: the brightest peak at 450 m undoubtedly exagerates the positional offset; if the 450-m position was taken as the centre of the 3- contour the offset would not be significant.
More observations of these two bright sources were made in 1998 February and 1999 February using the photometry mode of SCUBA. As described by I98, the secondary mirror was chopped, at 7.8 Hz in this instance, using a simple ‘filled-square’ 9-point jiggle with offsets in both the signal and reference beams, with the telescope nodding between the two every 9 s in a signal–reference–reference–signal pattern. The total integration times were: SMM J14011, 1350 m, 5.4 ks; SMM J14009, 1350 m, 2.7 ks; SMM J14009, 450 and 850 m, 2.7 ks. The photometry-mode flux densities agree with those determined from the 450- and 850-m maps.
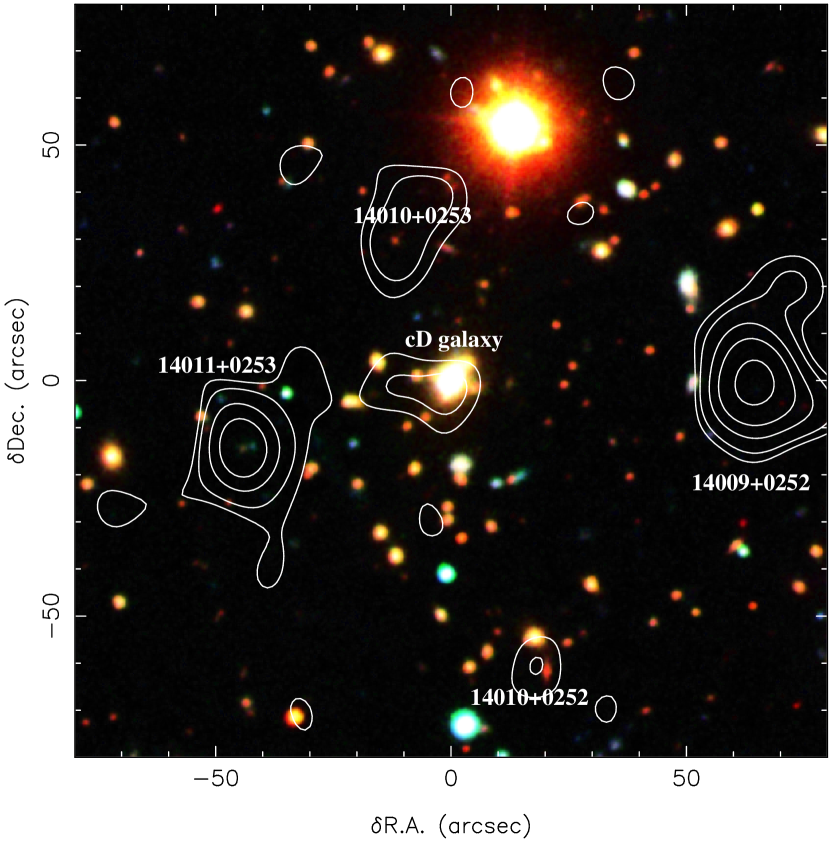
A third submm source was detected in the 850-m maps close to the bright central cluster galaxy in Abell 1835. The offset from the optical position (Fig. 2) was caused by reference signals from the two brightest sources, which overlapped west of the central cluster galaxy whenever the field was observed close to transit, i.e. for a significant fraction of the total integration time. The properties of this galaxy, and the submm-detected central galaxy in the cluster Abell 2390, are presented by Edge et al. (1999). Since we are concerned solely with the field submm galaxy population, we shall not discuss this object again, save to identify it on our wide-field optical, radio and submm images.
Two other faint submm sources are just visible in Figs 1 & 2, to the north (SMM J14010+0253) and south (SMM J14010+0252) of the cluster centre. Both of these sources are fainter than the flux limit of mJy adopted for the Abell 1835 field in Smail et al. (1998a), nominally associated with the 50-per-cent completeness limit. However, as we discuss below there is reason to believe that both sources are reliable detections and that the selection used by Smail et al. (1998a) might be more conservative than claimed. This would result from a combination of the relatively large detection aperture, 30′′ diameter or 2 beam widths, used to construct the original 850-m catalogues (which will reduce the apparent significance of faint point sources) and the variation in the sky noise across the submm maps (the object selection algorithm adopted the rms in the noisiest areas of the map).
Abell 1835 was observed at 1.4 GHz with the National Radio Astronomy Observatory’s (NRAO) Very Large Array (VLA) in B configuration during 1998 April. These observations were part of a survey of all seven clusters in the SCUBA sample and were specifically intended to provide radio detections and accurate positions for any SCUBA sources within the field (Smail et al. 2000). To this end, a very deep 29-ks integration was obtained, a factor two from the deepest 1.4-GHz map ever obtained (Richards 2000). The phase calibrator was 1354021, for which the position is known to within , and the data were calibrated in flux using 1331+305 (3C 286).
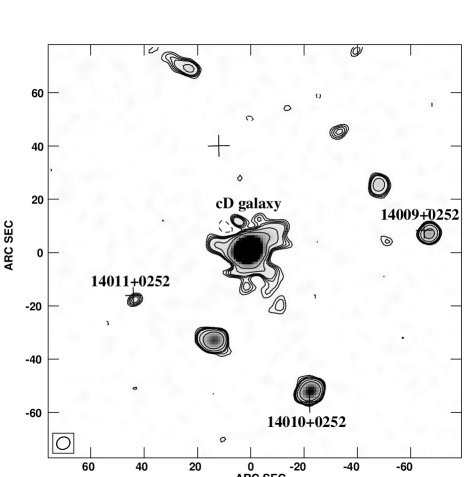
In order to reach sufficiently low noise levels, the process of data acquisition, reduction, self calibration, mapping and cleaning is complex, involving the mapping of several dozen sources throughout the primary beam. This process is discussed in detail by Morrison (1999). The resulting 1.4-GHz map of Abell 1835 (Fig. 3) has a relatively uniform noise level of 16 Jy beam-1, with a synthesized beam measuring FWHM at a position angle (PA) of .
A close comparison of the submm maps with the deep radio map shows that four of the five submm sources have associated radio emission (Fig. 3). The high fraction of radio counterparts to faint submm sources underlines the usefulness of very deep radio maps for identification of submm galaxies (I98; Smail et al. 2000). Ordered in terms of their radio flux, the detected submm sources are the central cluster galaxy; the weak submm source SMM J14010+0252 (with an unresolved radio counterpart north of the nominal submm position) and the two bright submm sources SMM J14009 and SMM J14011, both of which have radio counterparts within 1–2′′. The very faint submm source, SMM J14010+0253, lacks a radio counterpart but an obvious optical counterpart can be seen in Fig. 2, a pair of faint, red galaxies separated by (see §3.3).
2.2 Optical and near-IR imaging
Abell 1835 is one of the most luminous X-ray clusters known, with – ergs s-1 (Allen 1998) and it harbours a massive cooling flow. An archival 2.8-ks ROSAT HRI X-ray image of the cluster exists and we use this to place limits on the X-ray emission from the various submm sources (§4.2). Due to its high X-ray luminosity and hence high central mass, the cluster was included in an optical imaging survey for strongly lensed features (Smail et al. 1998b; Edge et al., in prep) and we exploit those images here.
The data consist of images taken with the COSMIC imaging spectrograph (Kells et al. 1998) on the 5.1-m Hale Telescope (P200) at Palomar Observatory; total integration times were 3.0 ks in , 0.5 ks in and 1.0 ks in , the latter with seeing (Fig. 2). More information is given in Smail et al. (1998b).
Additional optical imaging was acquired on the night of 1998 July 27 at the 4.2-m William Herschel Telescope on La Palma. We used a 1 k2 TEK CCD on the auxilary Cassegrain port giving a pixel scale of pixel-1. A total of three 300-s exposures were obtained in under good conditions. These frames were reduced in a standard manner, flatfielded with twilight flats, aligned and combined. The seeing measured off the final stacked frame is FWHM and this therefore provides a relatively clear view of the rest-frame optical/UV morphology of any distant submm galaxies in the field.
Near-IR observations of this field were obtained to determine the rest-frame optical morphologies and luminosities of the submm galaxies. These observations were undertaken typically under good conditions during several observing runs in 1998 July and 1999 February–April on the 3.8-m UK Infrared Telescope (UKIRT), Mauna Kea, using the IRCAM3 and UFTI cameras (Leggett 1998). The observations used dithered sequences of images (on a 10′′ non-repetitive grid) to allow the science images to be flatfielded using a running median sky frame constructed from the images themselves. The frames were linearised, dark subtracted, flatfielded and combined in a standard manner. The final stacked images were photometrically calibrated using UKIRT Faint Standards (Casali & Hawarden 1992). More details of the observations are given in Table 1.
| Target | Instrument | Date | Band | texp | Seeing |
|---|---|---|---|---|---|
| (ks) | (′′) | ||||
| J1/J2 | IRCAM3 | 98 Jul 11 | 3.2 | ||
| J1/J2 | IRCAM3 | 99 Feb 10 | 7.0 | 0.60 | |
| J3/J4 | IRCAM3 | 99 Feb 08 | 9.2 | 0.75 | |
| J6/J7 | UFTI | 99 Feb 28 | 2.4 | 0.50 | |
| J8 | UFTI | 99 Mar 02 | 2.4 | 0.45 |
2.3 Optical and near-IR spectroscopy
Spectroscopy of the optical counterpart of SMM J14011, J1/J2 (see §3.1), and SMM J14010+0253, J6/J7 (see §3.3), was undertaken with the Low-Resolution Imaging Spectrometer (LRIS) multi-object spectrograph (Oke et al. 1995) on the 10-m Keck-ii telescope, Mauna Kea, during 1998 July 18 and 1999 August 4, as part of the spectroscopic survey of candidate optical counterparts to the submm sources in our sample (Barger et al. 1999). A 300-l mm-1 grating blazed at 5000 Å and a -wide long-slit were used, yielding an effective resolution of about 14 Å and a total wavelength range of 3800–8700 Å. For SMM J14011, the slit was placed along the line joining J1/J2 and J3 (§3.2), at a PA of , and the total exposure time was 3.6 ks. For SMM J14010+0253, the slit was placed along the line joining J6/J7, at a PA of , and the total exposure time was 1.8 ks. The objects were stepped along the slit by 10 arcsec in each direction, and the sky backgrounds were removed using the median of the images to avoid the problems of flat-fielding LRIS data. One-dimensional spectra were optimally extracted. Flux calibration of the spectra was achieved using observations of Oke (1990) standards. Details of the spectroscopic reduction procedures can be found in Cowie et al. (1996).
Near-IR spectra of SMM J14011 and SMM J14010+0253 were obtained with CGS4 on UKIRT during 1998 August 03, 1999 February 09–12 and 1999 April 07–09 during good or moderate conditions. The total exposure time in for SMM J14011 was 2.9 ks during 1998 August 03, 8.2 ks during 1999 February 09 and 19.7 ks during 1999 February 11–12. For SMM J14010+0253, 15.4 and 15.1 ks of exposure time were obtained during 1999 April 07–08 in the and bands, respectively.
The 40-lines mm-1 grating was used to cover the entire or windows. A -long -wide slit was used, orientated to cover both optical components of each source (i.e. PAs of for SMM J14011 and for SMM J14010+0253). During 1999 February 09 and 11–12, a PA of was used for SMM J14011 to cover the major axis of its dominant near-IR component. The data were Nyquist sampled and the telescope was nodded along the slit every 60 or 80 s to allow adequate sky subtraction. Offsets from nearby stars were used to position the slit on the galaxies. Flux calibration and telluric line cancellation were performed by ratioing the spectrum with that of HD 129655 or BS 5275 then multiplying by blackbody spectra appropriate to the temperature and magnitude of those stars. Wavelength calibration is accurate to much better than 0.001 m.
3 Results
We now present the identification of the counterparts of the distant submm galaxies at optical, IR and radio wavelengths. We list the positions and fluxes of the counterparts in the radio, submm, far- and near-IR, optical and X-ray bands in Table 2. For optical and near-IR counterparts, Table 2 gives photometry in -diameter apertures from the seeing-matched images (where available). The reddening towards Abell 1835 is , and no foreground reddening correction has been applied to the results in Table 2. All values are uncorrected for lens amplification (see §4).
3.1 SMM J14011+0252 (J1/J2)
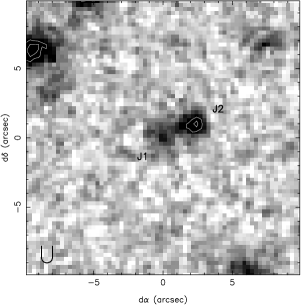
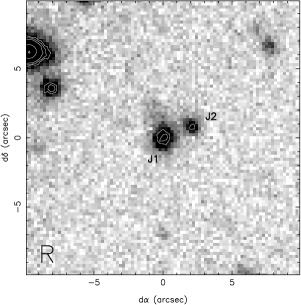
The 1.4-GHz image shown in Fig. 3 clearly shows an unresolved faint source (FWHM ) within of the submm position of SMM J14011. The peak surface brightness is Jy beam-1 and we estimate the total uncertainty in the integrated flux density to be 30 Jy. Using the accurate astrometry from our 1.4-GHz map and our deep Palomar and WHT images (§2.2) we identify two faint optical counterparts to SMM J14011, J1 and J2 (Fig. 4). In our -band image, J1 is only from the nominal radio position, with J1 and J2 separated by at a position angle of 110∘.
The continuum slope in the rest-frame mid-UV (longward of the Lyman limit) for J1 is (, where ) while J2 shows . Using the near-IR broadband photometry (Table 2) we can also estimate the continuum slope into the rest-frame optical where we find spectral indices of and for J1 and J2, virtually identical to those seen for the components of SMM J02399, and significantly redder than typically seen in Lyman-break galaxies (). The -corrected distance modulus at is 47.34 (for a spectral index of ) and so J1 and J2 have a combined absolute magnitude of or .
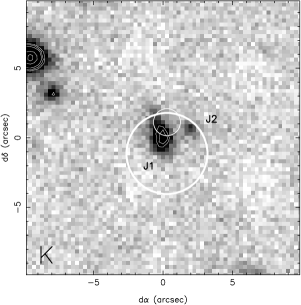
In passbands longward of the band, J1 is brighter than J2 (Fig. 4; Table 2) and well resolved, with an intrinsic FWHM of . The fainter counterpart, J2, shows a more compact morphology, although it too appears to be marginally resolved with a deconvolved FWHM of . J1 exhibits a low-surface-brightness extension stretching to the north, which appears to be somewhat more prominent in than (Fig. 4).
The LRIS spectrum of J1 and J2 shows a number of narrow emission lines and absorption features superimposed on a strong continuum (Fig. 5; Table 3). Using all the features listed in Table 3 we estimate redshifts of for both J1 and J2111This redshift is consistent with limits of and derived respectively from the observed radio–submm spectral index of and the 450- to 850-m flux ratio, . and conclude that they are physically associated. The emission lines are unresolved, with intrinsic line widths of km s-1 in the rest frame. We see no evidence for a broad component of these lines. The continuum shape of J1 and J2 is consistent with the broad-band photometry, with J1 having a substantially redder UV spectral slope (Table 2 and Fig. 5).
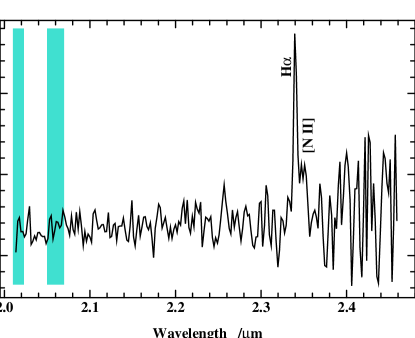
We also see a single narrow line, superimposed on a strong continuum, in the -band spectrum of J1/J2 from UKIRT (Fig. 6). The line is unresolved (290 km s-1 FWHM after deconvolving the 560-km s-1 instrumental resolution) and its wavelength, m, is consistent with Balmer H at , the precise redshift at which Frayer et al. (1999) detected CO– emission. The Ly emission line is thus blueshifted by km s-1 compared to the CO and H emission, the size and sense of shift expected for a UV line affected by outflow absorption. The optical absorption lines are affected by a similar shift. The flux density in the H line is W m-2; that of the [N ii] line, which is seen as a shoulder on the H profile, is W m-2. The H/(H+[N ii]) ratio (0.86) is consistent with values in normal galaxies rather than those dominated by AGN (Kennicutt 1983).

| Line | Comments | |||
| (Å) | (Å) | |||
| J1 | ||||
| Ly | 4330.3 | 1215.7 | 2.562 | Narrow em. line |
| Si ii/O i | 4636.1 | 1302/1304 | 2.558 | Abs. blend |
| C ii | 4760.2 | 1334.5 | 2.567 | Abs. line |
| Si iv | 4962.0 | 1394/1403 | 2.552 | Abs. blend |
| C iv | 5510 | 1549.0 | 2.558 | Broad abs. line |
| H | 23400 | 6563 | 2.565 | Narrow em. line |
| J2 | ||||
| Ly | 4330.3 | 1215.7 | 2.562 | Narrow em. line, |
| abs. 40Å to blue | ||||
| Si ii/O i | 4633.5 | 1302/1304 | 2.556 | Abs. blend |
| C ii | 4745.5 | 1334.5 | 2.556 | Abs. line |
| Si iv | 4958.0 | 1394/1403 | 2.549 | Abs. line |
| C iv | 5508.2 | 1549.0 | 2.556 | Abs. line, |
| em. line in | ||||
| abs. trough? |
1 is the observed wavelength; is the emitted wavelength.
3.2 SMM J14009+0252 (J5)
A bright 1.4-GHz radio source is identified 2.3′′ from the nominal submm position of SMM J14009. Owing to the low surface density of radio sources at these flux limits it is unlikely that this is a chance superposition and so we identify the radio emission as arising from the same source as the submm emission. At 1.4-GHz the radio emission from SMM J14009 is unresolved and relatively strong, with a peak surface brightness of Jy beam-1; deconvolution with the sythesized beam suggests that its intrinsic FWHM cannot exceed .
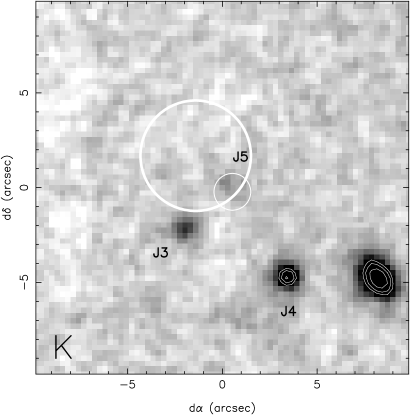
There is no obvious optical counterpart to SMM J14009 at the radio source position in the ground-based imaging, down to apparent magnitudes of or (3). This identification of the source as a ‘blank’ optical field based on the accurate position of the new radio counterpart differs from that given by Smail et al. (1998a) who, working from the low-resolution submm maps, identified a ‘possible’ faint counterpart (J3) to SMM J14009 on the ground-based -band image with a 15 per cent likelihood of this being a chance coincidence222Another galaxy, J4, still further from the submm position, was labelled in finders for the spectroscopic survey of Barger et al. (1999). In , J4 is at , Dec. (J2000); in apertures, it has magnitudes of , , and .. However, using the 1.4-GHz map (§2.1) we are able to rule out the proposed optical counterparts and instead categorise the source as an optically blank field.
In our deep image of SMM J14009 (Fig. 7), the galaxy identified optically by Smail et al. (1998a), J3, is visible ( in a aperture) from the position of the 1.4-GHz source and from the nominal position of the 850-m source. The excellent positional accuracy afforded by the radio map makes such large positional offsets unlikely, and so we rule out J3 as the origin of the radio and submm emission (although see later). A faint source, J5, is visible in the image but not in the optical images (Fig. 7, Table 2). J5 is a far more likely counterpart for SMM J14009, being only and from the nominal positions of the 1.4-GHz and 850-m sources respectively ( from J3 at PA 145∘).
While we do not believe J3 is the source of the submm emission, we do not rule out a connection between J3 and J5. Indeed, such a relationship might be expected if an interaction between J3 and J5 triggered the submm emission seen in the latter. Such a hypothesis is a natural consequence of the statistics of merging and interacting systems in the submm population seen by Smail et al. (1998a). Given the faintness of J5, spectroscopic observations will be difficult, and so studying a less-obscured possible companion (J3) may provide valuable information on the redshift of J5. Current spectroscopic limits on J3 suggest it lies somewhere in the redshift range, – (Barger et al. 1999b).
To try to constrain the likely redshift of J5 we turn to the long-wavelength spectral properties of the source. The radio–submm spectral index, , (Carilli & Yun 1999; Blain 1999) is and indicates a likely redshift range of (Smail et al. 2000), matching the current limits on the redshift of J3. However, any contribution in the radio from an AGN would significantly raise the upper bound (see §4.2.3). The 450- to 850-m flux ratio has also been used to make coarse redshift estimates (Hughes et al. 1998): J5 has a ratio of and this suggests . The faint near-IR magnitude of J5 also favours a high redshift unless the source is extremely obscured. Comparing this galaxy to the well-studied ERO, HR 10 at (Graham & Dey 1996; Cimatti et al. 1998; Dey et al. 1999), we see that J5 is three times more luminous in the submm, yet is more than 10 times fainter in . Placing J5 at the same low redshift as HR10 would require that the galaxy suffered substantially more extinction at rest-frame wavelengths of m than HR10, which is already a highly-obscured and very red galaxy. For this reason, we believe that this source is probably more distant than HR 10 and that the low estimate may reflect some contribution in the radio from an AGN. Finally, comparing the SED of SMM J14009 (see §4) with other submm-bright galaxies suggests that .
The -corrected distance modulus at for is 48.65 for a spectral index similar to those of SMM J02399 and SMM J14011, so J5 would have a -corrected absolute magnitude of , only fainter than that of J1 and quite plausible given the large range of UV–IR colours exhibited by the submm galaxy population (Smail et al. 1999).
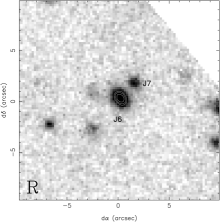
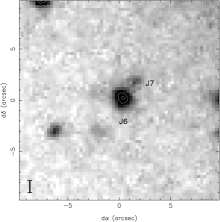
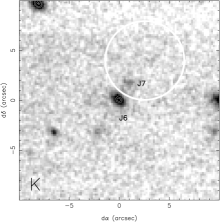
3.3 SMM J14010+0253 (J6/J7)
The position of SMM J14010+0253 is devoid of radio emission in our 1.4-GHz map, and so we must rely on the submm position to identify the optical counterpart. The absence of radio emission allows us to constrain the source to lie at from the observed radio–submm spectral index of . Inspecting Fig. 8, there is an obvious candidate counterpart in the compact galaxy J6 ( FWHM) along with a fainter companion system, J7, away.
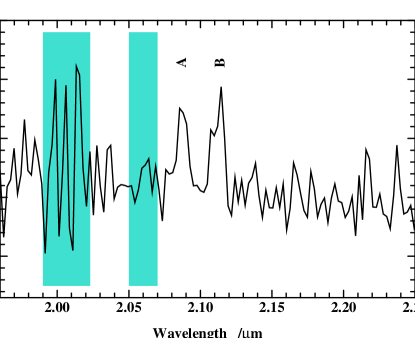
To test the identification of J6/J7 as the submm source we obtained optical and near-IR spectra. Our optical spectrum shows several features, including redshifted C iv] 1549Å with a P Cygni absorption wing, and gives a redshift of for the source (Fig. 9). While J6 dominates the optical continuum emission (Fig. 8), the emission line is extended along the slit suggesting that J7 is at the same redshift as J6.
The near-IR spectrum appears to show relatively weak line features in the -band window at 2.088 and 2.113 m (labelled A and B in Fig. 9). These features appear in both the positive and negative versions of the spectrum and are thus likely to be real. They are not offset significantly along the spatial axis. There are several plausible identifications for the lines, including [O iii] 4959, 5007Å at , but there is no sign of the [O ii] 3727Å line in our deep -band spectrum (nor of any other lines) which argues against . The redshift obtained from the optical spectrum suggests that at least one of these lines is likely to be Balmer H; indeed, the 2.113-m feature is consistent with Balmer H at the optical redshift, . This would imply a rest-frame wavelength of 6484Å for the 2.088-m line if it is associated with the same object, or it could be another star-forming galaxy close to the line of sight at .
3.4 SMM J14010+0252 (J8)
With the exception of the central cluster galaxy discussed by Edge et al. (1999), SMM J14010+0252 is the brightest 1.4-GHz source in the Abell 1835 region, with a flux density of mJy. This radio emission is unresolved in our VLA map. Taking this flux, we estimate a radio–submm spectral index of for SMM J14010+0252, corresponding to a predicted redshift range of (Carilli & Yun 1999).
Fig. 2 shows two possible bright counterparts for the weak submm emission: a bright red, early-type galaxy to the north (J8, which is closer to the radio position, and because of its colours is possibly a cluster member or a low-redshift field galaxy at ), with a faint companion in its halo; and a fainter, redder galaxy to the south which appears to be an edge-on S0–Sa galaxy in our high-resolution -band image. We suggest that J8 is the likely source of the submm and radio emission and further suggest on the basis of both its colours and its radio–submm spectral index that this is most likely to be a cluster galaxy.
4 Discussion
Abell 1835 was included in our SCUBA survey because of its extreme X-ray luminosity and the presence of strongly lensed features in deep ground-based images (Smail et al. 1998b). These lensed features have enabled the construction of a mass model of the core of the cluster (see Blain et al. 1999a), which can be used to robustly correct the fluxes of any background sources for lens amplification. Until this point, no quoted observational quantities (e.g. Table 2) have been corrected for the effects of gravitational lensing; from here, however, we will correct all derived physical quantities, e.g. , for amplification by the cluster lens.

Using our lens model we estimate amplifications (, in flux) of the various sources as: SMM J14011 at , ; SMM J14009 assuming –, ; SMM J14010+0253 at , , where the upper bound is set by the lack of an optical counter-image; and no amplification of SMM J14010+0252, assuming it lies in the cluster. These amplifications are predominantly due to tangential shearing of the images, around the centre of the lens at the cD galaxy, and so the spatial resolution of the source is finer in the tangential direction as compared with that in the radial direction. For example, for SMM J14011 at , an angular scale of corresponds to 7.7 kpc in the radial direction, but to only 2.6 kpc in the tangential direction.
De-amplifying the submm sources, we estimate intrinsic 850-m fluxes of 4.9, 10.4, 0.9 and 4.2 mJy for SMM J14011, SMM J14009, SMM J14010+0253 and SMM J14010+0252, respectively. Note that SMM J14010+0253 is therefore one of the faintest submm sources detected, and the only known representative of the mJy-level submm population which dominates the submm background (Blain et al. 1999a).
4.1 Morphologies
The optical and near-IR morphologies of the counterparts to the submm sources appear compact, but not unresolved, with seeing-corrected FWHM in the 0.5–1.0′′ range, corresponding to scales of 2–4 kpc taking the lens amplification into account. There is therefore good evidence for the submm emission coming from relatively large galaxies with extended rest-frame optical emission, galaxies not dominated by a central point source in the rest-frame UV/optical.
The morphological feature linking two of the sources, SMM J14011 and SMM J14010+0253, is the presence of pairs of optical counterparts, separated by 2′′ ( kpc in the source plane). In both cases the available spectroscopy suggests that these pairs are physically associated. The fainter component of the pairs have rest-frame -band luminosities about 20–30 per cent of the primary and may thus represent dynamically important components within the systems, although it is important to note that that in the optical/near-IR we do not appear to see mergers of equal luminosity (mass?) components. These two systems are strikingly similar to the brightest submm source in our survey, SMM J02399 at (I98), which also comprises two components, separated by 9 kpc. The morphological similarity even stretches to the presence of faint, extended emission ‘plumes’ around all three pairs, perhaps associated with line-emitting nebulae. This provides further support for a large fraction of interacting systems in the distant submm population (Smail et al. 1998a). The similarly large proportion of interactions and mergers seen in the local ULIRG population (Sanders & Mirabel 1996) argues for the same physical mechanism, gravitational interaction, triggering the activity in both the distant submm population and local ULIRGs.
The comparable separations of all three pairs suggests that these merging systems have very great far-IR luminosities when the components are relatively widely separated, with projected distances of 5–10 kpc. This contrasts with the situation in local ULIRGs, which are typically most luminous when the two merging components are only 1–2 kpc apart, with a tail of sources with wider separations out to kpc (Murphy et al. 1996). To increase the luminosity of the system at an earlier stage of the merger, more gas must be moved into the central regions of the galaxies through bar instabilities (Mihos & Hernquist 1996; Bekki, Shioya & Tanaka 1999). Massive stellar bulges in galaxies suppress bar formation in their disks, and so our results may suggest that while optically luminous, these submm-selected merging galaxies do not possess large bulges, in contrast to the progenitors of local ULIRGs.
4.2 Probes of buried AGN
4.2.1 X-ray emission
An obvious test of the presence of an AGN in the submm sources is to search for hard X-ray emission. We find no evidence of soft X-ray emission at the level of –2 keV erg s-1 (Table 2) from any of the distant submm sources in this field in the shallow ROSAT 0.1–2 keV X-ray image. While this allows us to rule out the presence of relatively unobscured AGN in these sources (Gunn et al. 2000, in prep), it will require forthcoming hard X-ray missions such as Chandra and XMM to place stronger limits on the presence of highly-obscured AGN in these galaxies (Almaini, Lawrence & Boyle 1999; Gunn & Shanks 1999). The sensitivity of XMM to hard X-ray emission will be extremely useful in this regard; however, the observational key may prove to be the higher spatial resolution of Chandra, which will be essential to remove background emission from the extended X-ray-bright cluster.
4.2.2 Optical/near-IR spectra
It is remarkable that galaxies such as SMM J14011 and SMM J02399, with similar morphologies and broad-band spectral properties and gas masses suggestive of proto-ellipticals (Frayer et al. 1998, 1999), should have such different emission- and absorption-line characteristics.
Where the spectrum of SMM J02399 shows high-excitation emission lines typical of a type-ii AGN, the optical and near-IR spectra presented in §3 for SMM J14011 (J1/J2) and SMM J14010+0253 (J6/J7) provide no evidence that their far-IR luminosities are powered by AGN. For J1/J2 we see the typical rest-frame UV spectrum of a starburst – absorption features and a narrow Ly emission line. In the rest-frame optical, the H/(H+[N ii]) ratio is consistent with values observed in normal galaxies, and the H profile shows no sign of an underlying broad-line component (often proposed as a probe of buried AGN, although see §4.4). For J6/J7, the optical/IR spectra are also reminiscent of a starburst and we see several absorption lines common to SMM J14011 (J1/J2), e.g. Al ii and C iv.
4.2.3 Mid-IR spectra
The mid-IR fluxes expected for SMM J14009 and SMM 14011 (Fig. 10) are around 1—10 mJy at 25 m. Detections at this level are achievable with Michelle, the mid-IR imaging spectrograph soon to be delivererd to UKIRT. Future observations of these sources with Michelle, on UKIRT and Gemini, will determine the amount of warm dust emission from these galaxies, another possible diagnostic/probe of the presence of an AGN power source.
4.2.4 Radio emission
The radio properties of the submm-selected galaxy population have been discussed by Smail et al. (2000). Half of the fifteen lensed submm-selected galaxies in the sample used by Smail et al. were detected at 1.4 GHz, and of those, only three were bright enough to have been identified by wide-field radio surveys such as NVSS and FIRST (Condon et al. 1998; Becker, White & Helfand 1995) — SMM J023990134, SMM J02399 and SMM J14009. The remaining detections were at the Jy level, and are thus consistent with the absence of radio-loud AGN.
At , the 1.4-GHz flux from SMM J14009 would give a rest-frame power of W Hz-1 sr-1 at 7 GHz, greater than that of SMM J02399, an order of magnitude greater than that of SMM J14011, and unheard of amongst low-redshift star-forming galaxies (Mobasher et al. 1999). However, it is still more than an order of magnitude less than that of known radio galaxies (e.g. van Breugel et al. 1999). If SMM J14009 lies at then the requirement for AGN-powered radio emission to explain the SED is eased, and for the radio emission becomes consistent with a pure starburst. However, we have already argued that such a low redshift is unlikely (§3.2). We conclude that the radio emission from SMM J14009 includes a contribution from an AGN.
For SMM J02399 – an interaction/merger in which one component is known to harbour an AGN from its optical spectrum – the rest-frame power at 5.3-GHz is W Hz-1 sr-1 (Ivison et al. 1998), which is extremely rare amongst star-forming galaxies, although the far-IR luminosity of SMM J02399 is phenomenal ( L⊙), and so one would therefore expect even its purely starburst-driven radio luminosity to be similarly extreme. Indeed, the observed 1.4–8.5 GHz spectral index is in agreement with optically thin synchrotron emission (Ivison et al. 1999), and the radio–submm spectral index is consistent with the spectroscopic redshift () based on the usual far-IR/radio correlation for starbursts (Carilli & Yun 1999). The 1.4-GHz morphology is also consistent with contributions from both of the optical/near-IR components (Owen et al., in prep). It is not possible to rule out an AGN contribution to the radio power of this galaxy, although it seems unlikely that an AGN provides the sole contribution.
The only other submm-selected galaxy where the presence of an AGN cannot be disputed is SMM J023990134, a Seyfert-2 ring galaxy (Soucail et al. 1999). However, its radio luminosity and radio–submm spectral index are both consistent with a pure starburst at the spectroscopic redshift (), and so the radio emission is not a useful AGN diagnostic in this case.
The 1.4-GHz flux from SMM J14011 translates into a rest-frame power at 5.0 GHz of W Hz-1 sr-1 which is reasonable, if rare, for a star-forming galaxy (Mobasher et al. 1999). The radio–submm spectral index is consistent with the known redshift, and again there is no evidence to support an AGN contribution.
Interestingly, the lesson from the radio seems to be that 1.4-GHz observations are not necessarily a good test of the presence of an AGN in submm-selected galaxies, though they are clearly very helpful when pinpointing counterparts and constraining redshifts. Even for SMM J14009, the presence of a buried AGN cannot be inferred from the radio data alone, at least not at resolution.
In summary, the existing ROSAT X-ray imaging and optical/near-IR spectroscopy of sources in this field indicate that they do not contain unobscured AGN. However, it is difficult to place limits on the presence of obscured AGN at present, in the absence of mid-IR and hard X-ray images.
4.3 SEDs
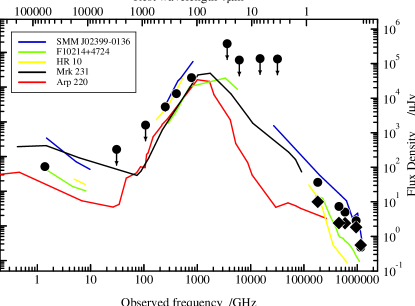
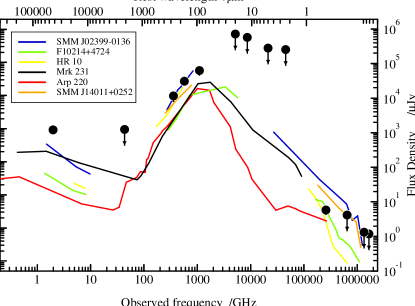
In Fig. 10 we plot the rest-frame UV—radio SED of SMM J14011 and SMM J14009 (assuming ), deduced from our observations and corrected for amplification by the cluster lens. For SMM J14011 at rest-frame wavelengths longer than about 1 m, this is effectively the SED of both J1 and J2. We have also included upper limits from the IRAS All-Sky Survey at 12, 25, 60 and 100 m (Table 2). The SEDs are poorly constrained at wavelengths between about 1 and 100 m. At the longer wavelengths observed by SCUBA, we find for SMM J14011 across the rest-frame wavelength range 130–380 m, marginally consistent with the characteristic spectral index, , of optically-thin emission from dust grains. For SMM J14009, the observed far-IR SED is a little steeper, with between 1350 and 850 m, flattening to between 850 and 450 m.
Simple fits to these SEDs cannot, of course, constrain the dust temperature, although the data for both sources are consistent with the range of 35–50 k found for other dusty, high-redshift galaxies (I98; Benford et al. 1999; see also Dunne et al. 2000). Higher temperatures can be fitted if the opacity of the dust becomes significant at wavelengths of about 100–200 m. Adopting for the standard dust emission parameter in order to facilitate comparisons with other distant objects, where is the rest-frame wavelength, we estimate a dust mass of M⊙ for SMM J14011 if k. For SMM J14009, taking k, the dust masses implied by the submm emission for would be in the range M⊙, midway between the values derived using the same assumptions for SMM J14011 and SMM J02399.
The luminosity of SMM J14011 in the far-IR waveband between observed wavelengths of 20 and 1000 m, , is about L⊙, although there remains a large uncertainty due to the unconstrained mid-IR spectrum. If we continue to assume that , then the luminosity of SMM J14009 in the far-IR waveband, , will be at least L⊙. SMM J14010+0253, with an intrinsic submm flux of about 1 mJy, has a relatively low far-IR luminosity by the standards of other distant submm-selected galaxies, about L⊙. Therefore while both SMM J14009 and SMM J14011 class as high-redshift ultraluminous or hyperluminous IR galaxies (ULIRG/HLIRG), SMM J14010+0253 is one of the first luminous IR galaxies (LIRG) identified at high redshift.
For SMM J14010+0252, assuming it is a cluster member with a close companion, we derive a dust mass of about M⊙ (for 50-k dust) and a modest far-IR luminosity of L⊙.
The SEDs of several other luminous far-IR galaxies are also shown in Fig. 10. Comparing the far-IR luminosities of SMM J14011 and SMM J14009 with that of SMM J02399 (I98), we see that SMM J14011 is about 25 per cent less luminous, lying somewhere between the luminosity of SMM J02399 and F10214+4724 (Rowan-Robinson et al. 1993), while at the luminosity of SMM J14009 would be comparable to that of SMM J02399. Overall luminosities aside, however, the three submm-selected galaxies SMM J14011, SMM J14009 and SMM J02399 have very similar SEDs. The only significant difference occurs in the radio waveband. SMM J14011 is somewhat less luminous and SMM J14009 is slightly more luminous than SMM J02399. We interpret this sequence as arising from an increasing contribution from an active nucleus in SMM J14011, SMM J02399 and SMM J14009 respectively. However, apart from a weak contribution in the radio, this change makes little overall difference to the SEDs of the sources.
4.4 SFRs
We have three independent estimates of SFR in these submm sources: their luminosities in the far-IR, radio or H line (we disregard estimates based on the rest-frame UV flux due to difficulties of dealing with obscuration in these dusty systems).
If the dust in these sources is heated primarily by young, massive stars, then L⊙ corresponds to a formation rate of 650 M⊙ yr-1 adopting a Salpeter initial mass function (IMF) extending from 0.1 to 100 M⊙ (Thronson & Telesco 1986). However, it has been suggested by Zepf & Silk (1996) and Bromm, Coppi & Larson (2000), amongst others, that the IMF in proto-ellipticals may be top-heavy, and so the same L⊙ could be produced just from O, B and A stars with a SFR of about M⊙ yr-1. In the absence of a significant non-thermal radiation source, this factor of three range in the estimated SFRs provides a reasonable indication of the level of uncertainty in this calculation. Hence for the far-IR luminosities of SMM J14011 ( L⊙), SMM J14009 ( L⊙), SMM J14010+0252 ( L⊙) and SMM J14010+0253 ( L⊙), we estimate corresponding SFRs in the range 1260–3900, 2100–6500, 105–325 and 60–195 M⊙ yr-1, respectively. These rates are substantial and if sustained for –109 yrs would be capable of forming the bulk of a luminous, L∗, galaxy. The energy input into the interstellar medium of the galaxy from such a burst of star formation would probably be sufficient to trigger a galactic wind and so the mechanism may be self-regulating.
The 1.4-GHz radio emission from SMM J14011 is consistent with an SFR of order 650 M⊙ yr-1, for stars M⊙ (Condon 1992), within a factor of two of our far-IR-based estimate for high-mass stars. The H luminosity of SMM J14011 (J1/J2), W (after correcting for lensing) yields a much lower SFR, in the range 35–350 M⊙ yr-1 (Kennicutt 1983; Hill et al. 1994; Gallego et al. 1995; Barbaro & Poggianti 1997). This is also consistent with the findings of Cram et al. (1998), who showed that H-based estimates appeared to severely underestimate the SFR in intensely star-forming galaxies. One plausible explanation is that there may be significant extinction due to dust even at rest-frame wavelengths of 6600Å. A value of in the range would account for the depression of the apparent H luminosity. If correct, this suggests that searching for broad components to H in these dusty galaxies may not be a particularly useful probe of buried AGN.
At , the radio flux from SMM J14009 would indicate a high-mass SFR more than an order of magnitude higher than that suggested by the far-IR luminosity. We believe this is probably due to a dominant AGN contribution to the radio luminosity (§4.2.3). With no spectroscopic observations there is no limit on H for this galaxy.
The H luminosity of SMM J14010+0253 (J6/J7), taking only the line at 2.113 m (Fig. 9) is similar to that of J1/J2: W, and so the implied SFR is also similar – 30–300 M⊙ yr-1. This brackets the values deduced from the far-IR luminosity of SMM J14010+0253, leaving little room for additional reddening at the wavelength of H.
5 Conclusions
We have presented the results of observations of three submm-selected galaxies seen through the rich cluster lens, Abell 1835, and two others which probably lie within the cluster.
The presence of large amounts of dust in these systems indicates that substantial past/current star formation has/is taking place, while the large reservoirs of gas seen in those systems studied in CO (e.g. Frayer et al. 1999) show that they contain sufficient fuel to continue star formation at this level for 1 Gyr. In the process, they would form a mass of stars typical of a luminous galaxy, 1011– M⊙. The apparently high SFRs, high dust/metal content and large gas masses are all requirements of massive proto-elliptical galaxies. The identification of the formation of massive ellipticals in single, intense events at relatively high redshifts may be difficult to achieve within present semi-analytic galaxy-formation models (Baugh et al. 1998) unless these systems inhabit high-density regions in the early Universe. Further study of the environments of distant submm galaxies may be a fruitful avenue to more fully understand the nature and subsequent evolution of these galaxies.
We now have detailed information on the presence or absence of AGN in seven submm-selected galaxies from our survey: SMM J023990136 (type ii, I98), SMM J023990134 (type ii, Soucail et al. 1999), SMM J04433+0210 and SMM J09429+4658 (no evidence for or against an AGN in either of these; Smail et al. 1999), SMM J14009+0252 (probable AGN, type unknown), SMM J14010+0253 (starburst) and SMM J14011+0252 (starburst).
Thus there is evidence of one form or another for AGN contributions to the far-IR luminosities of three of the seven submm-selected galaxies for which detailed observations have been acquired. The sample should not be biased strongly towards AGN by strong emission lines, since we include all objects for which detailed observational follow-up exists, not limiting ourselves to those with spectroscopic redshifts. An observational bias towards the brightest galaxies in the Smail et al. (1998a) sample has been largely avoided since the observational follow-up has followed the seasons and has not concentrated on the brightest sources. This high rate of AGN activity is roughly consistent with that seen in similarly luminous local samples of ULIRGs (Sanders & Mirabel 1996).
The growing number of pairs of galaxies spectroscopically identified as counterparts to submm sources supports our earlier suggestion (Smail et al. 1998a) that merging is the mechanism triggering the activity in the submm galaxy population, also in line with what is known of local ULIRGs.
Finally, we highlight SMMMJ14011, the first submm source in which detailed observations have not uncovered an AGN. The inferred SFR is several 1000 M⊙ yr-1, and so we are faced with what appears to be a proto-elliptical galaxy processing M⊙ of molecular gas into stars on a timescale of less than 1 Gyr. High-resolution imaging in hard X-rays with Chandra (rest-frame 10–40 keV) should be able to identify any AGN that is present but currently undetected, even a Compton-thick AGN. If this source – an incontravertibly starburst judging by data obtained in the optical, near-IR and radio wavebands – contains a buried AGN, then there is a good chance that a large fraction of the bright submm galaxy population also contains AGN.
ACKNOWLEDGEMENTS
UKIRT is operated by the Joint Astronomy Centre (JAC) on behalf of the United Kingdom Particle Physics and Astronomy Research Council (PPARC). The JCMT is operated by the JAC on behalf of PPARC, the Netherlands Organisation for Scientific Research, and the National Research Council of Canada. NRAO is operated by Associated Universities Inc., under a cooperative agreement with the National Science Foundation. RJI, AWB and IRS acknowledge support from PPARC, the Raymond and Beverly Sackler Foundation and the Royal Society. We acknowledge useful conversations and help from Walter Gear, Tom Geballe, Katherine Gunn, Chris Mihos and Ian Robson.
References
- [1] Allen S.W., 1998, MNRAS, 296, 392
- [2] Almaini O., Lawrence A., Boyle B.J., 1999, MNRAS, 305, L59
- [3] Barbaro G., Poggianti B.M., 1997, A&A, 324, 490
- [4] Barger A.J. et al., 1998, Nature, 394, 248
- [5] Barger A.J., Cowie L.L., Smail I., Ivison R.J., Blain A.W., Kneib J.-P., 1999a, AJ, 117, 2656
- [6] Barger A.J., Cowie L.L., Sanders D.B., 1999b, ApJ, 518, L5
- [7] Barvainis R., Antonucci R., Hurt T., Coleman P., Reuter H.-P., 1995, ApJ, 451, L9
- [8] Baugh C.M., Cole S., Frenk C.S., Lacey C.G., 1998, ApJ, 498, 504
- [9] Becker R.H., White R.L., Helfand D.J., 1995, ApJ, 450, 559
- [10] Bekki K., Shioya Y., Tanaka I., 1999, ApJ, 520, L99
- [11] Benford D.J., Cox P., Omont A., Phillips T.G., McMahon R.G., 1999, ApJ, 518, 65
- [12] Blain A.W., Ivison R.J., Smail I., 1998, MNRAS, 296, L29
- [13] Blain A.W., 1999, MNRAS, in press (astro-ph/9906438)
- [14] Blain A.W., Kneib J.-P., Ivison R.J., Smail I., 1999a, ApJ, 512, L87
- [15] Blain A.W., Smail I., Ivison R.J., Kneib J.-P., 1999b, MNRAS, 302, 632
- [16] Broadhurst T., Lehár J., 1995, ApJ, 450, L41
- [17] Bromm V., Coppi P.S., Larson R.B., 2000, ApJ, in press (astro-ph/9910224)
- [18] Carilli C.L., Yun M.S., 1999, ApJ, 513, L13
-
[19]
Casali M.M., Hawarden T.G., 1992, UKIRT manual
http://www.jach.hawaii.edu/UKIRT/astronomy/
calib/faint_stds.html - [20] Cimatti A., Andreani P., Röttgering H., Tilanus R., 1998, Nature, 392, 895
- [21] Condon J.J., 1992, ARA&A, 30, 575
- [22] Condon J.J., Cotton W.D., Greisen E.W., Yin Q.F., Perley R.A., Taylor G.B., Broderick J.J., 1998, AJ, 115, 1693
- [23] Cooray A.R, Grego L., Holzapfel W.L., Joy M., Carlstrom J.E., 1998, AJ, 115, 1388
- [24] Cowie L.L., Songaila A., Hu E.M., Cohen J.G., 1996, AJ, 112, 839
- [25] Cram L., Hopkins A., Mobasher B., Rowan-Robinson M., 1998, ApJ, 507, 155
- [26] Dey A., Graham J.R., Ivison R.J., Smail I., Wright G.S., Liu M., 1999, ApJ, 519, 610
- [27] Downes D. et al., 1999, A&A, 347, 809
- [28] Dunne L., Eales S.A., Edmunds M.G., Ivison R.J., Alexander P., Clements D., 2000, MNRAS, submitted
- [29] Eales S.A, Lilly S.J., Gear W.K., Dunne L., Bond J.R., Hammer F., Le Fèvre O., Crampton D., 1999, ApJ, 515, 518
- [30] Edge A.C., Ivison R.J., Smail I., Blain A.W., Kneib J.-P., 1999, MNRAS, 306, 599
- [31] Elston R., Rieke G.H., Rieke M.J., 1988, ApJ, 331, L77
- [32] Fixsen D.J., Dwek E., Mather J.C., Bennett C.L., Shafer R.A., 1998, ApJ, 508, 123
- [33] Frayer D.T., Ivison R.J., Scoville N.Z., Evans A.S., Yun M., Smail I., Blain A.W., Kneib J.-P., 1998, ApJ, 506, L7
- [34] Frayer D.T., Ivison R.J., Scoville N.Z., Evans A.S., Yun M., Smail I., Barger A.J., Blain A.W., Kneib J.-P., 1999, ApJ, 514, L13
- [35] Galego J., Zamamoro J., Aragón-Salamanca A., Rego M., 1995, ApJ, 455, L1
- [36] Graham J.R., Dey A., 1996, ApJ, 471, 720
- [37] Gunn K.F., Shanks T., 1999, MNRAS, submitted
- [38] Hill R.S., Home A.T., Smith A.M., Bruhweiler F.C., Cheng K.P., Hintzen P.M.N., Oliverson R.J., 1994, ApJ, 430, 568
- [39] Holland W.S. et al., 1999, MNRAS, 303, 659
- [40] Hughes D.H. et al., 1998, Nature, 394, 241
- [41] Ivison R.J., Smail I., Le Borgne J.-F., Blain A.W., Kneib J.-P., Bézecourt J., Kerr T.H., Davies J.K., 1998, MNRAS, 298, 583 (I98)
- [42] Ivison R.J., Smail I., Blain A.W., Kneib J.-P., 1999, in ‘Ultraluminous galaxies: monsters or babies?’, Kluwer, Dordrecht, in press (astro-ph/9901361)
- [43] Jenness T., Lightfoot J.F., 1998, in ‘Astronomical Data Analysis Software and Systems VII’, Albrecht R., Hook R.N., Bushouse H.A., eds, ASP Conf. Ser. 145, 216
- [44] Kells W., Dressler A. Sivaramakrishnan A., Carr D., Koch E., Epps H., Hilyard D., Paradeilhan G., 1998, PASP, 110, 1487
- [45] Kennicutt R.C. Jr, 1983, ApJ, 272, 54
-
[46]
Leggett S.K., 1998, UKIRT manual
http://www.jach.hawaii.edu/UKIRT.new/instruments/
ufti/ufti.html - [47] Mihos J.C., Hernquist L., 1996, ApJ, 464, 641
- [48] Mobasher B., Cram L., Georgakakis A., Hopkins A., 1999, MNRAS, 308, 45
- [49] Murphy T.W., et al., 1996, AJ, 111, 1025
- [50] Oke J.B., 1990, AJ, 99, 1621
- [51] Oke J.B. et al., 1995, PASP, 107, 375
- [52] Puget J.-L., Abergel A., Bernard J.-P., Boulanger F., Burton W.B., Désert F.-X., Hartmann D., 1996, A&A, 308, L5
- [53] Richards E.A., 2000, ApJ, in press (astro-ph/9908313)
- [54] Rowan-Robinson M. et al., 1993, MNRAS, 261, 513
- [55] Sanders D.B., Mirabel I.F., 1996, ARA&A, 34, 749
- [56] Smail I., Ivison R.J., Blain A.W., 1997, ApJ, 490, L5
- [57] Smail I., Edge A.C., Ellis R.S., Blandford R.D., 1998b, MNRAS, 293, 124
- [58] Smail I., Ivison R.J., Blain A.W., Kneib J.-P., 1998a, ApJ, 507, L21
- [59] Smail I., Ivison R.J., Kneib J.-P., Cowie L.L., Blain A.W., Barger A.J., Owen F.N., Morrison G., 1999, MNRAS, 308, 1061
- [60] Smail I., Ivison R.J., Owen F.N., Kneib J.-P., Blain A.W., 2000, ApJ, in press (astro-ph/9907083)
- [61] Soucail G., Kneib J.-P., Bézecourt J., Metcalfe L., Altieri B., Le Borgne J.-F., 1999, A&A, 343, L70
- [62] Thronson H., Telesco C., 1986, ApJ, 311, 98
- [63] van Breugel W., De Breuck C., Stanford S.A., Stern D., Röttgering H., Miley G., 1999, ApJ, 518, L61
- [64] Zepf S.E., Silk J., 1996, ApJ, 466, 114
| Property | SMM J14011+0252 | SMM J14009+0252 | SMM J14010+0253 | SMM J14010+0252 | Comment | ||
| J1 | J2 | J5 | J6 | J7 | J8 | ||
| (J2000) | band1 | ||||||
| (J2000) | (). | ||||||
| (J2000) | … | … | 1.4 GHz | ||||
| (J2000) | … | … | (). | ||||
| (J2000) | 850 m | ||||||
| (J2000) | ()2. | ||||||
| Optical | … | … | |||||
| CO | … | … | … | ||||
| Flux at: | |||||||
| m | mJy | mJy | mJy | mJy | IRAS | ||
| m | mJy | mJy | mJy | mJy | (xscanpi). | ||
| m | mJy | mJy | mJy | mJy | |||
| m | mJy | mJy | mJy | mJy | |||
| m | mJy | mJy | mJy | mJy | SCUBA4. | ||
| m | mJy | mJy | mJy | mJy | |||
| m | mJy | mJy | … | … | |||
| mm | mJy | … | … | … | OVRO3. | ||
| cm | mJy | mJy | mJy | mJy | OVRO5. | ||
| cm | Jy | Jy | Jy | mJy | VLA. | ||
| Aperture | |||||||
| mags | |||||||
| … | … | () | |||||
| Total mag. | |||||||
| … | … | … | Total mag. | ||||
| 0.1–2.0 keV | HRI6. | ||||||
1 -band position for J5.
2 Positional accuracy is for SMM J14010+0253 and SMM J14010+0252.
3 Frayer et al. (1999).
4 Errors include a contribution from our uncertainty in the absolute calibration (10 per cent).
5 Cooray et al. (1998).
6 erg s-1 cm-2, 16′′ aperture, unabsorbed (from the ROSAT HEASARC archive at GSFC).