email: satr@sao.ru
New shell radio supernova remnant G16.22.7
Abstract
The extended radio source G16.22.7 is detected as a new previously uncataloged Galactic supernova remnant. Its non-thermal radio spectrum has spectral index , with Sν(1 GHz) = 2.08 Jy, as being measured with the RATAN-600 radio telescope. The NRAO VLA Sky Survey (NVSS) map at 1.4 GHz shows a shell-like bilateral structure. The similar smoothed image from the Effelsberg survey at 2.7 GHz is discussed. The angular diameter 17′ of a circular shell is fitted to brightness peaks meanwhile the outer diameter Dmax = and the width R= are fitted with the model of a spherical optically thin hollow shell. The surface brightness of G16.22.7: (1GHz)W Hz-1m-2sr-1. The peaks in the shell arcs are highly polarized at 1.4 GHz.
Key Words.:
supernovae: general – ISM: individual: G16.22.7: supernova remnants – radio continuum: observation – radio: ISM1 Introduction
The total number of supernova remnants (SNRs) is estimated by different methods, and it is generally accepted to be about 300–1000 detectable SNRs in the Galaxy. Green’s (Green (1998)) catalog includes 220 confirmed SNRs and several dozens of possible or probable ones. Most of them are radio SNRs. Thus a search for new SNRs is an important task of observational radio astronomy. Such searches have been made by Whiteoak & Green (WG92 (1992)), Gray (1994a ; 1994b ), Duncan et al. (Dun97 (1997)). Using the radio morphology, Weiler (W83 (1983)) divided the Galactic SNRs on three classes of shell-like, crab-like or plerionic and mixed or composite ones. As a rule, in these searches the shell or composite SNRs have been found, and the shells dominate the total sample.
Trushkin (Sur96 (1996, 1998)) searched for new SNRs in the Galactic plane survey with the RATAN-600 radio telescope in the First and Fourth Galactic quadrants between and and at 0.96, 3.9 and 11.2 GHz. A dozen extended non-thermal sources which could be new SNRs have been revealed. A analysis of the NRAO VLA Sky Survey (NVSS) maps (Condon et al. NVSS (1998)) is extremely helpful for such a search in the Galactic plane. In spite of the apparent insensitivity of NVSS to extended radiation, nearly 80 known Galactic SNRs are visible in NVSS maps. Trushkin (1999a ) created the collection of the SNR images that is released via the World Wide Web. This induces us to search for new shell SNRs in the original NVSS maps. Excluding known HII regions or planetary nebulae, we have selected nearly 20 shell SNR candidates. One of them, G16.22.7, shows all the necessary properties to recognize it as a new SNR.
.
2 The radio maps
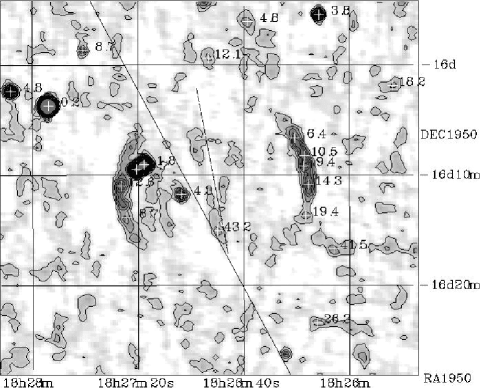
In Fig.1 the NVSS-map of G16.22.7 at 1.4 GHz is shown. Here the maps are plotted with the “Skyview” package (Ebert et al. sky (1998)). The circular shell structure of the SNR has the angular diameter ′, while the integral flux density in the map, S Jy, is much lower than the value extrapolated from the spectrum (see below). The large uncertainty of the NVSS flux depends strongly on the background level definition and could only be a lower limit because the NVSS suffers from lack of zero-spacing data and its images are insensitive to smooth radio structures much larger than several arcmin.
The flux weighted centroid of the source has the Galactic coordinates: =16167 and 689 or equatorial ones: RADEC1950 = , 16°09′50″.
Recently Gaensler (bilat (1998)) has investigated the nature of the the bilateral SNRs, one of them, G03.8-0.3, has a bilateral structure very similar with G16.22.7. Their surface brightness, angular sizes are close. We could estimate the value of defined to be the acute angle between the symmetry axis of the SNR and the Galactic plane. We fit the symmetry axis using only the bright circular arcs. This gives a value . Thus the symmetry axis is aligned close to the Galactic plane (see Fig.1). It is not clear whether the central weak filament with a brightness of nearly 1.5 mJy/beam () located close to the symmetry axis is real and associated with this SNR or not. The new radio mapping are needed.
| N | RA1950 | DEC1950 | Sν | Ppol | In |
|---|---|---|---|---|---|
| hhmmss.ss | ddmmss.s | (mJy) | % | SNR? | |
| 1 | 182543.88 | 160153.1 | 3.3 | 18.2 | no |
| 2 | 182605.89 | 161642.6 | 4.1 | 41.5 | no |
| 3 | 182611.71 | 155524.8 | 15.6 | 3.8 | no |
| 4 | 182612.16 | 162325.8 | 3.8 | 26.3 | no? |
| 5 | 182615.50 | 161052.2 | 18.2 | 14.3 | yes |
| 6 | 182616.68 | 161340.3 | 3.6 | 19.4 | yes |
| 7 | 182617.19 | 160814.8 | 15.3 | 10.5 | yes |
| 8 | 182617.36 | 160909.9 | 5.3 | 9.4 | yes |
| 9 | 182620.78 | 160636.4 | 14.0 | 6.4 | yes |
| 10 | 182638.72 | 155603.8 | 4.2 | 4.8 | yes |
| 11 | 182649.85 | 161502.8 | 3.7 | 43.2 | yes? |
| 12 | 182653.45 | 155920.6 | 3.3 | 12.1 | yes? |
| 13 | 182703.77 | 161145.8 | 9.3 | 4.3 | yes? |
| 14 | 182717.80 | 160900.9 | 80.0 | 1.8 | no |
| 15 | 182720.69 | 160930.0 | 53.4 | 0.7 | no |
| 16 | 182724.39 | 161349.1 | 12.6 | 8.7 | yes |
| 17 | 182726.43 | 161058.1 | 25.3 | 12.6 | yes |
| 18 | 182740.81 | 155839.8 | 4.6 | 8.7 | no |
| 19 | 182754.01 | 160341.9 | 352.9 | 0.2 | no |
| 20 | 182808.20 | 160221.5 | 18.9 | 4.8 | no |
The sources in the field of this map from the NVSS source catalog are marked by white crosses and the numbers around them annotate the fractional polarization in per cent. In Table 1 a list of the NVSS sources with detectable linear polarization is given. This table is obtained by the select program in the astrophysical catalogs data base CATS (Verkhodanov el al. CATS (1997)). We have reduced it to six columns: number, coordinates (B1950), flux density, polarized intensity or power of polarization in per cent; the last column indicates whether the source is a part of the SNR or not. It is remarkable that details (included in the NVSS source catalog) of bright western and eastern arcs of the shell are highly polarized (6–20% from the last column in Table 1). Probably two relatively bright sources (14,15) are background extragalactic ones. The weak filament-like weak source (11) in the center is highly polarized (p=43%) and it might be a detail of the radio shell with a highly ordered magnetic field. The NVSS data show that the bright eastern arc of G03.8-0.3 is also polarized to 10% at 1.4 GHz.

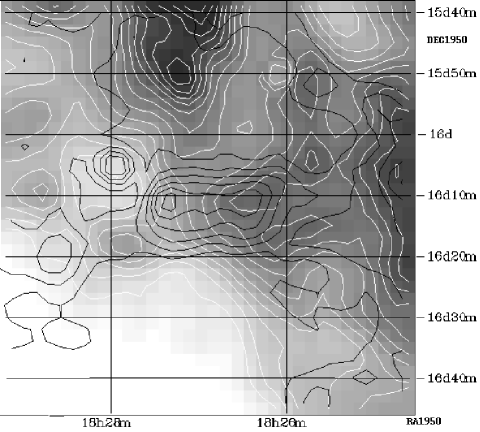
The source G16.22.7 is visible in the Effelsberg surveys maps at 1.4 and 2.7 GHz (Reich et al. 1990a , Reich et al. 1990b , here RRF and RFRR) as a extended source, which has not been included in the catalogs of these surveys because its apparent size is over 16′. We cut the maps from the original maps with a “postage stamps” procedure at Max-Planck-Institut fuer Radioastronomie (MPIfR) web-site, which allowed us to cut small images from a single survey map. In Fig.2 the ISSA (IRAS) grey scale and white contour map at 60 m (Beichman et al. IRAS (1988)) is superposed on the black contour plot of the 2.7 GHz intensity map. There is no clear relation between radio and infrared radiation. Nevertheless, we have estimated the infrared flux to be approximately 250 and 700 Jy at 60 and 100 m respectively within the region of the radio shell. These fluxes are higher than times the radio ones.
We used the radial profiles from the NVSS map and the 2.7GHz map to fit the spatial parameters of the shell SNR. Model profiles of a optically thin synchrotron hollow circular shell with an outer diameter D, width R and a random magnetic field was discussed by Rosenberg (Cas (1970)) for Cas A. The best fit with the real radial profiles at 1.4 and 2.7 GHz gives D= and R=. This initial radial profile was convolved with the -beam of the Effelsberg survey at 2.7 GHz. In Fig.2 we compare this smoothed model profile with the mean one from map at 2.7 GHz. We see that these profiles are very similar within uncertainties of the background level and smoothing effects.
The low value of the flux at 1.4 GHz obtained from the NVSS image could be explained with the above model. If a background with a filtering window of is subtracted from the image with such a radial profile, then the total flux reduced to only 35% of the initial value becomes visible mainly in the bright limb. Therefore, probably the real flux of the source is about 2 Jy, which roughly coincides with the obtained spectrum. Thus SNR G16.22.7 is likely a hollow, almost spherical shell of optically thin smoothly distributed radio emission.
Unfortunately there are not any extended or filamental details in the Digital Sky Survey II image of the SNR area that could be recognized as a optical counterpart.
3 Radio spectrum
The source G16.22.7 was detected in the Galactic plane survey (Trushkin, Sur96 (1996, 1998)) at 0.96 and 3.9 GHz, then we observed this sources in May 1999 with the RATAN-600 radio telescope. The transit observations were carried out with the North sector at 0.96, 2.3, and 3.9 GHz of the continuum radiometric complex of RATAN-600 in the upper culmination of the source. The angular resolution (HPBW) in Azimuth Elevation is and at 0.96 and 3.9 GHz, respectively.
Also we used the images in the FITS format from the Effelsberg Galactic plane surveys at 1.4 and 2.7 GHz to estimate the flux densities from G16.22.7. In the package “Skyview” (Ebert et al. sky (1998)) we calculated the integral flux densities in a defined elliptical area of the images. The linear background was subtracted using the pixels of nearby regions around G16.22.7.
| (GHz) | Sν (Jy) | Sν (Jy) | References |
|---|---|---|---|
| 0.96 | 2.10 | 0.15 | this paper |
| 1.4 | 1.80 | 0.10 | map from RRF |
| 2.3 | 1.35 | 0.10 | this paper |
| 2.7 | 1.25 | 0.10 | map from RFRR |
| 3.9 | 1.03 | 0.10 | this paper |

In Table 2 we summarize the flux density measurements, where Sν means error. In Fig.5 radio spectrum of G16.22.7 is plotted. A power law non-thermal spectrum is a good fit: Sν[Jy]=(). Based on the spectra of nearly 200 Galactic SNRs, Trushkin (1999b ) shows that the mean spectral index for the total sample of the 200 Galactic SNRs is equal to at high frequencies.
We have tried to roughly estimate the distance and diameter of the SNR from the relation. In order to avoid uncertainties in calibrating the Galactic SNRs distances, we took the relation, based on the sample of SNRs of nearby galaxies (Huang et al. Huang (1994)): (W Hz-1m-2sr-1) = . Then for the angular size and above fitting of Sν, the distance d13 kpc and the diameter D64 pc. A new refined relation was obtained by Case & Bhattachatya (S-D (1998)) for a sample of 36 Galactic shell SNRs: (W Hz-1m-2sr-1) = . For (1GHz)W Hz-1m-2sr-1 it gives D pc and d= kpc Then the distance from the Galactic plane z = 300 pc.
4 Conclusions
The new previously unidentified shell supernova remnant G16.22.7 has been discovered in the First Galactic quadrant.
The radio map at 1.4 GHz from NVSS maps has been plotted and the SNR has been clearly shown to be a barrel-shaped or bilateral SNR with the axis of symmetry aligned closely with the Galactic plane.
Angular diameter of 17′ of a circular shell has been fitted to peaks of brightness on its limb. Using a simple model of a spherical hollow shell, a outer diameter Dmax = and width R= are well fitted to the NVSS and the Effelsberg survey data.
The spectrum based RATAN-600 and Effelsberg surveys at cm wavelengths is fitted by a power law with a spectral index .
The polarization data from the NVSS show that the bright arcs of the SNR are linearly polarized to 6–20 %, indicating a synchrotron radiation and an ordered magnetic field in the shell.
Acknowledgements.
Part of this work is supported by the Russian “Astronomy” program project N1.3.2. I thank Booth Hartley (IPAC Caltech) for a good package, “Skyview” ver.3.3 for Linux, Dr. E. Fürst (Max-Planck-Institut für Radioastronomie) for FITS maps of the Galactic plane surveys and NRAO for FITS maps of the NVSS survey. I am very grateful to an anonymous referee for helpful suggestions.References
- (1) Beichman, C. A., Neugebauer, G., Habing, H. J., Clegg, P. E., Chester, T. J. 1988, NASA RP-1190, Infrared Astronomical Satellite (IRAS), Catalogs and Atlases, Vol.1, Explanatory Supplement
- (2) Case, G. L., Bhattacharya, D., 1998, ApJ, 504, 761
- (3) Condon, J. J., Cotton, W. D., Greisen, E. W., Yin, Q. F., Perley, R. A., Taylor, G. B., Broderick, J. J., 1998, AJ, 115, 1693
- (4) Duncan, A. R., Stewart, R. T., Haynes, R. F., Jones, K. L., 1997, MNRAS, 287, 722
- (5) Ebert, R., Hartley, B., Laughlin, G., 1998. IPAC “Skyview User’s guide, Edition 3.3”, CALTECH, Pasadena, California
- (6) Gaensler, B. M., 1998, ApJ, 497, 781
- (7) Gray, A. D., 1994a, MNRAS, 270, 835
- (8) Gray, A. D., 1994b, MNRAS, 270, 847
-
(9)
Green, D. A., 1998,
A Catalogue of Galactic Supernova Remnants
(1998 September version), MRAO, UK (available on
the WWW at “http://www.mrao.cam.ac.uk/surveys/snrs/”) - (10) Huang, Z. P., Thuan, T. X., Chevalier, R. A., Condon, J. J. & Yin, Q. F. 1994, ApJ, 424, 114
- (11) Reich, W., Reich, P., Fürst, E., 1990a, A&AS, 83, 539 (RRF)
- (12) Reich, W., Fürst, E., Reich, P., Reif, K., 1990b, A&AS, 85, 633 (RFRR)
- (13) Rosenberg I., 1970, MNRAS, 85, 147
- (14) Trushkin, S. A., 1996, Astron. Astrophys. Trans. 11, 225
- (15) Trushkin, S. A., 1998, in New Horizons from the Multi-Wavelength Sky Surveys. IAU Symp. 179, eds. B. McLean, D. A. Golombek, J. J. E. Hayes and H.E. Payne, Kluwer Academic Publishers, p. 103
-
(16)
Trushkin, S. A., 1999b,
Atlas of the Galactic supernova remnants maps
(available on the WWW at:“http://cats.sao.ru/
~satr/snr_map.html”) - (17) Trushkin, S. A., 1999a, Bull. SAO RAS, 46, 63
- (18) Verkhodanov, O. V., Trushkin, S. A., Andernach, H., Chernenkov, V. N., 1997, in: “Astronomical Data Analysis Software Systems VI”, eds. G. Hunt & H. E. Payne. ASP Conference Series, 125, 322
- (19) Weiler, K. W., 1983, Observatory, 1054, 85
- (20) Whiteoak, J. B. Z., Green A., 1992, A&AS, 118, 329