13.25.2 – 11.03.4
degrandi@merate.mi.astro.it
Spatially resolved spectroscopy of the cooling flow cluster PKS 0745191 with BeppoSAX
Abstract
We present results from a BeppoSAX observation of the cooling flow cluster PKS 0745191 (z0.1028). By performing spatially resolved spectroscopy, we find that the projected temperature profile is consistent with being constant. We can rule out, at more than the 99 confidence level, a temperature decrement of a factor 2 when going from the cluster core out to 1.2 Mpc. On the contrary, the projected metal abundance is found to drop from 0.4 (solar units) within the cluster core to 0.2 (solar units) at radii larger than 300 kpc, this decrement is significant at more than the 99.9 confidence level.
keywords:
X-rays: galaxies — Galaxies: clusters: individual (PKS 0745191)1 Introduction
PKS 0745191 (hereafter PKS0745) is an X-ray luminous, relatively near (z 0.1028), cluster of galaxies. The proximity of this cluster to the galactic plane () has hampered studies in the optical band. On the contrary much attention has been devoted to the X-ray emission of PKS0745. Early observations (Fabian et al. 1985) showed that PKS0745 hosts a particularly massive cooling flow, . ROSAT PSPC and HRI images of PKS0745 (e.g. Allen, Fabian & Kneib 1996 , hereafter A96) show that the cluster has an elliptical shape. No significant structure is seen on large scales, indicating that quite likely PKS0745 is not undergoing a merger event. David et al. (1993), using Einstein MPC data, report a global temperature of 8.5 keV for PKS0745. A96, by modeling ASCA spectra accumulated in concentric annuli, find evidence of a temperature increase with increasing distance from the cluster core. By performing a full multiphase analysis of the same data, A96 find that the temperature of the ambient gas is consistent with having a flat radial profile. Thus the hardening of the spectrum seen with increasing radius is totally attributed to the different fraction of the cooling-flow emission included in the spectra accumulated from different annuli. Unfortunately the ambient temperature profile cannot be constrained tightly using ASCA data. Allen & Fabian (1998), by performing a multiphase analysis, measure an average metal abundance of 0.35 for PKS0745. A96, again using ASCA data, do not find compelling evidence of an abundance gradient in PKS0745.
In this Letter we report a recent BeppoSAX observation of PKS0745. We use our data to perform an independent and more precise measurement of the temperature and metal abundance profiles of this cluster. We also present the first temperature and metal abundance maps of PKS0745. The outline of the Letter is as follows. In section 2 we give some information on the BeppoSAX observation of PKS0745 and on the data preparation. In section 3 we present the analysis of the integrated spectrum of PKS0745. In section 4 we present spatially resolved measurements of the temperature and metal abundance. In section 5 we discuss our results and compare them to previous findings. Throughout this Letter we assume Ho=50 km s-1Mpc-1 and qo=0.5.
2 Observation and Data Preparation
The cluster PKS0745 was observed by the BeppoSAX satellite (Boella et al. 1997a) between the 23rd and the 25th of October 1998. We will discuss here data from the MECS instrument only, the PDS instrument (Frontera et al. 1997), working in the 13-200 keV band, did not detect any significant emission from the cluster. The MECS (Boella et al. 1997b) is presently composed of two units (after the failure of a third one), working in the 1–10 keV energy range. At 6 keV, the energy resolution is and the angular resolution is 0.7′ (FWHM). Standard reduction procedures and screening criteria have been adopted to produce linearized and equalized event files. Data preparation and linearization was performed using the Saxdas package. The effective MECS exposure time of the observation was 9.5104 s. The observed countrate for PKS0745 was 0.6450.003 cts/s for the 2 MECS units.
All MECS spectra discussed in this Letter have been background subtracted using spectra extracted from blank sky event files in the same region of the detector as the source. The energy range considered for spectral fitting is always 2-10 keV. All spectral fits have been performed using XSPEC Ver. 10.00. Quoted confidence intervals are for 1 interesting parameter (i.e. ), unless otherwise stated.
3 Spatially averaged spectral analysis
We have extracted a MECS spectrum, from a circular region of 8′ radius (1.2 Mpc), centered on the emission peak. From the ROSAT PSPC radial profile, we estimate that about 90 of the total cluster emission falls within this radius. The spectrum has been fitted with a one temperature thermal emission component plus a cooling flow component (MEKAL and MKCFLOW codes in the XSPEC package), absorbed by a galactic line of sight equivalent hydrogen column density, , of 4.24 cm-2 (Dickey & Lockman 1990). All parameters of the cooling flow component, except for the mass deposition rate were constrained: the minimum temperature was fixed at 0.1 keV, the maximum temperature, and the metal abundance were set to be equal to the temperature and the metal abundance of the MEKAL component. The model yields an acceptable fit to the data, 162.7 for 167 d.o.f. The best fitting values for the temperature and the metal abundance are respectively, 8.50.6 keV and 0.380.03, solar units. Not surprisingly, given the adopted spectral range (2-10 keV), the mass deposition rate is rather ill constrained . This value is however in agreement with values derived by deprojecting the ROSAT PSPC surface brightness profile or by performing spectral fits to ROSAT PSPC and ASCA data (see A96).

4 Spatially resolved spectral analysis
The spectral distortions introduced by the energy dependent MECS PSF, when performing spatially resolved spectral analysis, have been taken into account using the method described in Molendi et al. (1999), hereafter M99, and references therein.
We have accumulated spectra from 5 annular regions centered on the X-ray emission peak, with inner and outer radii of 0′-2′, 2′-4′, 4′-6′, 6′-8′ and 8′-12′. A correction for the absorption caused by the strongback supporting the detector window has been applied for the 8′-12′ annulus, where the annular part of the strongback is contained. For the 6′-8′ region, where the strongback covers only a fraction of the available area, we have chosen to exclude the regions shadowed by the strongback. We have fitted each spectrum, except the one extracted from the innermost region, with a MEKAL model absorbed by the galactic NH, of 4.24 cm-2. In the spectrum from the 0′-2′ (0-0.3 Mpc) region we have included a cooling flow component, the parameters of this component have all been fixed except for the mass deposition rate, as in the fitting of the integrated spectrum (see section 3). The temperature and abundance we derive for the innermost region are respectively 7.9 keV and 0.45 0.03, solar units, the mass deposition rate is found to be . If we fix the mass deposition rate to the value of , estimated by A96, we obtain somewhat tighter constrains on the temperature 8.50.3 keV, while the abundance estimate 0.46 0.03, solar units, is practically unaffected. In figure 1 we show the temperature and abundance profiles obtained from the spectral fits, the values reported for the innermost annulus are those obtained by leaving the mass deposition rate as a free parameter.
By fitting the temperature and abundance profiles with a constant we derive the following average values: 0.3 keV and 0.350.03, solar units. A constant fits adequately the temperature profile; using the statistics we find, 3.1 for 4 d.o.f., corresponding to a probability (P) of 0.54 for the observed distribution to be drawn from a constant parent distribution. On the contrary, a constant does not provide an acceptable fit to the abundance profile, 17.3 for 4 d.o.f. (P 0.002). Interestingly, a linear profile of the type, Ab = a b r, where Ab is in solar units and r in arcminutes, provides a better fit, 7.1 for 3 d.o.f. (P = 0.07). However, according to the F-test, there is a relatively high probability (P = 0.15) that the improvement may be associated to the reduction in the d.o.f. Indeed, as clearly visible from figure 1, the abundance drop is seen only when going from the first to the second bin, all other bins have abundances consistent with the one derived in the second bin.
We have used the Fe Kα line as an independent estimator of the ICM temperature. We recall that the centroid of the observed Fe Kα line, which is essentially a blend of the He-like Fe line at 6.7 keV, and the H-like Fe line at 7.0 keV, can be used to derive an estimate of the gas temperature, a detailed description of the method we employ can be found in M99. Considering the limited number of counts available in the observed line we have performed the analysis on 2 annuli with bounding radii 0′-6′ and 6′-12′. In figure 1 we have overlaid the temperatures derived from the centroid analysis on those previously obtained through the thermal continuum fitting. The two measurements of the temperature profile are clearly in agreement with each other.
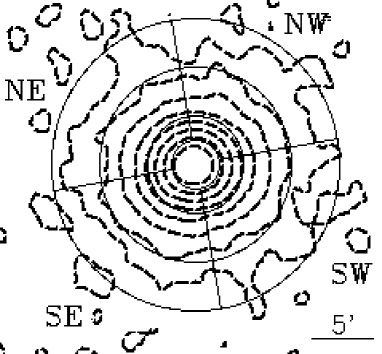
We have divided PKS0745 into 4 sectors: NW, SW, SE and NE. Each sector has been divided into 3 annuli with bounding radii, 2′-4′, 4′-8′ and 8′-12′. In figure 2 we show the MECS image with the sectors overlaid. A correction for the absorption caused by the strongback supporting the detector window has been applied for the sectors of the 8′-12′ annulus. We have fitted each spectrum with a MEKAL model absorbed by the galactic NH. For the spectra accumulated in the outermost annulus, where the background contributes about to the total spectrum, we have taken into account a variation in the background normalization when computing the confidence intervals for the temperature and the abundance.

In figure 3 we show the temperature profiles obtained from the spectral fits for each of the 4 sectors. In all the profiles we have included the temperature measure obtained for the central region with radius 2′ derived by the multiphase analysis detailed above. Fitting each radial profile with a constant temperature we derive the following average sector temperatures: 7.90.4 keV for the NW sector, 7.30.4 keV for the SW sector, 8.70.5 keV for the SE sector and 8.70.5 keV for the NE sector. All sector averaged temperatures are found to be within 2 of the average temperature for PKS0745 derived from the radial profile reported in figure 1. From the statistics we find: for 3 d.o.f. (P ) for the NW sector, for 3 d.o.f. (P ) for the SW sector, for 3 d.o.f. (P ) for the SE sector and for 3 d.o.f. (P ) for the NE sector. The temperature profile is consistent with being constant in all sectors. In the SE and NE sectors the temperature of the second and third annuli is somewhat larger than the temperature of the corresponding annuli in the NW and SW sectors. A fit with a constant to the temperatures of the second and third annulus yields respectively: for 3 d.o.f. (P ) and for 3 d.o.f. (P ), implying that the evidence in favor of an azimuthal gradient is not particularly strong.

In figure 4 we show the abundance profiles for each of the 4 sectors. In all profiles we have included the abundance measure obtained for the central region with bounding radius 2′. Fitting each profile with a constant abundance we derive the following sector averaged abundances: 0.430.03 for the NW sector, 0.400.03 for the SW sector, 0.400.03 for the SE sector and 0.380.03 for the NE sector. The fits yield the following values: for 3 d.o.f. (P ) for the NW sector, for 3 d.o.f. (P ) for the SW sector, for 3 d.o.f. (P ) for the SE sector and for 3 d.o.f. (P ) for the NE sector. A decreasing trend is observed in all sectors. A highly statistically significant gradient is observed only in the SE and NE sectors. Interestingly a drop in the abundance, when going from the first to the second annulus, is observed for all sectors except the NW. In the latter the abundance appears to decrease only for radii greater than 6′. The abundance for the 2′-4′ annulus averaged over the SW, SE and NE sectors is found to be different at more than the confidence level from the abundance of the NW sector of the same annulus.
5 Discussion
The ASCA measurement of the average temperature of the ambient gas in PKS0745 obtained by A96, keV (the errors are confidence), is in excellent agreement with the average temperature we obtain from the BeppoSAX radial profile, 0.3 keV. Previous measurements of the temperature structure of the ambient gas in PKS0745 from ASCA data, by A96 and by White (1999), yield profiles that are consistent with being constant. The rather large error bars associated to the the measurements do not allow to place tight constrains on the temperature profile. The profile we report in this Letter (see figure 1) is consistent with the one measured from ASCA. Moreover, the better quality of the BeppoSAX data, allows us to rule out, at more than the confidence level, a temperature decrement of a factor 2 when going from the cluster core out to 1.2 Mpc. The profiles we report in figure 3 suggest that the radial temperature profile is constant for all sectors. We find an indication of an azimuthal temperature gradient occurring in the annuli with bounding radii 2′-4′ (0.3 Mpc - 0.6 Mpc) and 4′-8′ (0.6 Mpc - 1.2 Mpc). The data suggests that the SE and NE sectors of the cluster may be somewhat hotter than the rest. Given the modest statistical significance of this temperature gradient we refrain from pursuing the point any further.
No clear picture emerges from the radial abundance profile presented by A96 (see their Fig 7b and their table 4), partially because of the large errors and partially because of the discordance between the SIS and GIS measurements. The abundance profile reported by White (1999) is suggestive of an abundance gradient but statistically consistent with a constant value. The radial abundance profile we report in this Letter (see figure 1) shows a highly significant (more than ) factor 2 drop in the abundance, when going from the first 0′-2′ (0-0.3 Mpc) to the second 2′-4′ (0.3-0.6 Mpc) radial bin. From 0.3 Mpc out to 1.8 Mpc the profile is consistent with being constant, note however that it is only out 0.9 Mpc that the errors allow us to exclude significant abundance variations. The profiles we report in figure 4 suggest that the radial abundance gradient is most likely present in all sectors. Interestingly the NW sector of the annulus with bounding radii 2′-4′ (0.3 Mpc - 0.6 Mpc) is found to have an abundance similar to that derived for the core of the cluster and significantly larger than the mean abundance derived from the other 3 sectors of the same annulus. The presence of an abundance excess in the NW sector with respect to the other sectors may indicate an enhanced star formation rate. Intriguingly, the excess blue emission associated to the central dominant galaxy discovered by Romanishin (1987) and interpreted as the result of vigorous star formation is found, by A96, to be marginally brighter in the NW direction. Of course the blue excess emission is seen on scales much smaller ( 10 kpc) than those on which we observe the abundance enhancement. Nonetheless it is tempting to speculate that they both originate from the same process, i.e. enhanced star formation in the NW direction.
Acknowledgements.
We acknowledge support from the BeppoSAX Science Data Center.References
- [1] Allen, S., W., Fabian, A., C.& Kneib, J. P. 1996, 283, 263 (A96)
- [2] Allen, S., W., & Fabian, A., C. 1998, MNRAS, 297, L63
- [3] Boella, G., Butler, R. C., Perola, G. C., Piro, L., Scarsi, L., & Bleeker, J. A. M. 1997a, A&AS, 122, 299
- [4] Boella, G., et al. 1997b, A&AS, 122, 327
- [5] David, L. P., Slyz, A., Jones, C., Forman, W., Vrtilek, S. D., & Arnaud, K. A. 1993, ApJ, 412, 479
- [6] Dickey, J. M., & Lockman, F., J. 1990, ARA&A, 28, 215
- [7] Fabian, A. C., Arnaud, K. A., Nulsen, P. E. J. et al. 1985, 216, 923
- [8] Frontera, F., Costa, E., Dal Fiume, D., Feroci, M., Nicastro, L., Orlandini, M., Palazzi, E., & Zavattini G. 1997, A&AS 122, 357
- [9] Molendi, S., De Grandi, S., Fusco-Femiano, R. et al. ApJL in press (M99)
- [10] Romanishin, W. 1987, ApJ 323, L113
- [11] White, D. A. 1999, MNRAS in press (astro-ph/9909467)