Giant Arc Statistics and Cosmological Parameters
Abstract
We study with semi-analytical methods the statistics of pronounced arcs caused by lensing of galaxies by foreground galaxy clusters. For the number density and redshift distribution of rich clusters we use Press-Schechter theory, normalized on the basis of empirical data. For the background sources we make use of observational results in the Hubble Deep Field. We present results for three different lens models, in particular for the universal profile suggested by Navarro, Frenk and White. Our primary concern is the dependence of the expected statistics on the cosmological parameters, , . The theoretical estimates are compared with the cluster arcs survey EMSS, and the resulting constraints in the -plane are presented. In spite of considerable theoretical an observational uncertainties a low-density universe is favored. Degeneracy curves for the optical depth and likelihood regions for the arc statistics in the -plane depend only weakly on the cosmological constant.
1 Introduction
There is now significant evidence that we are living in a critical universe in which the vacuum energy (or some effective equivalent) dominates and ordinary (baryonic) matter is only a tiny fraction of the total matter content:
The first two statements are strongly favored by the combination of recent measurements of the luminosity-redshift relation for type Ia supernovae at high redshifts and the observed temperature fluctuations of the cosmic microwave background radiation. (For a review, see [1].) is also consistent with data from rich clusters of galaxies, in particular from the analysis of the X-radiation emitted by the hot intra-cluster gas. The total matter contribution of rich clusters can also be determined by making use of (strong and weak) gravitational lensing. Such observations provide an estimate of the ratio . and can then be obtained separately by using in addition the primordial abundances of light elements, synthesized during the first three minutes. (For a discussion of other methods, we refer again to [1] and references therein.)
Readers who do not closely follow these developments should, however, be warned that there remain serious worries. For instance, one cannot yet exclude systematic effects in the supernovae data (e.g., intrinsic evolution, extinction) which could masquerade a cosmological constant.
In this situation any method which provides independent restrictions on the density parameters , is of great interest. Lensing statistics on large scales has this potential. The use of gravitational lensing as a tool to determine cosmological parameters has been suggested in the pioneering works [2, 3]. An early detailed study of lensing statistics was performed by Turner, Ostriker and Gott [4]. Much of the extensive later work is based on this paper. After some sporadic studies which investigated the effect of the cosmological constant on some specific aspects of lensing, it was pointed out in [5, 6, 7] that statistical properties of gravitational lensing may exhibit strong -dependencies.
This is not the place to review the many more recent studies in the field of lensing statistics. We confine ourselves to the following remarks (more extensive references can be found in the quoted papers):
(i) Several authors have recently re-analyzed the statistics of strong gravitational lensing of distant quasars by galaxies [8, 9, 10, 11]. Observationally, there are only a few strongly lensed quasars among hundreds of objects. The resulting bounds on and are, however, not very tight because of systematic uncertainties in the galaxy luminosity functions, dark matter velocity dispersions, galaxy core radii and limitations of the observational material.
(ii) On the basis of existing surveys, the statistics of strongly lensed radio sources has been studied in several recent papers [12, 13, 14]. Beside some advantages for constraining the cosmological model, there is the problem that the redshift distribution of the radio sources is largely unknown. (One can, however, make use of a strong correlation between the redshift and flux density distributions.)
(iii) Clusters with redshifts in the interval are efficient lenses for background sources at . For several reasons one can expect that the probability for the formation of pronounced arcs is a sensitive function of and . First, it is well-known that clusters form earlier in low density universes. Secondly, the proper volume per unit redshift is larger for low density universes and depends strongly on for large redshifts. An extensive numerical study of arc statistics has been performed by Bartelmann et al. [15], with the result that the optical depth depends strongly on . In our semi-analytical treatment, discussed below, we find, however, only a weak -dependence.
This paper is organized as follows. Since most relativists are not familiar with lensing statistics, we repeat in section 2 some basic concepts (cross sections, optical depth) and formulae needed in the theoretical analysis. For a comparison of theoretical expectations with observations, one has to include magnification effects and the observational selection criteria have to be taken into account. This will be explained in section 3. In section 4 we discuss further inputs we shall need in our semi-analytical treatment. This includes the Press-Schechter formula for the differential comoving cluster number density, dynamical and structural information required for the lens models, as well as redshift and luminosity distributions for the background sources. We shall compare our theoretical expectations with data for the Extended Medium-Sensitivity Survey (EMSS), which will briefly be presented in section 5. Our main results are described in section 6. These are compatible with a similar independent investigation of Cooray [16], but do not agree with the claimed -dependence of Bartelmann et al. [15]. Possible sources of this conflict will be indicated. In section 7 we summarize and discuss future prospects for tighter constraints in the -plane.
2 Generalities on lensing statistics
As for any scattering situation, the concept of cross-sections is basic in statistical lensing.
Consider a source at redshift and distance , as well as a lens a distance (we always use angular diameter distances). We are interested in lensing events characterized by a set of lensing properties, , of this gravitational lens system. In this paper we shall consider especially lensing events in which a galaxy behind a cluster lens is seen as an arc with a length-to-width ratio , larger than some given value . For a given lens at distance , the cross section for the properties is by definition the area of the source sphere of radius , within which a source has to be located in order to be imaged with property .
It is convenient to also introduce the corresponding cross section in the lens plane by a simple rescaling: .
Consider next a distribution of lenses (deflectors) with number density at redshift . The optical depth for property is defined to be the probability that a given source at redshift to undergo a lensing event with property . This is equal to the fraction of the entire source sphere of radius which is covered by the cross sections (the cross-sections are in practice not overlapping):
| (1) |
Here, denotes the proper volume per unit redshift. For a Friedmann universe we have, in standard notation,
| (2) |
with
| (3) |
where
| (4) |
In connection with the geometrical factor (2) in the integral (1) we recall that the angular diameter distance for a Friedmann universe is given by
| (5) |
where is a curvature parameter and , , for , , , respectively. The dependence of on the cosmological parameters is one of several sources for such a dependence of the optical depth. Others are implicit in the cross-sections and the lens distributions. Astrophysical uncertainties of these quantities limit attempts to exact cosmological parameters from lensing statistics.
Inserting (2) into (1), the optical depth can be expressed more simply in terms of the cross-section relative to the lens sphere:
| (6) |
Simple applications of this formula can be found in the early papers on lensing statistics. (See also [17], especially chapters 11 and 12.)
We now consider in more detail the statistics of arcs produced by cluster lenses. Let be the comoving number density of clusters at redshift in the mass interval about . The cross-section for the property that a background galaxy at redshift behind a cluster of mass at redshift is seen as an arc with length-to-width ratio larger than will be denoted by . In terms of these quantities the optical depth (6) is given by
| (7) |
Singular isothermal spheres (SIS) are the simplest lens models we shall use. For these the ratio coincides with the magnification , and the cross-section is [17]
| (8) |
Here is the (constant) one-dimensional velocity dispersion, and the angular diameter distance from the lens to the source.
3 Amplification bias and selection
For any magnitude limited sample of sources, the number of lensed sources is larger than it would be in an unbiased sample, because lensing brightens into the sample sources that would otherwise not be detected. This is, for example, a particularly pronounced effect in quasar lensing surveys, because the faint end of the quasar luminosity function rises steeply.
Taking the amplification bias into account, the lensing probability (7) has to be replaced by
| (9) |
where the first factor under the integral is the integrand in (7) and the bias factor , as a function of the apparent source magnitude and the redshifts , , can be expressed as follows: Let denote the unlensed number counts of sources, which agrees in practice with the observed number counts. Then
| (10) |
where is the probability distribution for the magnification of the apparent magnitude of lensed images. Since , the latter is simply related to the magnification probability distribution . For a SIS model we have
| (11) |
is simply related to the luminosity function of the source population, for which a Schechter form is often adopted.
4 Additional theoretical and observational input
For the numerical evaluation of (9) and the corresponding giant arc statistics we need explicit knowledge of cross-sections, the differential comoving number density of clusters, and the distribution of the source galaxies. These quantities are, unfortunately, not well-known.
We have used three simple lens models, namely isothermal spheres with vanishing and positive core radii, and also the universal density profile proposed by Navarro, Frenk and White [19]. For isothermal models we need the velocity dispersion that enters in the cross-section with the fourth power (see (8)). depends on the cluster mass as well as on the cluster redshift . For the -dependence we adopt the one of the spherical collapse model, while the -dependence is derived from empirical correlations, using in particular the correlation between and the cluster temperature [20]. (As expected from the virial theorem, the temperature is strongly correlated with the mass, .)
For we use the Press-Schechter formula [21]. This is based on a mixture of statistical reasoning, linear perturbation theory, and the spherical collapse model. Numerical simulations have demonstrated that the Press-Schechter expression provides a much better description than could be expected. One of the assumptions that goes into its derivation is that the smoothed density field is Gaussian. The function is essentially determined by the rms density fluctuations of linear theory. (For textbook treatments, see [22, 23].) The -dependence of is then equal to the one of the growing mode of linear perturbation theory,
| (12) |
and can be expressed in terms of the power spectrum of the density fluctuation in linear theory. For the latter we use the CDM transfer function given by Bardeen et al. [24], and assume that the initial fluctuations are adiabatic and nearly scale free. The normalization parameter is taken from [25]. Uncertainties of this parameter, as well as its dependence on , , are critical, since enters exponentially in the Press-Schechter formula.
For the source distribution of galaxies we make use of the present knowledge based on the Hubble Deep Field (HDF). The deep exposure of this survey is important for our analysis. Unfortunately, the redshift distribution is not precisely known, since a detailed spectroscopy of about 900 faint sources in the sample is impossible. There exist, however, two photometric redshift catalogs that were obtained by analyzing the observations in four broadband filters. We are always using the catalog in [26] which is based on spectral template fitting.
As a result of large K-corrections, the luminosity function is not well-known, and cannot be used for determining the amplification bias. Our method of treating this is discussed in [18].
The previous discussion should make it amply clear that we have to live with substantial uncertainties. Hopefully, these will be reduced in the near future.
5 Extended Medium-Sensitivity Survey and arc statistics
In the next section we shall compare our theoretical expectations with the results of a CCD imaging survey of gravitational lensing selected from the Einstein Observatory Extended Medium-Sensitivity Survey (EMSS). The latter is a large and sensitive X-ray catalog and has been studied by a number of groups, including followed up observations using the ROSAT or ASCA satellites. Presently, about 100 EMSS sources are classified as clusters.
In [27] a subsample was selected for an arc survey, using the University of Hawaii 2.2 m telescope, and also the CFHT for specific observations. It should be emphasized that the EMSS is not strictly flux limited, since the detection of sources was optimized for high surface brightness. Therefore, more extended clusters with lower surface brightness, especially relatively close ones, may have been missed. Moreover, at high redshifts only the most luminous clusters can be seen. Since these are likely to be more massive, the lensing fraction is expected to become larger. For these reasons clusters in the redshift range , and surface brightness erg/s in the energy band keV are most suitable for a comparison with theoretical expectations.
The subsample selected in [27] contains 21 such clusters. (This corresponds to about 1300 such clusters over the entire sky.) Among these there are 6 clusters with giant arcs satisfying the following criteria: (i) The length-to-width ratio of the arc is . (ii) The magnitude in the V-band satisfies . (Actually, was not always measured; in those cases was adopted, which should be about the same.) The 6 clusters in the limited area of the sample scale to about 360 over the entire sky, and the chance that a cluster in the specified range of and contains an arc is roughly 0.3.
So far the statistics are poor, but with the new satellites CHANDRA and XMM the situation should soon improve.
6 Results
In this section we present the main results of our study. A more detailed discussion and additional parameter studies are given in [18].
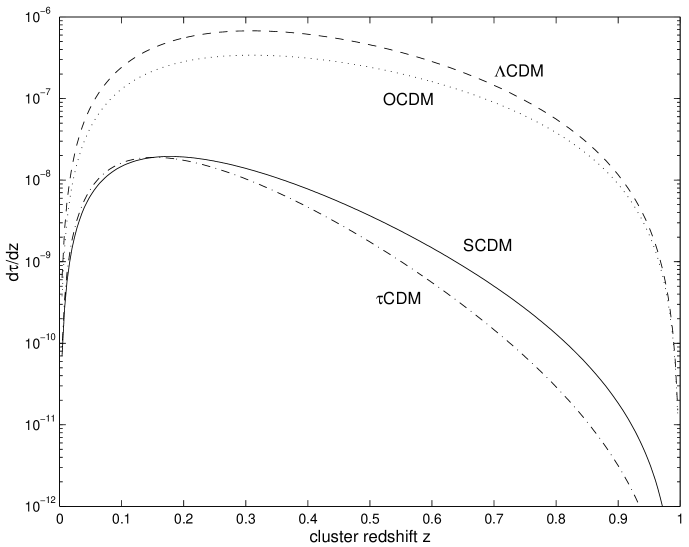
Fig. 1 shows the differential optical depths for the formation of giant arcs with for the following four cosmological models: SCDM (, ), OCDM (, ), CDM (, ), CDM (, , shape parameter ). (The latter model mimics a scenario with an unstable massive -neutrino.) The source is taken at redshift . The foreground cluster lenses with X-ray luminosities in the EMSS band erg/s, are modeled as singular isothermal spheres.
Note - and this is one of our main points - that the curves for OCDM and CDM do not differ much. The total optical depths are listed in the left column of Table 1, while the right column contains those of the numerical study of Bartelmann et al. [15]. We emphasize that the agreement is quite good for three of the four models, but for the OCDM model there is a difference of about an order of magnitude. Possible sources of this discrepancy will be discussed later.
| [18] | [15] | |
|---|---|---|
| SCDM | ||
| OCDM | ||
| CDM | ||
| CDM |
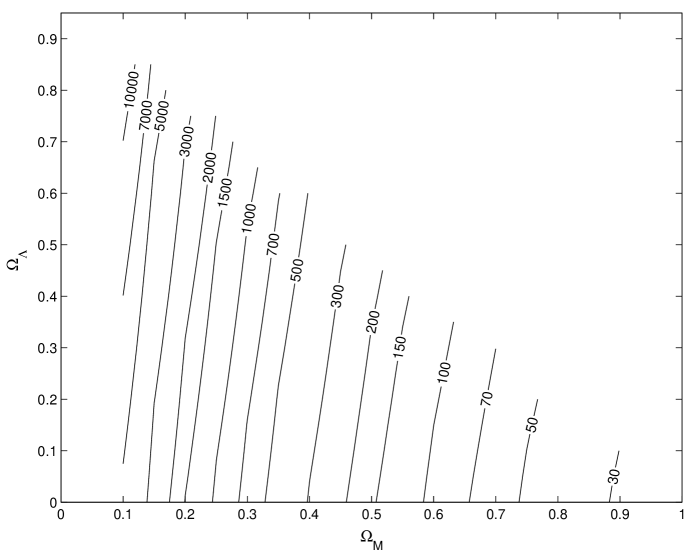
The dependence of the expected total number of giant arcs on the cosmological parameters and is shown in Fig. 2. Parameter variations and changes of the lens model have convinced us that the shape of the degeneracy curves (the lines of constant arc number) is quite stable, and we believe that their weak -dependence will also be found in future more accurate studies. The absolute numbers refer to the EMSS subsample specified a the end of the previous section, and should be compared with the 360 arcs mentioned there. The best agreement is reached for , practically independent of .
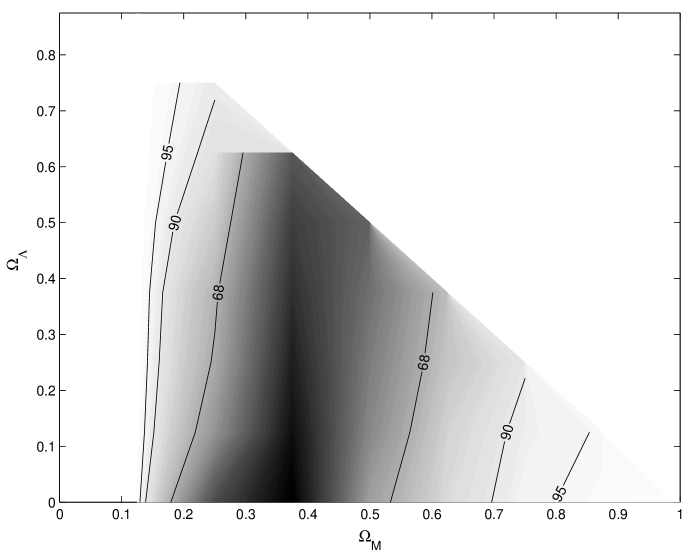
In Fig. 3 we present the result of a maximum likelihood analysis, always keeping a SIS model. We have marginalized with respect to several empirical parameters, including , which affect the prediction most strongly. At the present stage the 90% likelihood regions are still quite broad, but a low-density universe is clearly favored.
We have not yet made a similar likelihood analysis for the universal profile of Navarro, Frenk and White [19]. As already emphasized, the degeneracy curves are quite similar (the slopes become slightly negative), however, the absolute numbers turn out to be smaller [18]. Other profiles have recently been proposed; their implications for the arc-statistics will be a subject of further studies.
As already mentioned, Bartelmann et al. [15] found in their N-body simulations for the optical depth a strong -dependence (see Table 1). It is, of course, true that a numerical approach provides in principle more realistic lensing properties of the clusters, since substructure and asymmetries are included. What we find, however, difficult to understand is the claim in [15] that clusters are less concentrated for the CDM model than for the OCDM model with the same , and that this is the main reason for the lower number of arcs in the former case. A more recent simulation of another subgroup [28] of the Virgo consortium indeed found no substantial differences of the cluster structures and mass profiles.
We have investigated the various -dependences which combine to the pattern of degeneracy lines shown in Fig. 2. The geometrical factor in (7) is, of course, common to all lensing statistics, and the -dependence implicit in the SIS cross-section (8) is quite typical. For a conserved comoving lens number density, these would combine to degeneracy curves with . (This kind of degeneracies are, for instance, found for the statistics of strongly lensed quasars.) This is changed by the -dependence of the Press-Schechter formula for to the weak dependence in Fig. 2. (For further details, see [18].)
7 Conclusions and outlook
Statistical strong lensing data for a specific class of sources have the potential to constrain the cosmological parameters and . In combination with other information (from type Ia SNe, CMB anisotropies, etc.) this could tighten the allowed range of these important cosmological parameters, and also serve as a consistency check.
So far, observational and theoretical uncertainties are limiting the use of lensing statistics for cosmology. Beside much better statistical samples we also need accurate knowledge about the population and mass distributions of the lenses, as well as on the redshift and luminosity distributions of the sources.
In our semi-analytical study of giant arc statistics we have investigated the range of the current systematic uncertainties in constraining the cosmological parameters in the - plane. The available data for EMSS favor a low-density universe, but the 90% upper bound for is not really tight. More secure, we believe, is our conclusion that the degeneracy curves in the -plane depend only weakly on . In contrast to other claims in the literature [15], statistical lensing of giant arcs thus can not be used to constrain . It may, however, serve as a consistency check. (Note that the steep degeneracy curves are semi-transversal to those for type Ia SNe, as well as to the ones related to the position of the first acoustic peak in the CMB anisotropies.)
One may be sceptical that strong lensing statistics will ever become an accurate tool. Weak lensing by large-scale structures looks more promising. The latter produce a tiny gravitational shear field which will be detectable in the near future. This shear pattern is correlated with the power spectrum of density fluctuations. The theoretical analysis is in this case more reliable than for strong lensing statistics, because linear perturbation theory is quite accurate on large scales. Weak lensing maps may soon be obtained with wide field imaging surveys. (For a review, and references, see [29].)
N. S. thanks the organizers of the Journées Relativistes 1999 for inviting him to beautiful Weimar and to present this work. He especially thanks G. Neugebauer for his gracious hospitality. N. S. thanks M. Bartelmann for a useful discussion on arc statistics. We are grateful to C. Frenk for providing us his FORTRAN subroutine for the calculation of the universal profile parameters.
This work was supported by the Swiss National Science Foundation.
References
- [1] N. A. Bahcall, J. P. Ostriker, S. Perlmutter, and P. J. Steinhardt, Science 284 (1999) 1481
- [2] S. Refsdal, Mon. Not. R. Astron. Soc. 128 (1964) 295
- [3] W. H. Press and J. E. Gunn, Astrophys. J. 185 (1973) 397
- [4] E. L. Turner, J. P. Ostriker, and J. R. Gott, Astrophys. J. 284 (1984) 1
- [5] M. Fukugita, T. Futamase, and M. Kasai, Mon. Not. R. Astron. Soc. 246 (1990) 24
- [6] E. L. Turner, Astrophys. J. 365 (1990) L43
- [7] M. Fukugita, T. Futamase, M. Kasai, and E. L. Turner, Astrophys. J. 393 (1992) 3
- [8] C. S. Kochanek, Astrophys. J. 466 (1996) 638
- [9] M. Chiba and Y. Yoshii, Astrophys. J. 510 (1999) 42
- [10] M. Chiba and T. Futamase, Prog. Theor. Phys. Suppl. 133 (1999) 115
- [11] Y.-C. N. Cheng and L. M. Krauss, astro-ph/9810393 V3
- [12] E. E. Falco, C. S. Kochanek, and J. A. Munoz, Astrophys. J. 494 (1998) 47
- [13] A. R. Cooray, Astron. Astrophys. 342 (1999) 353
- [14] P. Helbig et al., astro-ph/9904007
- [15] M. Bartelmann, A. Huss, J. M. Colberg, A. Jenkins, and F. A. Pierce, Astron. Astrophys. 330 (1998) 1
- [16] A. R. Cooray, astro-ph/99904245 V2; Astron. Astrophys. 341 (1999) 653
- [17] P. Schneider, J. Ehlers, and E. E. Falco, Gravitational Lenses, Springer, Berlin 1992
- [18] R. Kaufmann, Giant Arc Statistics and the Cosmological Paramteters, Diploma thesis, University of Zurich, June 1999
- [19] J. F. Navarro, C. S. Frenk, and S. D. M. White, Astrophys. J. 490 (1997) 493
- [20] X.-P. Wu, Y.-J. Xue, and L.-Z. Fang, astro-ph/9905106, submitted to Astrophys. J.
- [21] W. H. Press and P. Schechter, Astrophys. J. 187 (1974) 425
- [22] T. Padmanabhan, Structure Formation in the Universe, Cambridge University Press, Cambridge 1993
- [23] J. A. Peacock, Cosmological Physics, Cambridge University Press, Cambridge 1999
- [24] J. M. Bardeen, J. R. Bond, N. Kaiser, and A. S. Szalay, Astrophys. J. 304 (1986) 15
- [25] U.-L. Pen, Astrophys. J. 498 (1998) 60
- [26] M. J. Sawicki, H. Lin, and H. K. C. Yee, Astron. J. 113 (1997) 1
- [27] G. A. Luppino, I. M. Gioia, F. Hammer, O. Le Fèvre, and J. A. Annis, Astron. Astrophys. Suppl. Ser. 136 (1999) 117L
- [28] P. A. Thomas et al., Mon. Not. R. Astron. Soc. 296 (1998) 1061
- [29] Y. Mellier, Probing the Universe with Weak Lensing, to appear in Vol. 37 of Annu. Rev. Astron. Astrophys.