A photometric survey for variable stars in the globular cluster M5
Abstract
We present the results of a photometric survey for variable stars in the nearby globular cluster M5. A arcmin field centered on the cluster was monitored for a total of 37 hours with a CCD camera mounted on the 1.0-m Swope telescope. Five new variables were identified: four blue stragglers which are SX Phe pulsating variables, and an eclipsing binary with an orbital period of 0.466 d. The eclipsing binary lies near the main-sequence turnoff on the cluster color-magnitude diagram. We do not confirm the variability of any of the 10 eclipsing binaries identified in the cluster field by Reid (1996) and Yan & Reid (1996). The dwarf nova M5-V101 exhibited two outbursts with full amplitudes of about 2.7 mag during our observations. A color-magnitude diagram of the surveyed field was obtained, and a possible extreme HB star located 2 mag below cutoff of the blue HB was identified.
Key Words.:
stars : binaries:eclipsing – blue stragglers – stars:variables:general – globular clusters: individual: M5 – Hertzsprung-Russell and C-M diagrams1 Introduction
NGC 5904=M5=C1516+022 is a rich globular cluster whose proximity and low
reddening ( kpc, ; Harris 1996) make it
an excellent target for detailed studies. We selected this cluster
as one of the targets for an ongoing survey for eclipsing binaries in
globular clusters (Kaluzny et al. 1997;
Thompson et al. 1999).
The main goal of this project is to use detached eclipsing binaries
for the determination of ages and distances of globular clusters
(Paczyński 1997).
M5 is known to contain more than 120 RR Lyr variables (Clement 1997 priv. comm.). CCD photometry for 49 of them was presented recently by Reid (1996) who gives references to earlier papers dealing with RR Lyr stars in M5. As a side result of our survey we obtained -band light curves for 65 RR Lyr stars from M5. These data will be presented in a separate contribution (Kaluzny et al. 1999).
Reid (1996) reported the discovery of 4 probable eclipsing binaries among the cluster HB/RGB stars. In addition, Yan & Reid (1996) identified 6 short-period eclipsing binaries located at the cluster turn-off. Our data indicate that all of the eclipsing variables reported in Reid (1996) and Yan & Reid (1996) were spurious detections.
Drissen & Shara (1998) used HST images to look for variable stars in the core of M5. They managed to identify one variable blue straggler, a possible eclipsing binary with a period d. Several new RR Lyr stars were also identified in this study.
M5 is one of only two galactic globular clusters known to harbor dwarf novae. Variable M5-V101 was first identified as a dwarf nova by Oosterhoff (1941). A recent summary of observational studies of that variable is given in Hakala et al. (1997). During our monitoring of M5 the variable exhibited two outbursts with full amplitudes exceeding 2.7 mag in the V band.
2 Observations and data reduction
The time-series photometry of M5 on which this paper is based was obtained with the 1.0-m Swope telescope at Las Campanas Observatory. The data were collected during the interval 1997 May 9 – 1997 Aug 13. A condensed log of the observations is given in Table 1.
| Date | ||
|---|---|---|
| UT | hours | |
| May 9 | 31 | 5.5 |
| May 10 | 34 | 5.8 |
| May 13 | 37 | 5.6 |
| May 14 | 37 | 6.5 |
| May 15 | 44 | 5.8 |
| May 19 | 24 | 2.0 |
| Jun 7 | 9 | 2.0 |
| Jun 8 | 12 | 2.0 |
| Jun 17 | 10 | 1.5 |
| Aug 3 | 1 | - |
| Aug 4 | 1 | - |
| Aug 13 | 2 | 0.2 |
A pixel SITe CCD camera was used as the detector, with a field of view of arcmin at a scale of 0.435 arcsec/pixel. Due to some technical problems the field of view of the camera was limited to arcmin during the period from 1997 May 9 through 1997 May 19. During that run we monitored two overlapping subfields covering the northern and southern sections of the cluster. The total area of the monitored field was equal to 314 square arcmin. Starting in 1997 Jun 7 we monitored just one arcmin field centered on the cluster core. Monitoring was conducted in the band with exposure times ranging from 300 to 500 seconds, depending on the seeing. The median value of the seeing for all of the images used for this survey was 1.52 arcsec. Only two images in the -band were taken during the 1997 season. On two nights in May/June 1998 we collected frames of the cluster field through the and filters using the same instrumentation as in 1997. These exposures were used to derive the color-magnitude diagram for the field monitored in 1997 (see Sect. 4).
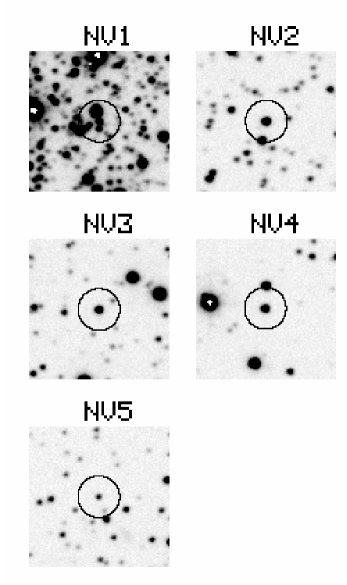
Instrumental photometry was extracted with DoPHOT (Schechter et al. 1993) used in the fixed-position mode. The stellar positions were derived from the reduction of ”template” images, the best individual images obtained for a given sub-field. A total of 15839 stars with were checked for variability. The quality of the derived photometry is illustrated in Fig. 1 in which we plot the rms deviation versus the average magnitude for stars from the northern sub-field. This plot includes 14847 stars with whose light curves contain at least 75 points. Images of stars with were generally over-exposed, and the resulting photometry was poor. To select potential variables we employed three methods as described in some detail in Kaluzny et al. (1996). Light curves showing possible periodic signals or smooth changes on time scales of days to weeks were selected for further examination. A total of 71 certain variables were identified: 65 RR Lyr stars, all of them already known, four previously unknown SX Phe stars, one previously unknown eclipsing binary, and a previously known cataclysmic variable (M5-V101). In Table 2 we list the equatorial coordinates for the 5 newly identified variables. Finding charts are shown in Fig. 2.
| ID | RA(2000) | Dec(2000) |
|---|---|---|
| h:m:sec | deg:: | |
| M5-NV1 | 15:18:22.76 | 02:02:49.3 |
| M5-NV2 | 15:18:11.40 | 02:00:40.6 |
| M5-NV3 | 15:18:40.04 | 01:58:41.6 |
| M5-NV4 | 15:18:41.02 | 01:56:29.6 |
| M5-NV5 | 15:18:39.10 | 02:11:41.0 |
2.1 Transformation to the standard system
Observations of Landolt (1992) standards collected on several nights during the 1997 observing season were used to establish transformations from the instrumental to the standard BV system. The following relations were obtained:
| (1) | |||
| (2) |
For the 1998 season we derived:
| (3) | |||
| (4) |
The extinction coefficients in Eqs. 3 and 4 correspond to the night of May 29/30, 1998, on which we obtained data used to construct the color-magnitude diagram for the field monitored for variables (see Sect. 4). While transforming the 1997 light curves of variables from the instrumental v magnitudes to the standard V magnitudes we used a simplified relation:
| (5) |
This approach was required since no observations of the light curves in the B band were obtained. The constant offset was derived using photometry of non-variable stars with and . The adopted procedure leads to systematic errors not exceeding 0.01 mag.111The color term in Eq. 1 equals 0.010. All variables discussed in this paper have average colors in the range . For RR Lyr variables changes of the color seldom exceed 0.3 mag over the whole pulsational cycle.
2.2 Comparison with previous photometry
The field covered by our survey overlaps the region studied by Sandquist et al. (1996). Unfortunately, it does not include the field observed by Stetson and Harris (1988) and more recently by Johnson & Bolte (1998). Comparison of our BV data with Sandquist et al. (1996) is shown in Fig. 3 (differences are given as ”ours” - ”theirs”). The mean differences for stars with are and , for and , respectively. A systematic trend of residuals with increasing magnitude can be noted in Fig. 3. A similar trend was noted by Johnson & Bolte (1998) who compared their data with Sandquist et al. (1996).
3 Results for variables
Our survey resulted in the detection of five new variables: four SX Phe type stars and an eclipsing binary. Figure 4 shows the location of these objects on the cluster color-magnitude diagram (CMD). For the SX Phe stars the marked position corresponds to the intensity averaged magnitude and to the color measured near maximum light. For the eclipsing binary the marked position corresponds to the magnitude and color measured near the center of the secondary minimum at the orbital phase 0.52. The position of the dwarf nova M5-V101 is also marked in Fig. 4, and corresponds to the magnitude and color measured for that highly variable object on HJD=2450963.57 (May 30, 1998 UT).
The phased light curves of the four SX Phe variables are shown in Fig. 5 and the light curve of the eclipsing binary is shown in Fig. 6. Some basic photometric parameters of the newly identified variables are listed in Table 3. The periods of variability were derived using an algorithm based on the analysis of variance statistic (Schwarzenberg-Czerny 1989).
| ID | |||||
|---|---|---|---|---|---|
| M5-NV1 | 0.04213 | 0.20 | 17.42 | 17.53 | 17.48 |
| M5-NV2 | 0.04130 | 0.28 | 16.75 | 16.77 | 16.76 |
| M5-NV3 | 0.04166 | 0.19 | 16.99 | 17.09 | 17.04 |
| M5-NV4 | 0.04745 | 0.24 | 16.89 | 16.95 | 16.92 |
| M5-NV5 | 0.4663 | 0.43 | 18.91 | 20.07 |
3.1 SX Phe stars
The SX Phe variables are located in the blue straggler region of the cluster CMD. The observed properties of these variables allow their classification as SX Phe stars. Fig. 7 shows the positions of the variables in a period vs. absolute magnitude diagram. The standard relations for SX Phe stars pulsating in the fundamental mode and in the first overtone are also shown (McNamara 1997, see also McNamara 1995). The plotted relation for stars pulsating in the fundamental mode is
| (6) |
and the same relation is used for stars pulsating in the first overtone assuming = 0.778. We also plot the relations for fundamental and first overtone pulsators from Nemec et al. (1994), assuming metallicity of . The absolute magnitudes for M5 variables were calculated assuming a distance modulus of (Harris 1996). It is clear that the only variable in Fig. 7 close to the standard relation for the fundamental mode pulsators is M5-NV1. It is likely that the 3 remaining SX Phe stars are first overtone pulsators. The small amplitudes and the symmetry of their light curves support such a hypothesis, though as McNamara (1997) points out, classification of a star as a first overtone pulsator based only on these criteria is questionable. However, even assuming that the 3 brightest of the 4 identified SX Phe stars are first overtone pulsators, we still face the problem of an apparent over-luminosity of all 4 variables most especially for the Nemec et al. (1994) relations. One possible solution to this problem is adoption of a lower distance modulus for the cluster, , a value entirely discrepant with that adopted by Harris (1996) for this well studied cluster. This would also imply a very low luminosity for the cluster RRab variables of (the average magnitude for RRab stars in M5 is 15.062 (Kaluzny et al. 1999)). Another possibility is that discovered SX Phe stars are not members of M5, it although M5 is at a galactic latitude of deg, and this expalnatgion implies un unreasonably high field surface density for SX Phe stars. One way to resolve this puzzle would be to measure the radial velocities for these variables to check their membership status. A more likely explanation is that the absolute magnitude - period relations are poorly known for stars of such short periods. Indeed, McNamara’s calibration based on Hipparcos measurements has only five stars with periods below log , and the scatter in this region of the calibration is significant. It is hoped that our survey for variable stars in other globular clusters will lead to the discovery of significant populations of SX Phe stars, leading to a more secure calibration.
3.2 Eclipsing binary stars
Variable M5-NV5 is potentially an important object as it may prove to be a detached eclipsing binary composed of two upper-main sequence stars from M5. As such this binary could be used for measuring the distance to the cluster. In addition, the determination of the masses, radii and luminosities of the components of this system is of great interest. However, the present data are not sufficient for a precise determination of parameters of M5-NV5.
To get some hints about the membership status and configuration of M5-NV5, we analyzed the light curve presented in Fig. 6. The light curve was solved using the MINGA package (Plewa 1988) which uses the Wilson-Devinney (W-D) code (Wilson & Devinney 1971, Wilson & Sofia 1976 ) to generate synthetic light curves. The code was used in a mode in which the basic parameters determining the shape of the synthesized light curve are the mass ratio , the potentials and (for a given these determine the relative radii and ), the relative luminosities and , and the inclination of the orbit . During the analysis we fixed the temperature of the primary component at K. According to the derived solution the secondary eclipse is total or very close to total. Hence at an orbital phase of 0.52, at which we measured , only the primary component is visible. Adopting we obtain which in turn implies for an adopted (Alonso et al. 1996; Harris 1996). As we have no information about the mass ratio of the system we calculated a grid of light curve solutions for a set of values of . The results are summarized in Table 4.
| 0.50 | 89.2 | 3.68 | 0.32 | 0.27 |
| 0.60 | 88.9 | 3.78 | 0.32 | 0.27 |
| 0.70 | 87.2 | 3.82 | 0.31 | 0.27 |
| 0.80 | 87.8 | 4.07 | 0.32 | 0.27 |
| 0.90 | 85.9 | 3.45 | 0.30 | 0.28 |
All of the solutions in Table 4 imply that the system is detached with the secondary eclipse being total or very close to total. Based on a criterion, the best solution was obtained for , but solutions derived for other values of are only marginally worse. This is not surprising considering the limited accuracy of the photometry and the detached configuration of the binary. To illustrate the quality of the solutions we plot in Fig. 8 the observed light curve with the synthetic light curve corresponding to . Despite our inability to derive the mass ratio of the system it is safe to state that M5-NV5 is a detached binary with an inclination deg and that the luminosity ratio . The position of the primary component of M5-NV5 on the cluster CMD (see Fig. 4) is consistent with the hypothesis that it is a main-sequence star belonging to the cluster. Finally, we note that the derived values of and favor solutions with (if we assume that both components are main sequence stars). If the system contains two cluster main sequence stars with masses and then the expected semi-amplitudes of their radial velocity curves are and km/sec. In this case the velocity curve of the binary would be relatively easily measured with a medium resolution spectrograph on a large telescope.
In a paper devoted mainly to a photometric analysis of RR Lyr stars in M5, Reid (1996) reported the identification of 4 eclipsing binaries – 2 located on the horizontal branch and 2 located on the giant branch. Subsequently Yan & Reid (1996) used the same observational material to identify 6 short-period eclipsing binaries located on or near the main-sequence of the cluster. None of these 10 candidate variable stars was selected from our data base during our search for variable objects. Our light curves for these stars do not show any sign of variability of the type reported by Reid (1996) and Yan & Reid (1996). At our request Dr. Reid checked his CCD frames of M5. It turned out that the variability of the 4 candidate eclipsing binaries reported by Reid (1996) was due to occasional passages of the stellar images through defective columns of the detector. Our light curves for the 6 candidate variables reported by Yan & Reid (1996) show scatter ranging from 0.04 mag for V6 and V5 to 0.08 mag for V2. None of these light curves show any modulation with the periods or at the amplitudes reported by Yan & Reid (1996), nor with any other periods shorter than the time-base of our observations. This is demonstrated in Fig. 9 in which we show our light curves for stars V1, V2 and V3 from Yan & Reid (1996) phased with the periods listed in that paper.
3.3 The cataclysmic variable M5-V101
M5-V101 is one of two cataclysmic variables which were known in globular clusters in the pre-HST era. It was discovered by Oosterhoff (1941), who suggested that it is a dwarf nova. That suggestion was later confirmed by spectroscopic as well as photometric observations (Margon et al. 1981; Shara et al. 1987). Detection of the X-ray counterpart of M5-V101 was reported by Hakala et al. (1997).
In Fig. 10 we present the -band light curve of M5-V101 based on our observations. The variable displayed two outbursts with full amplitudes of about 2.7 mag during our observations in 1997. On the night of May 30 1998 we observed M5-V101 at and (HJD = 245 0963.57). The occurrence of at least two outbursts on a time scale of 100 days in 1997 as well as the detection by Shara et al. (1987) of a single outburst during a two-week long monitoring period indicates a relatively short duty cycle for M5-V101. Examination of the nightly light curves from the 1997 season reveals occasional variability with a full amplitude of about 0.4 mag on a characteristic time scale of about 3.4 hours. Spectroscopic data presented by Naylor et al. (1989) suggest that the orbital period of M5-V101 is longer than 3.5 hours.
4 The color-magnitude diagram
An extensive and detailed photometric study of M5 based on CCD BVI data was published by Sandquist et al. (1996). Even more recently Johnson & Bolte (1998) reported VI data for a field in the outer part of the cluster. As a by product of our program we obtained a medium-deep CMD for the arcmin field centered on the cluster, shown in Fig. 4. This CMD is based on the following set of images: – 60 s, 150 s, 260 s; V – 60 s, s. The observations were obtained on the nights of 1998 May 30 and June 3. The seeing for these frames ranged from 1.13 to 1.35 arcsec. Photometry was extracted using Daophot/Allstar package (Stetson 1987). Measurements of stars with relatively poor quality (large sigma for a given magnitude and/or a large value of Stetson’s CHI parameter) were rejected from the analysis. Known variables listed in Clement (1997, priv. comm.) or in Sandquist et al. (1996) are not plotted in Fig. 4. The CMD shows several features discussed in some detail by Sandquist et al. (1996). In particular we note the presence of a star lying to the blue of the HB at and . This star is located at angular distance arcmin from the projected cluster center. This does not exclude its cluster membership but clearly additional data are needed to clarify this point. The equatorial coordinates of this star are and . The CMD also includes a faint blue star with = 18.836 and . It is located about 2 magnitudes below the cutoff of the blue horizontal branch of the cluster. This star is marked with the triangle in Fig. 4. Its equatorial coordinates are: and . It is a good candidate for an extreme horizontal branch star. The light curve of this star shows no evidence for variability with a full amplitude exceeding 0.02 mag.
5 Conclusions
The most interesting result of this paper is the identification of a detached eclipsing binary which is most probably composed of two upper main sequence stars from M5. Photometric and spectroscopic follow up observations of this star are planned by our group. Our data indicate that 10 candidate eclipsing binaries reported by Reid (1996) and Yan & Reid (1996) do not show any periodic variability on time scales shorter than about a week. Four SX Phe stars were identified, all located among the blue stragglers on the cluster CMD. Assuming cluster membership, their absolute magnitudes are 0.2-0.3 mag too bright in comparison with the standard relations obtained by McNamara (1997, 1995). Two outbursts of the dwarf nova M5-V101 were detected during the period May-Aug 1997. A faint blue object, which we propose is an extreme horizontal branch star from M5, was identified.
Acknowledgements.
JK and WK were supported by the Polish Committee of Scientific Research through grant 2P03D-011-12 and by NSF grant AST-9528096 to Bohdan Paczyński. WP was supported by the Polish Committee of Scientific Research through grant 2P03D-010-15. We are indebted to Dr. B. Paczyński for his long-term support to this project. We thank Dr. Samus for providing us with equatorial coordinates for M5 RR Lyr variables. Dr. E.L. Sandquist kindly sent us his BVI data for M5. Special thanks are due to Tomek Plewa for his help with the MINGA package. We thank Dr. Neill Reid for examining his CCD frames in detail, and Dr. George Preston for many useful discussions.References
- (1)
- (2) Alonso A., Arribas S., Martinez-Roger C., 1996, A&A 313, 873
- (3) Drissen L., Shara M.M., 1998, AJ 115, 725
- (4) Hakala P.J., Charles P.A., Johnson H.M., Verbunt F., 1997, MNRAS 285, 693
- (5) Harris W.E., 1996, AJ 112, 1487
- (6) Johnson J.A., Bolte M., 1998, AJ 115, 693
- (7) Kaluzny J., Kubiak M., Szymanski M., et al. 1996, A&AS 120, 139
- (8) Kaluzny J., Thompson I., Krzeminski W., 1997, AJ 113, 2219
- (9) Kaluzny J., Olech A., Thompson I., et al. 1999, A&A submitted
- (10) Landolt A., 1992, AJ 104, 340
- (11) Margon B., Downes R., Gunn J., 1981, ApJ 247, L89
- (12) McNamara D.H., 1995, AJ 109, 1751
- (13) McNamara D.H., 1997, PASP 109, 1221
- (14) Naylor, T., Allington-Smith J., Callanan P.J., et al. 1989, MNRAS 241, 25P
- (15) Nemec J.M., Linnell Nemec A.F., Lutz, T.E., 1994, AJ 108, 222
- (16) Oosterhoff P., 1941, Ann. Sterrewacht Leiden 17, No. 4
- (17) Paczyński B., 1997, in The Extragalactic Distance Scale, eds. Livio M., Donahue M., Panagia N., Cambridge Univ. Press, Cambridge, p. 273
- (18) Plewa T., 1988, Acta Astronomica 38, 415
- (19) Reid I.N., 1996, MNRAS 278, 367
- (20) Sandquist E.L., Bolte M., Stetson P.B., Hesser J.E., 1996, ApJ 470, 910
- (21) Schechter P.L., Mateo M., Saha A., 1993, PASP 105, 1342
- (22) Schwarzenberg-Czerny A., 1989, MNRAS 241, 153
- (23) Shara M., Moffat A., Potter M., 1987, AJ 94, 357
- (24) Stetson P.B., 1987, PASP 99, 191
- (25) Stetson P.B., Harris W.E., 1988, AJ 96, 909
- (26) Thompson I., Kaluzny J., Pych W., Krzeminski W., 1999, AJ 118, 462
- (27) Wilson R.E., Devinney E.J., 1971, ApJ 166, 605
- (28) Wilson R.E., Sofia S., 1976, ApJ 203, 182
- (29) Yan L., Reid I.N., 1996, MNRAS 279, 751