Breaking the Disk/Halo Degeneracy with Gravitational Lensing
Abstract
The degeneracy between the disk and the dark matter contribution to galaxy rotation curves remains an important uncertainty in our understanding of disk galaxies. Here we discuss a new method for breaking this degeneracy using gravitational lensing by spiral galaxies, and apply this method to the spiral lens B1600+434 as an example. The combined image and lens photometry constraints allow models for B1600+434 with either a nearly singular dark matter halo, or a halo with a sizable core. If the dark halo has a core, then the bulge dominates the gravitational potential in the inner part of the galaxy, its mass is between 1.3 and , and the disk mass is less then . If the dark halo is singular, there is a degeneracy between the disk mass and the halo ellipticity. The dark halo flattening () can be as low as 0.53 if there is no disk mass, while the maximum allowed disk mass, , is reached with a spherical halo. A maximum disk model is ruled out with high confidence. Further information, such as the circular velocity of this galaxy, will help break the degeneracies. Future studies of spiral galaxy lenses will be able to determine the relative contribution of disk, bulge, and halo to the mass in the inner parts of galaxies.
1 Introduction
The discovery that rotation curves do not fall off near their optical edge (Rubin, Thonnard, & Ford 1978) nor beyond (Bosma 1978) remains the strongest evidence for the existence of dark matter on galactic scales. Still, how much dark matter contributes to the gravitational field in the inner parts of galaxies remains an open question (see Bosma 1998; Sellwood 1998, for recent reviews). One complication, and an unresolved issue in itself, is the three dimensional shape of dark matter halos. Dark halos are usually assumed to be spherical in fitting rotations curves, yet found to be ellipsoidal in N-body simulations (Dubinski & Carlberg 1991; Warren et al. 1992) and in a variety of observational studies (for a recent review see Sackett 1998). In this paper we will demonstrate that constraints on the mass of the disk and the ellipticity of the dark halo can be found by studying spiral galaxies that are strong lenses.
The uncertainty in the relative contributions of the disk, bulge, and halo to the circular velocity is due to our lack of knowledge about the mass-to-light ratios of the disk and bulge, and the profile of the dark halo. One tactic has been to assume the contribution from the disk to the rotation curve is as large as possible; this “maximum” disk hypothesis (Van Albada & Sancisi 1986) then favors a dark halo with a large core radius. Whether or not this is a good assumption is a topic of much debate (Courteau & Rix 1999; Sallucci & Persic 1999). Unfortunately, we can not determine the mass-to-light ratios of the baryons from first principles because they are extremely sensitive to assumptions about the low mass end of the initial mass function (IMF) (Worthey 1994). If we knew the dark matter profile we could determine the mass-to-light ratios by fitting rotation curves and hence constrain the low mass end of the IMF. Thus, identifying the baryonic contribution to the inner rotation curve places important constraints on the IMF, and the profile of dark matter halos. Galaxy formation models (e.g. Dalcanton, Spergel, & Summers 1997; Mo, Mao, & White 1998; Somerville & Primack 1999) assume an IMF and a dark halo profile to predict a range of disk masses for a given halo mass. Thus any measurement of the baryonic mass fraction in a spiral galaxy will test these models.
We will demonstrate how gravitational lensing of spiral galaxies can be used to help determine the relative contributions of the disk, bulge, and halo to the inner parts of spiral galaxy rotation curves. The basic premise is that gravitational lensing is sensitive to the total projected mass and to the combined ellipticity of the mass distribution. Since the projected ellipticities of disk, bulge, and dark halo are in general different, it is possible to constrain their combination.
In Section 2 we summarize some aspects of lensing by disks. In Section 3 we discuss the mass distribution in spiral galaxies and how to measure it with gravitational lensing. In Section 4 we introduce B1600+434, an edge-on spiral galaxy, and discuss its optical properties. In Section 5 we study B1600+434 as a gravitational lens to see what constraints can be placed on its mass distribution. We end with some conclusions and a discussion of the future of this method.
2 Lensing by Disks
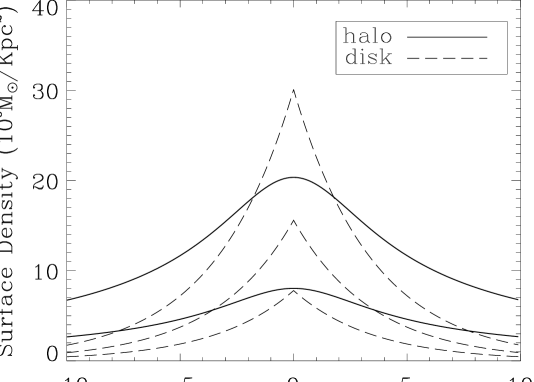
Gravitational lensing by the disks of spiral galaxies has only recently received attention. Originally, spiral galaxies were thought to contribute only 10-20% of the total lensing cross section (Turner, Ostriker, & Gott 1984). Loeb (1996) and Maller, Flores, & Primack (1997) noticed that the projected surface mass density of a nearly edge-on spiral galaxy is comparable to that of an elliptical galaxy with a higher velocity dispersion (see Figure 1).
This leads to an increase of the area inside the inclination averaged caustic of roughly 50% (Maller et al. 1997; Wang & Turner 1997) and a corresponding increase in the expected number of spiral lenses. Spiral galaxies have a higher cross section for high magnification (Möller & Blain 1998) which, when the magnification bias is taken into account, can lead to an increase in the optical depth as large as a factor of three depending on how one models the evolution of disk properties (Blain, Möller, & Maller 1999). However, most of the studied lenses have been identified as early type galaxies (Keeton, Kochanek, & Falco 1998), and do not display the “disk” morphology in which both images are located to one side of the lens (Keeton & Kochanek 1998). A reasonable explanation is that spiral lenses become fainter due to obscuration by dust and thus are not detected in optical surveys (Bartelmann & Loeb 1998). Strong evidence for this hypothesis exists based on the fact that five out of six identified spiral lenses were discovered in the CLASS radio survey (Browne 1998), for which dust obscuration is unimportant.
Two other important effects have not been considered in determining the total optical depth in spiral galaxy lensing. First, the luminosity function, the starting point for determining optical depth, is not corrected for extinction. The Tully-Fisher relation (Tully & Fisher 1977), which relates luminosity to circular velocity, includes an inclination correction, and thus a distribution of inclinations must be included when converting luminosities to circular velocities. When this is done correctly, one finds that massive spiral galaxies inhabit halos with velocity dispersions comparable to those of ellipticals (Gonzales et al. 1999). In addition, galaxies are not isolated systems, and many gravitational lenses are members of groups or small clusters. This should also be taken into effect when calculating the total optical depth.
Regardless of their total optical depth, spiral lenses offer new opportunities to study the distribution of mass in spiral galaxies (Maller et al. 1997; Keeton & Kochanek 1998). Maller, Flores, & Primack (1998) demonstrated that spiral lenses could be used to study the fraction of mass in baryons and the shape and profile of the dark matter halo. Koopmans, De Bruyn, & Jackson (1998) did the first detailed analysis of a spiral lens, the system B1600+434. They showed with numerical models that this spiral galaxy could not have a dark halo with an axis ratio flatter then 0.5, but did not have adequate photometry to constrain the disk or bulge masses. We return to B1600+434 in Section 4.
3 Mass in Spiral Galaxies
3.1 Mass Components
Spiral galaxies are composed of three mass components: disk, bulge, and dark halo (for our purposes we will not consider the contribution to the mass from a gaseous disk). We assume that spiral galaxies have azimuthal symmetry, and thus it is natural to use cylindrical coordinates with the disk lying in the plane. Furthermore, we assume the mass distributions of the bulge and halo have homoeoidal symmetry (the flattening remains constant) such that they can be expressed as functions of the elliptical radius , where . We will use the subscript 3 to distinguish a variable in three dimensional space from quantities projected along the line of sight into a two dimensional plane. Two dimensional quantities are related to their three dimensional counterparts by the projected ellipticity , which is given by
| (1) |
Here is the disk inclination and corresponds to a face-on disk. In the projected plane of the sky the mass components become ellipses that can be represented as functions of , where . Disks are well fit by an exponential profile, while bulges in projection have been fit with a de Vaucouleurs profile (de Vaucoulers 1948) or an exponential profile (De Jong 1994; Courteau, De Jong, & Broeils 1996; Andredakis 1998). By fitting elliptical isophotes to an image of the galaxy we can measure the disk inclination , the projected bulge ellipticity , and the disk and bulge scale lengths.
The amplitude of the dark halo contribution to the circular velocity (outside the region where the disk and bulge contributions are important) can be measured from the rotation curve, but its core radius, , and ellipticity, , are not directly observable. Thus, there are nine parameters which determine the mass distribution in a spiral galaxy: a length, a mass, and an axis ratio (inclination in the case of the disk) for each component. Five can be directly measured, but four must be determined from other constraints. The inner part of the rotation curve effectively gives only one additional constraint as the dark halo profile is already chosen to produce the correct shape. The rotation curve gives no constraint on the dark halo flattening and thus leaves a degeneracy between the disk mass, bulge mass and dark halo core radius. To break this degeneracy one must measure the potential gradient in an orthogonal direction providing a different combination of these parameters. One way to do this is with gravitational lensing.


3.2 Mass from Lensing
Gravitational lensing has become one of the primary tools for measuring mass in astronomy (Narayan & Bartelmann 1999). For galaxies, lensing has been used to study the extent of dark halos (Hudson et al. 1998; Dell’Antonio & Tyson 1996; Brainerd, Blandford, & Smail 1996), to measure the evolution of the fundamental plane of ellipticals (Kochanek et al. 1998), and the mass-to-light ratio of early type galaxies in clusters (Natarajan et al. 1998). In these cases the mass distribution is close to circular and the only property that can be rigorously determined is the total mass inside some radius. With circular symmetry only the total mass enclosed determines the gradient of the potential as stipulated by Gauss’ Law. In the case of edge-on spiral lenses the situation is different.
A circularly symmetric lens must produce images that are collinear with the center of the mass concentration. Ellipticity in the mass distribution pushes the line joining the two images to one side of the mass distribution, and the larger the ellipticity the farther this line moves from the lens center. This is illustrated in Figure 2 where we show the image configuration for an isothermal mass distribution with a spherical and with a flattened shape. The position of one image is kept constant; with the introduction of ellipticity into the mass distribution, the other image moves away from the lens center. If the ellipticity causes the source position to cross a caustic then four images will be produced whose positions can also be used to measure the ellipticity of the mass distribution. Thus with spiral lenses there are two strong constraints from a lensing analysis: the total mass and the combined ellipticity of the projected mass. As we expect the disk, bulge, and halo to have different ellipticities, this gives a different constraint on their combination than the total mass alone. Since we can not measure the ellipticity of the dark halo, there exists a degeneracy between a more massive disk and a more flattened halo; however, as we will show in the case of B1600+434, these can be separated since they contribute differently to the circular rotation at the outskirts of the disk.
4 B1600+434: Observations and Analysis
B1600+434 was first identified as a doubly imaged quasar with a source redshift and an image separation of 14 (Jackson et al. 1995). Jaunsen & Hjorth (1997) identified the lens as an edge-on spiral galaxy. Fassnacht & Cohen (1998) measured the lens redshift to be 0.41. Koopmans et al. (1998) using an band WFPC2 image of the lens galaxy were able to show that the dark matter halo was no flatter then . They were not able to constrain the mass in the disk because the disk and bulge parameters were not extractable from the image photometry.
As part of the CASTLES project (Munoz et al. 1999), four 640 second images were taken with NICMOS’s NIC2 camera in the Band. These images were drizzled (Fruchter & Hook 1998) to give 37.5 mas per pixel resolution. The images were fit with a PSF-convolved 2D bulge+disk model (GIM2D: Simard 1998; Marleau & Simard 1998) to determine the optical properties of the galaxy, many to a few percent accuracy (Table 1). We find that the bulge is well fit by an exponential profile, but not by a de Vaucouleurs profile.
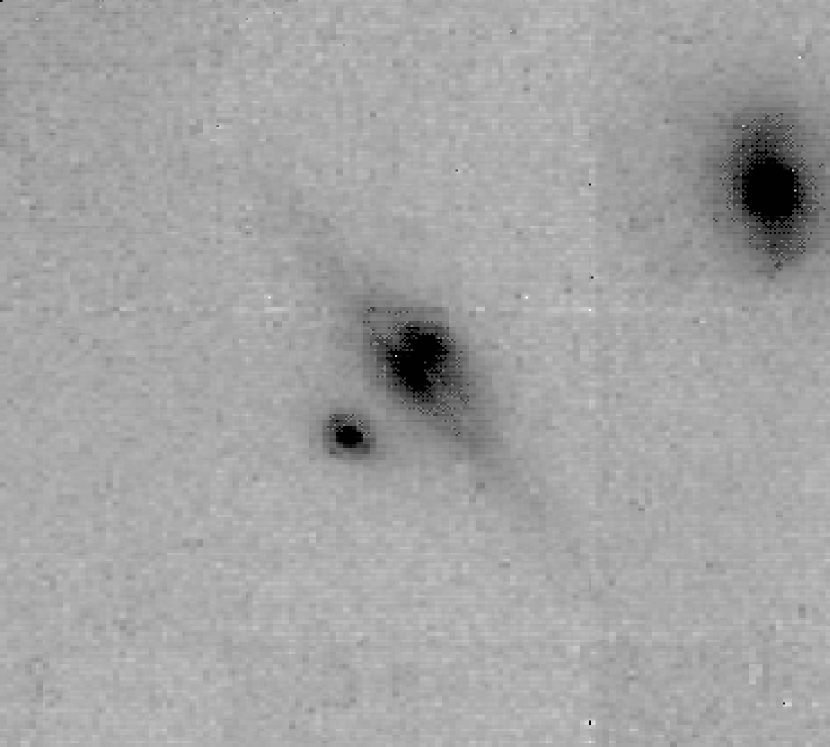
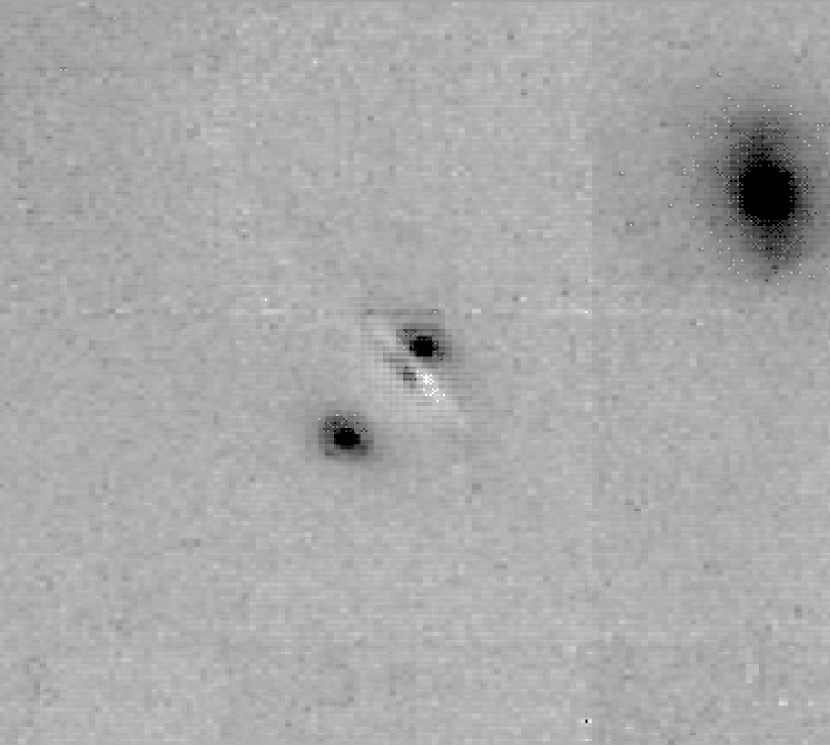
Figure 3 shows the NICMOS image and the same image with the galaxy subtracted. The pixels in the dust lane are masked out when using GIM2D to model the light distribution, so that when the lens galaxy surface brightness model is subtracted from the image the dust lane produces a clear residual. Thus the results shown in Table 1 are with the dust lane removed. One also sees a companion galaxy 435 from the center of the lens galaxy. This galaxy is well fit by a de Vaucouleurs bulge and an exponential disk and has an -magnitude of 17.3.
The total luminosity of the lens galaxy is 17.8 magnitudes in the observed band. To compare with local galaxies we would like the rest frame luminosity of the lens galaxy in the I band. From Poggianti (1997) we see that the K correction and evolution correction for an Sa galaxy is -.2 and -.4 magnitudes respectively, and the I-H color is 1.35 mag. Taking and H km s-1Mpc-1 this implies an absolute magnitude or where we have made no extinction correction. We can then estimate the rotation velocity of this galaxy using the band Tully-Fisher relation (Bernstein et al. 1994). Assuming no dust correction is necessary once the dust lane is removed, the corresponding Tully-Fisher velocity is km s-1. If instead we make the full dust correction suggested by Bernstein et al. (1994) which amounts to 1.2 mag for this galaxy’s inclination, the Tully-Fisher velocity becomes km s-1. Either of these assumptions is probably extreme so we expect these values to bracket the true value.
Table 1 shows that the disk and bulge PA (clockwise from North) are not perfectly aligned. In this analysis we force the bulge and disk PA to be aligned and take the best value to be . Table 1 gives us four of the mass distribution parameters; unfortunately at this time there is no measure of the circular velocity of the galaxy, so there remain five unknown parameters. We only get three strong constraints from the lensing analysis, so we expect a plane of solutions.
| Property | best fit | 99% lower bound | 99% upper bound |
|---|---|---|---|
| Total Luminosity (mJy) | 0.0990 | 0.0984 | 0.0999 |
| Bulge Fraction | 0.5712 | 0.556 | 0.586 |
| Bulge Half Light Radius (arcsec) | 0.504 | 0.494 | 0.514 |
| Bulge Ellipticity () | 0.728 | 0.704 | 0.750 |
| Bulge PA (degrees) | 24.4 | 27.1 | 22.9 |
| Disk Scale Length (arcsec) | 1.35 | 1.33 | 1.36 |
| Disk Inclination () | 81.7 | 81.2 | 82.1 |
| Disk PA (degrees) | 44.4 | 44.9 | 44.1 |
5 Modeling B1600+434 as a gravitational lens
There are five unknown parameters in the mass distribution of this spiral galaxy: the masses of the disk and bulge, or equivalently, their baryonic mass-to-light ratios, the dark halo flattening , core radius , and circular velocity . To model the dark matter we will use the standard Pseudo Isothermal Elliptical Mass Distribution (PIEMD: Kassiola & Kovner 1993; Kormann, Schneider, & Bartelmann 1994), which has the form
| (2) |
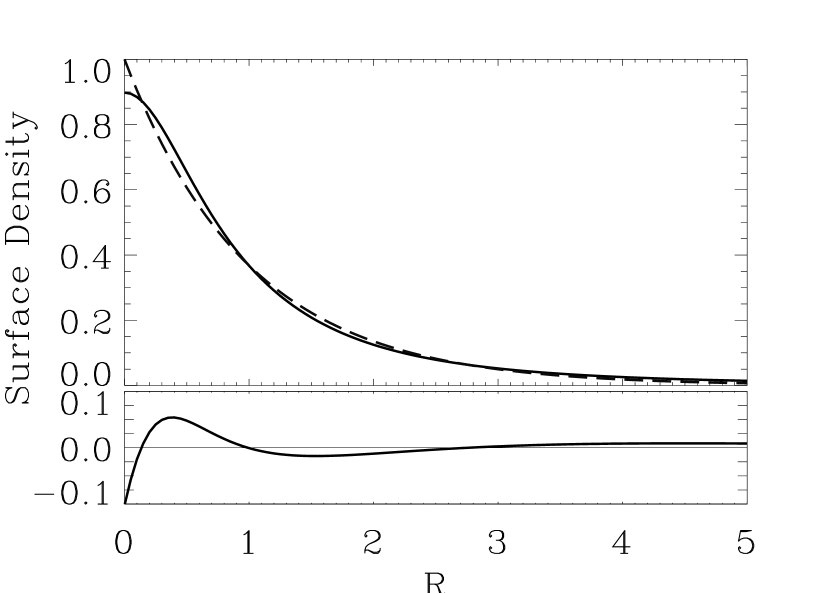
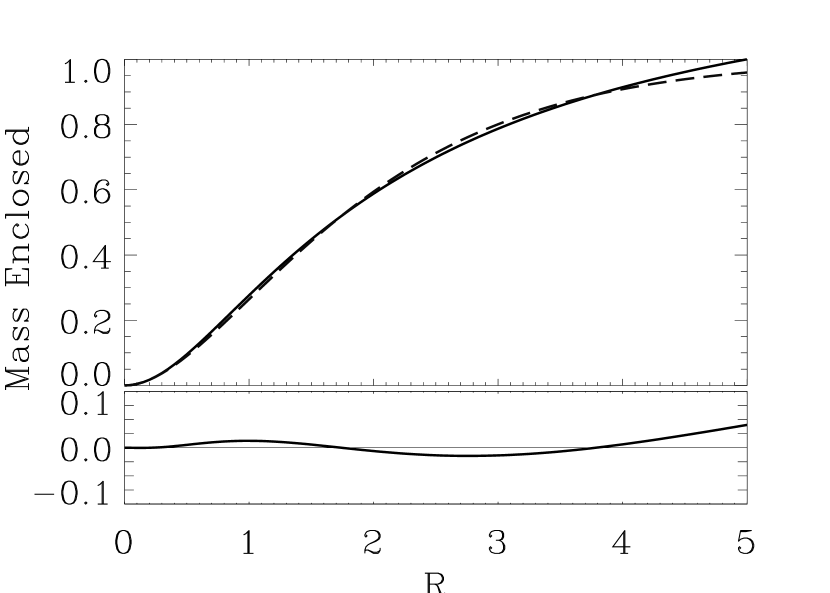
We use what we call the chameleon profile to model the exponential profiles of the disk and bulge. This profile contains two scale lengths that can be tuned to mimic a number of commonly used density profiles (Maller 1999; Hjorth & Kneib 1999; Keeton & Kochanek 1998). Its surface density distribution is given by
| (3) |
where choosing and closely follows an exponential out to five scale lengths (Figure 4). Its lensing properties are analytic, and it deprojects into the three dimensional distribution
| (4) |
which is just the difference between two PIEMDs.
5.0.1 Confidence Levels
A double image lens gives five constraints on a lensing model: four positions and one flux ratio. As stated above there are five unknown parameters in the mass model of the lens galaxy as well as the unknown source position. This leads to seven free parameters and only five constraints, so from the lens modeling itself it is not possible to determine the mass parameters without including additional information. Our goal is to demonstrate that to fit a lensing model introduces new and different constraints on the mass parameters then derived from rotation curves alone. For this purposes we will assume some of the mass parameters have been determined by some other means (observational or theoretical), and test them against B1600+434. Thus we will assume that these parameters are not being determined from the lensing analysis and thus do not contribute to the degrees of freedom. This reduces the number of free parameters to five, and we will show plots where an additional one or two parameters have been set to a specific value in order to use as a confidence level estimator. We minimize the free parameters using the Numerical Recipes routine amoeba.f (Press et al. 1992). Because our model is under-constrained it is possible to find combinations of parameters that come arbitrarily close to the observables (). These values, however do not have the statistical significance of a best fit and thus we avoid quoting them in this paper.
For the observables we use the flux ratio as measured in the radio, which ranges from 1.2 to 1.3. We adopt the value of as Koopmans et al. (1998) did, where the uncertainty includes the effect of time variability. From the NICMOS image we get accurate distances between the lens center and the two images; Table 2 lists the positions of the quasar images and the companion galaxy (SE) relative to the lens center. The axis is taken to lie along the major axis of the disk. Our measured separation between the two images is consistent with that measured in the radio, (Jackson et al. 1995). As mentioned above, the lensing model strongly constrains only the amplitude and ellipticity of the mass distribution, so we expect a solution space where one can trade off the ellipticity of the halo with more mass in the disk or bulge. For clarity we first model the system with one PIEMD as is usually done for elliptical lenses. This situation can be thought of as the combinations of disk, bulge and halo masses that give a perfectly flat rotation curve.
We treat the companion galaxy as a singular isothermal sphere with a circular velocity 200 km s-1 as suggested by its band luminosity (Koopmans et al. 1998) and at the redshift of the lens. For comparison we include some results that do not include the companion galaxy. The effect of the companion galaxy is to increase the combined ellipticity of the lens galaxy needed to produce the observed image configuration.
| Object | x (arcsec) | y (arcsec) | length (arcsec) |
|---|---|---|---|
| A | |||
| B | |||
| SE |
5.0.2 Cosmology
We do our calculations using , and the full beam approximation (Schneider, Ehlers, & Falco 1992). Changing to a different cosmological model has a small effect on our analysis. The corrections introduced by going to are less then 15%. The largest effect of cosmology is determining the angular diameter distance to the lens and hence the conversion from arc seconds to kpc. At the redshift of the lens kpc for and 6.0 kpc for with a Hubble constant of 60 km s-1 Mpc-1. Thus, if the cosmological constant is small, all masses and lengths can be roughly adjusted to the cosmology of one’s choice by multiplying by where is the number of kiloparsecs that one arc second corresponds to at the redshift of the lens in the chosen cosmology.
5.1 The one PIEMD fit


The PIEMD by itself produces an excellent fit to the image positions and flux ratio as has been shown for many elliptical lenses (Keeton et al. 1998). Aside from the combined effect of the three mass components, this model can also be thought of as a mass distribution in which the disk and bulge make a negligible contribution. With the latter perspective, this model represents the greatest possible contribution of the halo to the total mass, and the maximum ellipticity of the halo, since the halo solely causes all the lensing. Contours of of 2.3 and 6.17 corresponding to 68% and 95% confidence limits for 2 d.o.f. are shown in Figure 5. This gives strict upper limits on the halo velocity of 320 km s-1 and on the core radius of or kpc, and a lower limit of the dark halo flattening of , in agreement with Koopmans et al. (1998). Note that this small value for implies that the rotation curve of this galaxy does not fall off towards its center.
Also shown are the same contours when the companion galaxy is not included in the lensing analysis. Since the direction from the lens center to the companion galaxy is nearly perpendicular to the plane of the disk, its contribution to the ellipticity of the projected mass tends to counteract that of the lens galaxy. Thus the companion galaxy causes the lens galaxy to be more flattened in order to produce the same image configuration. The companion galaxy also contributes to the total mass, reducing the amount that is associated with the lens galaxy by km s-1. It is interesting to note how the rotation velocity and core radius of this model are typical for elliptical lenses (Kochanek et al. 1998), confirming our earlier assertion that an edge-on spiral galaxy lenses like a more massive elliptical galaxy.
5.2 Adding the bulge and disk

We now add the bulge and disk to our analysis by adding two chameleon profiles tuned to match the observed exponential profiles of the disk and bulge. Because the scale lengths and axis ratios are measured this introduces only two new free parameters: the disk and bulge masses. We continue to use a PIEMD to represent the dark halo, so that now there are five mass parameters in the model. We thus choose to examine two fixed halo ellipticities that bracket the range of solutions and will leave us with 1 d.o.f.
Figure 6 shows the 95% confidence contours () in bulge mass versus disk mass for a spherical halo (), a flattened halo (), and also for the spherical case with no companion galaxy. The effect of the companion galaxy is to reduce the necessary total projected ellipticity of the lens galaxy, as also demonstrated above. Thus from here on we will conduct our analysis only with the companion galaxy included, noting that if the companion’s redshift or mass is different than we have assumed the effect can be compensated by an adjustment in the ellipticity of the dark halo.
Figure 6 shows that, as mentioned earlier, there is a large degeneracy in the solution parameters. If we restrict ourselves to oblate spheroids, the disk and bulge masses are only required to lie below and respectively. Although the disk and bulge masses are not uniquely determined, it is clear how they relate to the halo’s properties. For the spherical halo, , the ellipticity comes from just the disk and bulge. Thus a linear relationship exists such that a decrease in disk mass must be met with an increase in bulge mass to produce the observed total ellipticity. On the other hand, for a flattened halo, , the disk is no longer required to match the ellipticity and is limited to less then . Instead the bulge and halo have a linear relationship such that their combined mass produces the observed image separation. Thus the upper limit on the bulge mass arises when the bulge itself is massive enough to produce the image separation.
One can ask if there are regions in the solution space where the dark matter contribution in the center of the galaxy is small. It turns out that if the bulge mass is greater than , the core radius of the dark halo may be , but for values of the bulge mass less then this, it must be close to zero: . The image separation demands a great deal of mass in the center of the galaxy, as was shown for the single PIEMD. The disk can not provide this mass because it increases the combined ellipticity, so if the bulge mass is not sufficient, the dark matter must provide the rest. Core radii between are excluded because they produce a flux ratio inconsistent with the observations. Thus the solutions are easily divided into two types: those with small (less than ) and large (greater than ) core radii.


Figure 7 shows rotation curves for large, kpc, and small, kpc, core radii. Since the more distant image is only from the lens center, we are not probing out past this distance in our lensing analysis; however, to compare with local rotation curves we continue the mass model out to . We exclude solutions that do not resemble local rotation curves by showing no evidence for dark matter in their outer parts. This amounts to values of greater than , or less than 150 kms-1. Each component is represented by two lines in Figure 7 that bracket the range of values it may have subject to the above restrictions and matching the lensing constraints. In the right panel the halo is kept spherical to show the lower bound on the disk mass. If the halo is allowed to be flattened, there is no longer a need for any disk mass, a solution with just the flattened halo is possible (the dash-dot-dot-dot line). In all cases the rotation curve reaches 270-295 km s-1 at , but can vary from 250 to 305 km s-1 at depending on which component is dominant. These values are well bracketed by the Tully-Fisher estimates we derived in Section 4 and seem to correspond to a more reasonable amount of extinction correction.
5.3 Mass-to-Light Ratios

The last piece of information that can be provided by analyzing B1600+434 is the mass-to-light ratios (M/L) of the bulge and the disk. These mass-to-light ratios should reflect the baryonic component in the galaxy since only baryons cool to form disks and bulges in the cold dark matter paradigm. Figure 8 shows the mass-to-light ratios of bulge versus disk in solar units for the 95% confidence level solutions to the lensing analysis that also produce good rotation curves. The separation between large and small core radii is now clearly seen, with the large core radius case corresponding to a higher bulge M/L.
We have not made any correction to the luminosity for extinction aside from removing the dust lane, so the values of M/L for the disk should be taken as upper limits. With some knowledge of the mass-to-light ratios of the disk or bulge it is possible to further constrain the solutions. Older stellar populations have higher mass-to-light ratios, so we would expect the bulge to have a higher mass-to-light ratio than the disk. Extinction in the disk is probably less then a factor of two, which would exclude solutions with a disk M/L more then twice the bulge M/L, or disk masses above . Worthey (1994) modeled the mass-to-light ratio for old and intermediate age stellar populations with a range of metalicities [Fe/H]. His lowest M/L in the band is 0.9 which provides a conservative lower limit on the bulge M/L. From Figure 8 one sees that this constrains the disk mass to less than . Bottema (1999) derives a disk M/L from stellar velocity dispersions of local spiral galaxies. This seems to disfavor the large core radii solutions which have disk M/L , which is an upper limit as there is probably some extinction due to dust. Thus for this lens system, while considerations of the mass-to-light ratio constrain the solution space, they do not distinguish between the different types of solution: large or small core radius and flat or spherical halo.
6 Discussion
Our analysis of B1600+434 assumes that the mass in the system can be accounted for by a constant M/L for the disk and the bulge, a dark halo that is centered and has the same orientation as the disk, and mass associated with the companion galaxy. If the mass in the bulge or disk does not follow the observed light distribution, then we are unable to constrain the model. Since B1600+434 has a close companion, it is possible that their dark halos have merged to form a common halo, centered somewhere besides the center of B1600+434. However, since neither galaxy appears disturbed, we feel justified in assuming that the dark halos are not interacting and are thus centered and aligned with the light distribution.
Our purpose here has been to discuss the importance of spiral lenses in determining the relative masses of the disk, bulge, and halo. We have analyzed B1600+434 to give the reader an understanding of how the method works and also some of its limitations. Because only the total mass and combined ellipticity are strongly constrained there will always be degeneracies in the combination of disk, bulge, and halo masses that produce the observed image positions. Considerations of the flatness of the rotation curve or of the mass-to-light ratios can be used to further constrain the solutions.
Two types of solution seem tenable for the galaxy B1600+434 based on the lensing analysis, and including our restrictions based on flat rotation curves. One is a large dark halo core radius with a corresponding bulge mass of and disk mass of . The other is a nearly singular dark halo with the combined ellipticity coming from either the disk or a flattened dark halo. There are three observations that will help to restrict the solutions further. First, a redshift for the companion galaxy will establish its contribution to the lensing. Second, a measure of the rotation velocity of B1600+434 can be used to distinguish between the different types of solutions. These solutions produce a circular velocity at two disk scale lengths ranging from 240 km s-1 to 310 km s-1. Solutions with a large bulge mass produce lower circular velocities because the potential falls off the fastest for the bulge. The highest values for the circular velocity are reached with the heaviest dark halo since its contribution does not fall off. Lastly, measuring a time delay for this system will reduce uncertainties in the flux ratio of the images, and measure the potential of the mass distribution. The models shown in Figure 8 produce time delays ranging from days. The large core radii solutions favor longer time delay days, but uncertainty in the value of the Hubble constant will make it unlikely that this measurement will be able to differentiate between models.
Our analysis of B1600+434 cannot determine whether baryons or dark matter play the more important role in the center of this galaxy. However, it does rule out solutions which have both a large core radius for the dark halo and a massive disk. Of course the details of our results depend upon the radial profile we have assumed for the dark halo. This, of course, is only one galaxy and it would be premature to draw any strong conclusions from its analysis. Our point here has not been to resolve the disk/halo debate, but to demonstrate that spiral galaxy lensing will contribute valuable information to it. When a larger sample has been analyzed, we will learn about mass-to-light ratios of disks and bulges, the flatness of the dark halo inside one disk scale length, and the relationship between the baryonic and dark components in spiral galaxies.
Acknowledgments: We would like to thank Nicole Vogt, whose introduction of AHM and LS made this project possible; Tsafrir Kolatt for many helpful suggestions during the course of the project and James Bullock and Risa Wechsler for stimulating conversions. Also we would like to thank Paul Schechter for his kind advice, and the referee, Rennan Barkana, whose comments improved the clarity and presentation of this paper. AHM acknowledges support from GAANN and a NASA ATP grant at UCSC. LS gratefully acknowledges financial support from a postdoctoral fellowship from the Natural Sciences and Engineering Research Council of Canada. JH acknowledges support from the Danish Natural Science Research Council (SNF). AOJ acknowledges support from the Centre for Advanced Study, Oslo. JRP acknowledges support from NSF and NASA grants at UCSC, and RAF acknowledges support from NSF and UM Research Board support at UMSL. The bibliography was prepared using Jonathan Baker’s Astronat package.