Spectral Aspects of the Evolution of Gamma-Ray Bursts
Abstract
A review on the spectral and temporal properties of gamma-ray bursts is given. Special attention is paid to the spectral evolution of their continuum emission and its connection to the time evolution of the intensity. Efforts on systematizing these observations as well as the effects due the limitations of the current detectors on the observed sample are discussed. Finally, physical models that aim at explaining the observations, are addressed.
Stockholm Observatory, SE-133 36 Saltsjöbaden, Sweden
1. Introduction
The discovery of gamma-ray bursts (GRBs) at the end of the 1960’s (Klebesadel, Strong, & Olson 1973) revealed a phenomenon which has been unwilling to allow us to gain a clear insight into its origin. Until the recent attention given to the GRB afterglow emission (see, e.g., Metzger et al. 1997) the prompt non-thermal flash of gamma-rays has been the main source of information. The data collected by the Compton Gamma-Ray Observatory, CGRO (Fishman et al. 1989) and the BeppoSAX (Boella et al. 1997) satellites, have given an unprecedented wealth of data. This has led, after an initial phase of confusion, to a more detailed knowledge, for instance, of the spectral shape and its evolution in time. The observed gamma-ray light curves exhibit a large diversity in duration, strength, and morphology. Some are very complex, having stochastic spiky structures, while others are smooth and have only a few, well-shaped pulses. The duration of the gamma-ray emission ranges from as short as a few milliseconds up to several hundreds of seconds. The spectra, even though not as diverse in their characteristics as the light curves, have not given any clear signature of the underlying physical emission process(es). The spectra have a non-thermal appearance and can evolve considerably during the burst. Undoubtably, the key to the understanding of the phenomenon lies in this spectral behavior.
Is the large diversity mainly due to varying physical properties of the source or is it due to other effects such as different appearances to the observer? Are there any characteristics that can correctly describe the GRB temporal behavior and do these have typical values for all GRBs. In other words, how broad are their true, intrinsic distributions? Much study has been devoted to the search for empirical relations and correlations between observable quantities, and to systematize the diverse appearances of the data. Correlations for both large ensembles of GRBs and within individual bursts have been studied. This is a natural step in astronomy and can be compared to the early advances in our understanding of stellar evolution using the optical color-color diagrams, and, for instance, using the Hertzsprung-Russell diagram of globular clusters to determine their ages. The behavior of low-mass X-ray binaries is studied in X-ray color-color diagrams leading to the classification of the sources into two populations based on their behavior in the diagrams: Z sources and atoll sources. In this review, the study of the temporal-spectral behavior within individual bursts will be addressed. It will mainly concern the efforts to understand the continuum spectral shape and its evolution in time. These results should trigger and guide theoretical work and lead to physical models capable of reproducing the observed features.
In §2, the main features of the light curves and spectra as observed to date, are summarized followed by a description of the spectral evolution in §3. This is succeeded by a discussion on how the spectra and the intensity evolve relative to each other in §4. §5 is devoted to a discussion on different aspects of the observations which could affect the results. Finally, an overview discussion on the constraints put on the physical models describing the data is given in §6.
2. Burst Properties
In the following, the photon flux will be denoted by (photons cm-2 s-1) and its spectrum by (photons cm-2 s-1 keV-1) and correspondingly, the energy flux by (keV cm-2 s-1). Intensity will denote a general flux entity and not necessarily the intensity-entity usually used in astronomy. In GRB astronomy the sources are not resolved, thus making it less meaningful. The terms light curve and time history will be used synonymously with the time evolution of the intensity. The hardness of the spectrum will refer to the overall spectral property of the burst, mainly the peak energy of the power output. A power-law spectrum is steep if it is dominated by soft photons and flatter as the fraction of hard photons increases.
2.1. Gamma-Ray Burst Light Curves
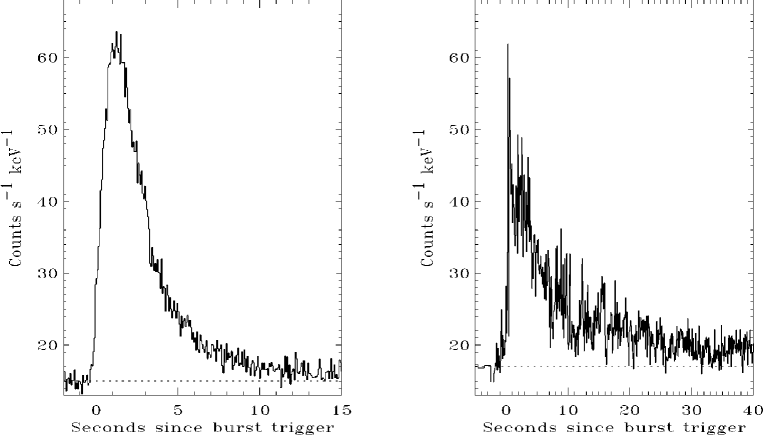
A remarkable feature of the observed properties of GRBs is the large diversity of the light curves, both morphologically and in strength and duration111This has been summarized as: ‘Have you seen one, you have seen one’. Several examples of light curves, observed by the Burst and Transient Source Experiment (BATSE) on the CGRO will be presented in this paper (Figure 1, Figure 5, and Figure 9a; see, e.g., the current BATSE catalog222The BATSE GRB catalog is available online at: http://www.batse.msfc.nasa.gov/ data/grb/catalog/.). Different approaches to the understanding of the light curve morphology have been pursued. It is generally believed that the fundamental constituent of a GRB light curve is a time structure having a sharp rise and a slower decay, with the decay rate decreasing smoothly (e.g., Fishman et al. 1994; Norris et al. 1996; Stern & Svensson 1996). This shape is denoted by the acronym FRED, fast-rise and exponential-decay, even though the decay is not necessarily exponential. A burst can consist of only a few such pulses, clearly separable, producing a simple and smooth light curve, as in the left-hand panels in Figure 1 and Figure 9a. More complex light curves, such as in Figure 5 are superpositions of many such fundamental pulses. Mixtures of the two types are also common. Such interpretations have been shown to be able to explain and partly reproduce many observed light curve morphologies. To reveal the underlying process of GRBs, the fundamental pulses are of extra interest as they will show the clearest signature of the physics. To model pulses, often a stretched exponential is used: exp , where is the time of the pulse’s maximum intensity, are the time constants for the rise and the decay, and is the peakedness parameter. Such a function gives a flexibility to describe most pulses, and to give characteristics of the pulses for statistical analysis. Norris et al. (1996) studied a sample of bursts observed by the BATSE Large Area Detectors (LADs) and stored in the four energy channel data type333For the different data types from BATSE, see, e.g., Fishman et al. (1989). They modeled the light curves in detector counts in the four channels separately and found that the decay generally lay between a pure exponential () and a Gaussian (). Lee et al. (1998) studied approximately 2500 individual channel pulse structures in the high time resolution BATSE TTS data, using this general stretched exponential function and confirmed the general behavior that pulses tend to have shorter rise times than decay times. Norris et al. (1996) also used the stretched exponential to create an algorithm to separate overlapping pulses based on fitting. Another pulse-identification algorithm was introduced by Li & Fenimore (1996) and similarly by Pendleton et al. (1997), who identified pulses based on the depth of the minima between peaks, which has the advantage that it does not depend on any particular peak shape.
The large amplitude variations observed within a burst is demonstrated by Stern (1999) who shows a few examples of GRB pulses with near-exponential tails that are traceable over almost 4 orders of magnitude in intensity. Schaefer & Dyson (1996) studied the decay phase of 10 smooth FRED pulses in the four separate energy channels and found that most of them are not exponentials, although a few cases come close. A power-law fit passes most of their statistical tests.
Most studies use the LAD 4 spectral channel data, with the channels covering approximately 20-50 keV, 50-100 keV, 100-300 keV, and 300 keV - 2 MeV. Often the studies make use of individual channels or the sum of channels 2 and 3 (50-300 keV) in count space, without using detailed knowledge of the spectral behavior. Frequently, the count rates are normalized in the four channels. It is, however, of interest to study the intensity curve in photon flux for the maximal available energy band-width instead of detector counts to get physical values on the fitted parameters. This is done by correctly considering the effects of the detector response. The spectra must then be deconvolved for every time bin, for instance, using direct inversion techniques, which can be model independent (Loredo & Epstein 1989). Alternatively, forward-folding techniques can be used, fitting an empirical spectral model to the data by minimizing the between the model count spectrum and the observed count spectrum. Ryde & Svensson (1999b) used the LAD 128 spectral channel data, between 25-1900 keV, to study GRB pulses in photon flux. They identify a subgroup of pulses for which the early intensity decay follows a power-law, , where the time coordinate, , is taken from the maximum of the light curve and is the time constant. This behavior changes eventually into a faster decay such as an exponential. A detailed discussion on this issue is given in .
The light curve has also been described as having an overall envelope with a FRED-like shape (see, e.g., Fenimore et al. 1996). The actual light curve can either follow the envelope closely or have more or less strong deviations, giving rise to a stochastic, spiky appearance, see Figure 1. In that model, even a simple pulse is thus not caused by a single event but is the result of several.
There has also been a proposal that the light curve can be decomposed into two uncorrelated radiation components, which dominate different parts of the spectrum and behave differently (Chernenko & Mitrofanov 1995). The corresponding spectral behavior has also been studied by Chernenko et al. (1998) who model the spectrum with 9 parameters, describing the two emission components. The authors studied approximately 10 strong BATSE bursts, which could all be explained by the model.
In several works, the averaged behavior over the entire burst has been studied. By aligning the light curves (summed over all four LAD channels) to the time of the peak of the event, the averaged, peak-aligned profile is obtained. This has been done by, for instance, Mitrofanov et al. (1994, 1996), Norris et al. (1994), Stern (1996) and Stern et al. (1997, 1999). Stern (1996) showed that the averaged, peak-aligned profile has an overall stretched exponential form with the index . Another alternative average is the averaged, duration-aligned profile, which is obtained by aligning the time structure by setting the durations to a standard duration. The decay is then found to fit a linear function in time, but not to exponentials and power-laws (Fenimore 1999).
A general remark on the time histories is that there are no typical starting points of the emission that, for instance, could be associated with the primary event.
2.2. Gamma-Ray Burst Spectra
Pre-BATSE Results.
Important results concerning the GRB spectrum were obtained with a number of experiments prior to the CGRO, such as IMP 6 (Cline et al. 1973) and IMP 7 (Cline & Desai 1975), SIGNE/Venera (Chambon et al. 1979), KONUS/Venera (Mazets et al. 1982), the GRS/Solar Maximum Mission (Matz et al. 1985), and Ginga (Yoshida et al. 1989). The results of these experiments indicated that the spectral continuum, in the keV to MeV range, consisted of three major components: (i) a low-energy component resembling the thermal bremsstrahlung spectrum (with a Gaunt factor of 1) of an optically-thin hot plasma (e.g., Rybicki & Lightman 1979): exp, where is the spectral energy, and is the -folding energy. (ii) a steep high-energy power-law with no obvious cut-off, . Matz et al. (1985) showed that 60 of their sample had emission above 1 MeV. (iii) an X-ray component ( keV) which resides 1-2 of the total power. There were also several reports of emission and absorption features. Mazets et al. (1981) presented observations of features from the KONUS/Venera and Hueter et al. (1987) from HEAO-1. Additional reports on spectral features were given by Muakami et al. (1988) from the Ginga observations.
BATSE Results.
The BATSE detectors ( keV) have given a large data base, which refined these results. Palmer et al. (1994) studied 192 bursts with the spectroscopy detectors (SDs). The SDs have the ability to see spectral lines with the characteristics reported by Ginga. No convincing line features were found in the BATSE data, ruling out the previous results. This result is confirmed by the high energy resolution TGRS (transient gamma-ray spectrometer) on the WIND spacecraft (Palmer et al. 1996; Seifert et al. 1997). It now seems likely that if line features exist they are very rare. Briggs et al. (1998) and Golenetskii et al. (1998) report on a few possible candidates from BATSE and KONUS/WIND, respectively. Pendleton et al. (1994) found that broad cusps in the energy range 40-100 keV, could be explained by a superposition of hard and soft spectral sub-components. This was also suggested within the picture presented in Ryde & Svensson (1999a). A detailed discussion on the methodology of identifying line features in gamma-ray spectra and a review of the field is given in Briggs (1999).
Schaefer et al. (1992) and Band et al. (1993) studied the continuum spectral shape of the BATSE bursts. The latter study comprised a sample of 54 BATSE bursts and successfully fitted most spectra with an empirical model similar to the optically-thin bremsstrahlung spectrum previously used; a low-energy power-law exponentially joined together with a high-energy power-law. The success of this model, fitting both the time-integrated spectra and the time-resolved spectra, has led to a wide spread use and it is often referred to as the ‘GRB-function’ or the ‘Band-model’:
| (1) |
where is the -folding energy (in units of keV), and
| (2) |
with being a continuous and a continuously differentiable function. Often the energy at which the power is maximal, (the peak in the logarithmic -spectrum), is used as the measure of spectral hardness, and not . A power peak exists only in the case of . The Band et al. (1993) study did not identify any universal values for the GRB-function parameters, which were found to have a large diversity. The peak energy lies mainly in the interval 100 keV to 1 MeV, clustering around 100-200 keV. The study also confirmed the existence of a hard tail. In a recent study by Preece et al. (1999), the mean of the distribution of the peak energies was determined to be .
The GRB-function index, , shows a broad peak between and , instead of the universal value earlier claimed of (Band et al. 1993), while the high-energy power-law index, clusters fairly narrowly around , even though there exist super-soft bursts with (Preece et al. 1998a). Schaefer & Walker (1999) noted, for instance, that the spectrum of GRB 920229 has an extremely sharp high-energy cut-off. Some studies have tried to identify statistically averaged shapes by various methods of averaging the spectra. Fenimore (1999) studied the average spectrum from the duration-aligned light curves of a sample of GRBs and found that and . The peak energy lied at keV.
Outside the BATSE Spectral Range.
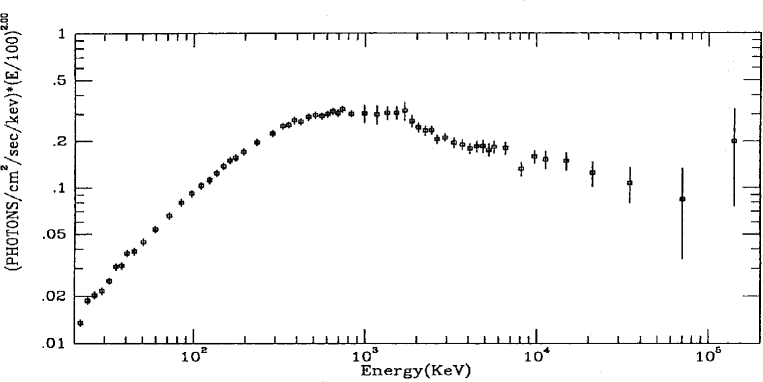
How far do the power-laws persist towards lower and higher energies? Occasionally the GRB lies in the field of view of the other CGRO instruments (COMPTEL, EGRET, OSSE) and a broader spectrum can be studied. An example is given in Figure 2 where a composite spectrum of GRB 910503, using all the capability of the CGRO’s four experiments, is given. A similar study was done by Schaefer et al. (1998) who studied GRB 910503, GRB 910601 and GRB 910814 from approximately 20 keV to a few hundred MeV. Such broad band studies are, more or less, consistent with a continuation of the BATSE spectrum. In a few cases, very hard radiation has been observed to be emitted late in, or even after, the main (lower energy) part of the burst. For instance GRB 940217, a burst lasting for 160 s as observed between 15 keV and 2 GeV, emitted GeV photons up to 1.5 hours after the trigger, with one photon having an energy of 18 GeV (a significant detection; Hurley et al. 1994).
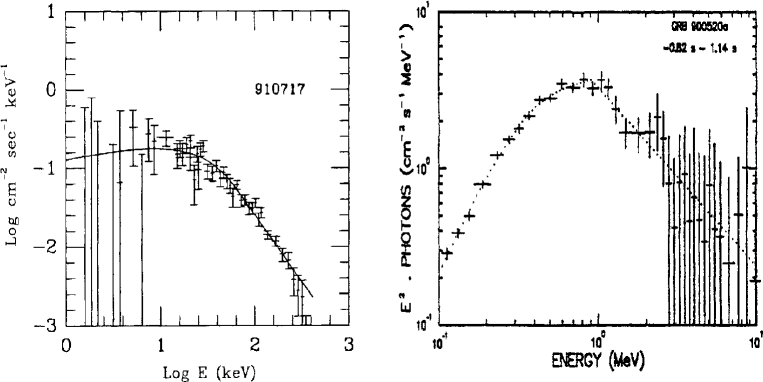
Barat et al. (1998) present the spectra between 0.1 and 10 MeV of the 20 most intense bursts observed by PHEBUS/Granat and report on the existence of a sharp break at typical energies of either around 1 MeV or around 2 MeV. They fit a 6 parameter function allowing for a second, high-energy sharp break. The fit to the spectrum of GRB 900520a is shown in the right-hand panel in Figure 3.
Strohmayer et al. (1998) studied a number of GRBs observed by Ginga, covering an energy band below the BATSE range ( keV) and found a substantial number of bursts with breaks below 10 keV, i.e., below the observable range in BATSE. The authors propose that the observations are due to the existence of two breaks in the GRB spectrum, one in the BATSE range and one below this, close to 5 keV. This is also consistent with their finding that the X-ray spectra are often hard, with positive s, in 40 of their studied sample.
The observed ratio of the energy emitted as X-rays (2-10 keV) relative to the gamma-rays (50-300 keV) is often a few , but in some cases it can be substantially larger, giving an average of 24 , with a logarithmic average of 7 for the 22 bursts studied by Strohmayer et al. (1998).
Soft Excess and Spectral Subclasses.
Several early studies occasionally observed significant emission in the X-ray range of GRBs ( keV). This was done, for instance, by XMON/P78-1 (Laros et al. 1984) and by WATCH/GRANAT (Castro-Tirado 1994). Preece et al. (1996c) studied the time-averaged spectra from 86 BATSE bursts in search of a soft excess above the extrapolated low-energy power-law. They used the 256 channel SD data and combined them with the lowest energy SD discriminator channel, leading to a useful spectral coverage from approximately 5 keV to 2 MeV, after making a post-launch calibration of the keV region. They searched for soft emission below 20 keV and found this in 14 of the cases. The enhancement was times relating to the standard power-law model flux, exceeding 5 in significance. Not a single case had a low-energy flux deficit. In their study they also identified 4 cases with a peak energy below 45 keV and with a . For the cases which had a peak energy larger than 100 keV the averaged low-energy power-law had , and for the cases with a peak energy below 100 keV the averaged value was .
Pendleton et al. (1994) searched for spectral subclasses. They studied 206 bursts with the LAD 4 channel data and used a direct spectral inversion technique to obtain the photon spectrum. They found that the distribution of spectral states is broad and that there are no clear sub-classes, albeit a weak clustering. The authors also found that the peak fluence (the fluence in the 64 ms interval with the highest count rate in channels 2 and 3) is significantly harder than the total fluence (from all counts in the burst interval) in the range 20-100 keV, which indicates that the time-resolved spectra are flatter than the time-integrated spectrum. This is also observed to be the case, for instance, by Ford et al. (1995), Liang & Kargatis (1996), and Crider et al. (1997, 1998a). The time-integrated spectra differ from the instantaneous spectra and it is of great importance that this is considered when physical models are tested. This is especially a problem in cases when the spectra evolve markedly which makes the two spectra differ notably (see §3 and, e.g., Crider et al. 1997; Ryde & Svensson 1999a).
Continuing the pursuit of spectral sub-classes, Pendleton et al. (1997) identified two distinct types of spectra. They studied a sample of 882 bursts with the LAD 4 channel data. The ‘not-high-energy-bursts’ (NHEB) have a marked lack of fluence above 300 keV. The authors even study individual pulses within the burst and find that ’high-energy-bursts’ (HEB) can consist of the sum of high-energy-pulses and not-high-energy-pulses, while the NHEB can consist only of not-high-energy-pulses. Bonnell & Norris (1999a, 1999b) argue that the NHE class of GRB probably is due to a brightness bias in the observations.
3. Spectral Evolution
3.1. Time Evolution of the Spectral Hardness (Peak Energy)
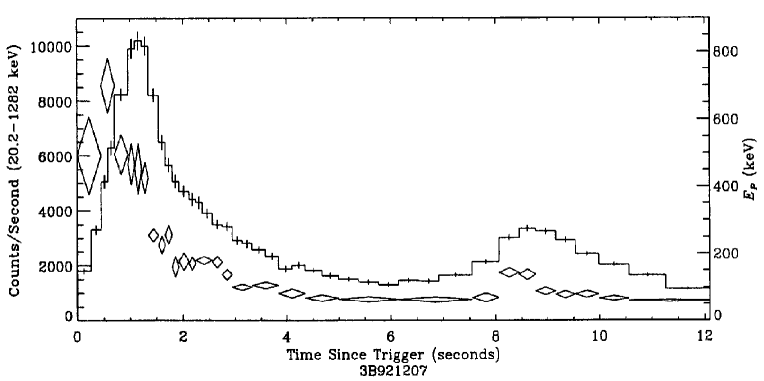
It was early discovered that the time-resolved (instantaneous) spectra in general soften with time (Mazets et al. 1982; Teegarten et al. 1982). In the survey of spectral evolution of BATSE bursts, Ford et al. (1995) found a number of common trends. They studied 37 bursts using the SD data and concluded that the peak energy rises with or slightly precedes intensity increases and softens for the remainder of the pulse. They also found that successive pulses are usually softer, as well as that there is a general softening in time outside of the main pulses over the entire burst. Furthermore, bursts for which the bulk of the flux comes well after the trigger tend also to be softer. There were also a few bursts which did not show these behaviors. Figure 4 shows the result of the analysis of the strong burst GRB 921207 (BATSE trigger # 2083) in Ford et al. (1995). For the BATSE observations, the peak energy varies, in general, by a factor of 5, with some cases reaching up to a factor of 15, over the burst. Complex bursts have only a weak and slow time evolution.
The softening over the burst can, in some cases, be spectacular and have a complex behavior. Occasionally there is a correlation between the spectral hardness and the intensity. In most pulses, the hardness decays monotonically, creating the hard-to-soft pulses, while in some the hardness tracks the intensity, creating the tracking pulses, cf. §4.
Beside the general trends there are examples of bursts with very diverse behaviors. For instance, GRB 980519 (#6764), which was observed by BeppoSAX and BATSE with a total energy range of keV (in’t Zand et al. 1999) exhibited a soft-to-hard-to-soft evolution. The whole evolution seems to be connected, suggesting that the soft initial phase is not a preburst X-ray activity, but may have a common origin with the main GRB emission.
3.2. The Evolution of the Spectral Shape
A systematic investigation of the shape of the spectrum below the peak energy was made by Crider et al. (1997), using the 128 channel LAD data. They studied the slope of the asymptotic low-energy power-law, in terms of its index in a sample of 79 bursts, and found that evolves in 58 of the cases. Some bursts exhibit substantial evolution in over the burst. Furthermore, they conclude that follows the evolution of the peak energy, both for hard-to-soft pulses and for tracking pulses, albeit with less confidence for the latter result. The averaged values of the power-law slope during the rise phase of the pulses are significantly harder for the hard-to-soft pulses, with 40 of them having a positive averaged -value. The most extreme example of spectral shape evolution is found in GRB 910927 (#829), in which the low-energy power-law index evolves from approximately down to . The maximal value of is somewhat dependent on the analysis and could actually be lower. However, it is beyond doubt that the s can be large and values close to 0 are certain. For the tracking pulses the averaged value remains negative during the rise phase.
The spectral shape above the break energy, , i.e., the high-energy power-law, does not change as much as has been observed for the low-energy power-law. Preece et al. (1998a) studied the behavior of the high-energy power-law in detail, using the 128 channel LAD data, which became useful after an in-orbit calibration. 126 bursts were studied: 122 of these had a spectrum consistent with a power-law, and for the evolution of this power-law 34 were inconsistent with a constant . The value of averaged over the burst has a narrow distribution, . There were a few events classified as super soft, having a , cf. Pendleton (1997). 100 events showed a hard-to-soft evolution and the averaged change of , . Furthermore, it was found that the behavior of is independent of the rest of the spectral evolution.
4. Connection between the Spectral and the Light Curve (Intensity) Behavior
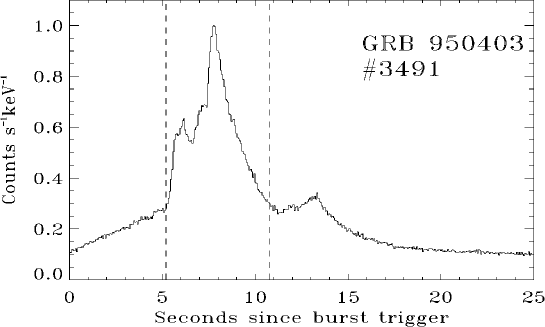
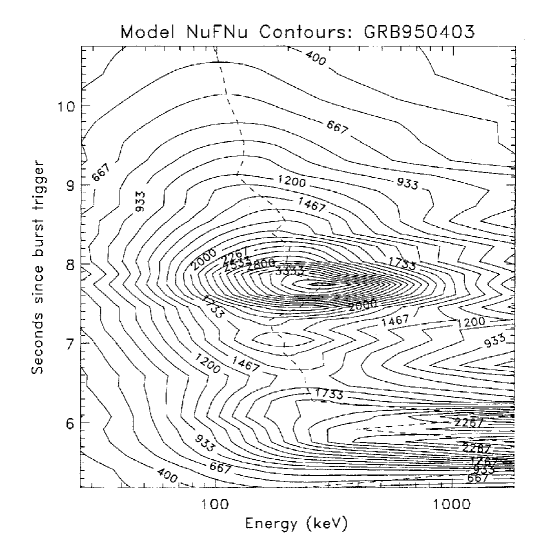
The spectral evolution is more or less coupled with the intensity of the burst. By studying narrow time bins of the light curve, the instantaneous spectra can be studied, giving information on the temporal behavior of the spectrum over the burst. Correspondingly, the light curves from different spectral energy channels show how the intensity of different energies compare with each other. The burst evolution can be described as taking place in an imaginary cube, having the spectral energy and the time axes in the x-y-plane and the intensity on the z-axis: ‘the GRB-cube’. The full evolution can then be illustrated as contour plots of the intensity on the energy-time plane. An example of such a plot is given in Figures 6 for GRB 950403 (#3491), whose light curve, from all the 4 LAD channels, is shown in Figure 5. The contours are from the fitted GRB-function, and the evolution of the peak energy is indicated.
To describe this evolution and to systematize the observations in order to see the general trends, empirical relations between observables have been sought. The physical reason for these correlations is then explored. The main observables studied are the instantaneous photon (or energy) flux, the spectral hardness characterized by the peak (break) energy or equivalently the temperature or color, the fluence and the total flux, the spectral shape parameters (e.g., the power-law indices), and the duration of the pulse and burst.
4.1. Quantitative Correlations
Hardness-Intensity Correlations (HIC).
The relation between the intensity and the hardness has been well investigated and it has been shown that there is no ubiquitous trend of spectral evolution that can characterize all bursts; several types of behavior exist. Firstly, Norris et al. (1986) found that the most common trend of spectral evolution is a hard-to-soft behavior over a pulse, with the hardness decreasing monotonically as the flux rises and falls. They studied 10 bursts observed by the Solar Maximum Mission satellite. This behavior was also seen to be the most common trend by Kargatis et al. (1994), who studied 16 SIGNE/Venera bursts. There are also a few cases which exhibit soft-to-hard and even soft-to-hard-to-soft evolution. In a study by Band (1997), 209 BATSE bursts were studied with the LAD discriminator rates giving high time resolution. The spectral evolution was studied through auto- and cross-correlation between light curves from the four LAD channels. Most of the bursts in the sample showed a hard-to-soft behavior.
Secondly, there is a tracking behavior between the intensity and the hardness, first noted by Golenetskii et al. (1983). Kargatis et al. (1994), confirmed the existence of such a HIC, even though it was less common than the hard-to-soft trend. However, in the decay phase of hard-to-soft pulses the HIC is often seen. Kargatis et al. (1995) found the hardness-intensity correlation in 28 pulse decays in 15 out of 26 GRBs with prominent pulses. Ryde & Svensson (1999b) also studied the HIC for the decay phases of a number of strong burst pulses.
Thirdly, there are bursts that do not exhibit any correlation at all having a chaotic behavior. Indeed, the main conclusion drawn by Jourdain (1990), who studied several bursts observed by the APEX experiment, and Laros et al. (1985), who studied a few Pioneer Venus Orbiter bursts, is that there does not exist any correlation between the spectral evolution and the time history in their samples of GRBs. Over the whole GRB, there often does not exist any pure correlation, even though the tracks in the hardness-intensity plane are confined to an area from hard and intense to soft and weak, indicating an overall trend with increasing luminosity with hardness. (Kargatis et al. 1994). A chaotic behavior in the plane may be a result of the superposition of several short hard-to-soft pulses that cannot be resolved.
Several of the different types of trends can also be seen in a single GRB (e.g., Hurley et al. 1992). The variety of behaviors is also manifested in Band et al. (1993) and Ford et al. (1995). Bhat et al. (1994) studied 19 time structures, which have a FRED-like shape with a short rise time ( s), and found that most had a good correlation between the hardness and the intensity.
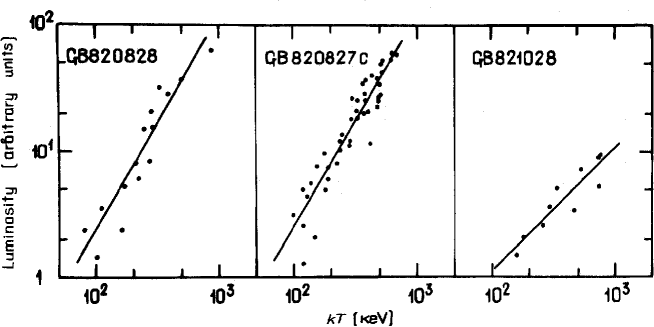
The tracking behavior has been described quantitatively. Golenetskii et al. (1983) found the power-law relation between the instantaneous luminosity ( the energy flux) and the peak energy
| (3) |
where the peak of the spectrum was quantified as the temperature, , in the thermal bremsstrahlung model ( is the Boltzmann’s constant). The power-law index (the correlation index), , was found to have a typical value of . Figure 7 shows fits to the hardness-intensity correlation for three GRBs discussed in the original paper by Golenetskii et al. (1983). This analysis was criticized by several workers, including Laros et al. (1985), Norris et al. (1986), and Kargatis (1994). It was speculated that the correlation could possibly be an artifact from the way the temperature was derived from the two-channel count rates. Furthermore, Golenetskii et al. (1983) excluded the hard initial phase of the bursts. Ford et al. (1995) suggested that the low time-resolution may result in the initial, non-tracking, hard behavior being missed.
However, Kargatis et al. (1994) confirmed the existence of the Golenetskii et al. (1983) correlation in approximately half of their cases. The spread was substantially wider . In the Kargatis et al. (1995) study, in which the decay phase of a number of prominent pulses were examined, it was found that the distribution of the correlation index peaks at 1.7 and has a substantial spread. Bhat et al. (1994) found a corresponding spread in the HIC index.
In the study of the Ginga data, Strohmayer et al. (1998) investigated the evolution of the peak energy versus energy flux and found the power-law correlation to be valid here too, with, for instance, for GRB 890929 (in the Ginga energy range).
Hardness-Fluence Correlation (HFC).
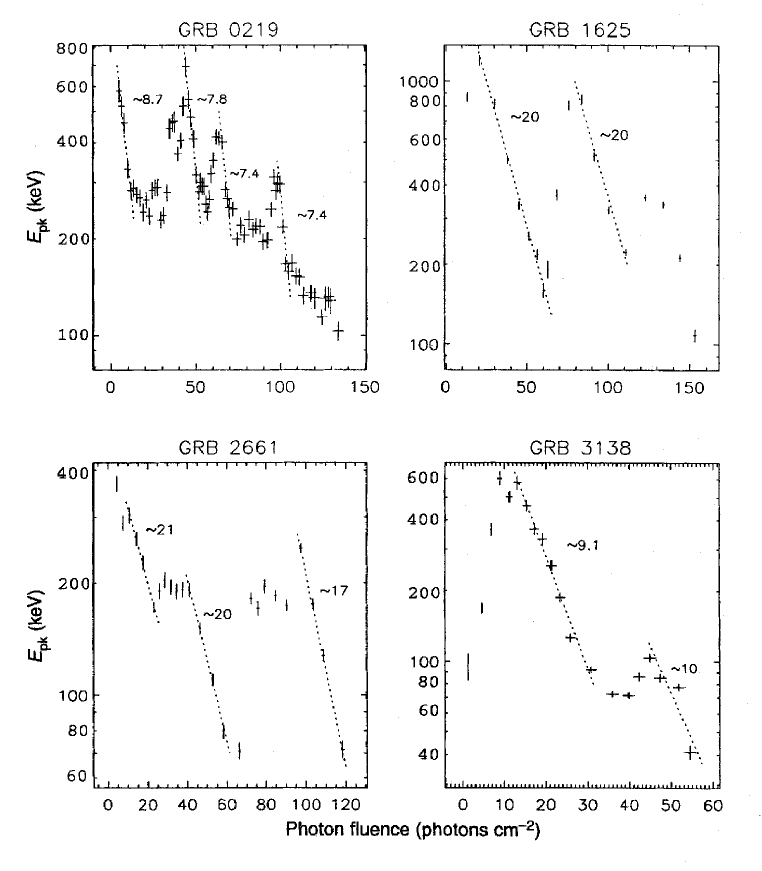
As mentioned above, the correlation between the hardness and the flux (luminosity) over the entire burst or even a pulse does not always show any clear correlation. However, by studying the relation between the hardness and the running time-integral of the flux, the fluence, a clear correlation is often revealed over the entire pulse. Liang & Kargatis (1996) consequently found an empirical relation defining how the instantaneous spectrum evolves as a function of photon fluence, . They found that the power peak energy of the time-resolved spectra of a single pulse decays exponentially as a function of , i.e.,
| (4) |
where is the maximum value of within the pulse and is the exponential decay constant. The photon fluence is the photon flux integrated from the time of . Figure 8 shows examples of fitted correlations from the original work. The authors found that 35 of the 37 pulses in the study were consistent or marginally consistent with the relation. Furthermore, they concluded that the decay constant is constant from pulse to pulse within a GRB. This view was, however, changed by Crider et al. (1998a) who dismissed the apparent constancy as consistent with drawing values out of a narrow statistical distribution of , which they found to be log-normal with a mean of and a FWHM of . This result is probably affected by selection effects. They expanded the study to include 41 pulses within 26 bursts, by using the algorithm introduced by Norris et al. (1996), to identify pulses. Another approach was also introduced, where they used the energy fluence instead of the photon fluence. The two approaches are very similar and do not fundamentally change the observed trends of the decay. These results confirm the correlation and extend the number of pulses in which the correlation is found. The relation between the two approaches is discussed in §5.3.
Other Correlations.
A few other correlations within individual GRBs should also be mentioned. Norris et al. (1996) introduced the asymmetry/width/softness paradigm for pulses, in which the quantities are correlated. They only detect, however, a slight trend that more symmetric, narrower pulses are harder. Furthermore, Kouveliotou et al. (1992) reported on a trend that pulses with a short rise time are harder in single-pulse events. Using PVO bursts, Lochner (1992) noted a negative correlation between hardness and time between pulses.
The spectral evolution in gamma-ray color-color diagrams, i.e, the correlation between hardness ratios have been studied. Kouveliotou et al. (1993) could classify about half of the 30 bursts they studied into three types of behavior, crescent, island-like and flat. They did not find any striking correlation between the temporal profile of the bursts and the shape in its color-color diagram.
In the study of Lee et al. (1998), the 2500 individual channel pulse structures analyzed also confirmed the general behaviors that pulses are narrower and occur earlier at high energies. There is also a negative correlation between the peak flux and the pulse width, and between the pulse fluence and the pulse duration, within a burst. Petrosian et al. (1999) discuss this and note that these correlations are the same as the ones attributed to cosmological effects found in ensembles of bursts. They therefore draw the conclusion that these ensemble correlations cannot be cosmological signatures alone, but must arise from the intrinsic properties of the GRBs.
4.2. Quantitative Temporal Descriptions
A few attempts have been made at quantitatively describing the temporal intensity-spectral evolution within a GRB pulse. Fenimore et al. (1995) studied how the width of a GRB pulse changes as a function of spectral energy and found that it scales as . This result was found both by using the autocorrelation function for GRBs and by using the width of the average pulse profiles for the four BATSE channels (see in ’t Zand & Fenimore 1996 for a discussion on the autocorrelation function). The behavior was also observed in the whole band from 1.5 to 700 keV by BeppoSAX (Piro et al. 1997), which suggests that the emission mechanism is the same from soft X-rays to gamma-rays. Following the notation (with some modifications) of Fenimore & Bloom (1995) the light curve in each of the 4 BATSE channels () can be described as
| (5) |
assuming that the time structure can be separated from the spectral shape, . is the effective area of the detector for each channel. The scaling factor, was modeled by Fenimore & Bloom (1995) as with , is measured in keV and for the decay phase of the pulse, typically, and and for the rise phase, and .
Neither the hardness-intensity correlation (Golenetskii et al. 1983) nor the hardness-fluence correlation (Liang & Kargatis 1996) include the time dependence of the spectral evolution. However, combined they do, as the fluence in the time integral of the flux. This was used by Ryde & Svensson (1999b) to synthesize and find a compact and quantitative description of the time evolution of the decay phase of a GRB pulse. This description is for the intensity-time plane of the GRB-cube, rather than for the single-spectral-channel light curves, which have been studied extensively in connection with their dependence with energy. Ryde & Svensson (1999b) identify a subgroup of GRB pulses, for which the two empirical relations are valid and show that for these the decay phase of the pulse should follow a power-law. For the decay phase the HFC becomes
| (6) |
where is the peak energy at the start of the decay. Note that could be even larger, for instance for hard-to-soft bursts. For a moderate spectral shape evolution the HIC can be rewritten, using the photon flux, as, in that case, it holds that . For the decay phase we then have
| (7) |
where is the photon flux at the same time as , i.e., at the beginning of the decay phase. The correlation index, , corresponds approximately to , where is the index used by Golenetskii et al. (1983). These two relations, given by equations (6) and (7), fully describe the evolution and especially the time dependence. If these two relations are fulfilled the time evolution can be described by a vector function given by
| (8) | |||||
| (9) |
where the initial value is and the number of additional parameters is limited to two, the time constant and the HIC index . Note that the origin of the time variable, , is at the time of the intensity peak. The peak energy has a similar dependence as the intensity, differing only by the power law index . The exponential decay constant of the HFC is given by , and thus the characteristic time scale of the decay, the time constant, .
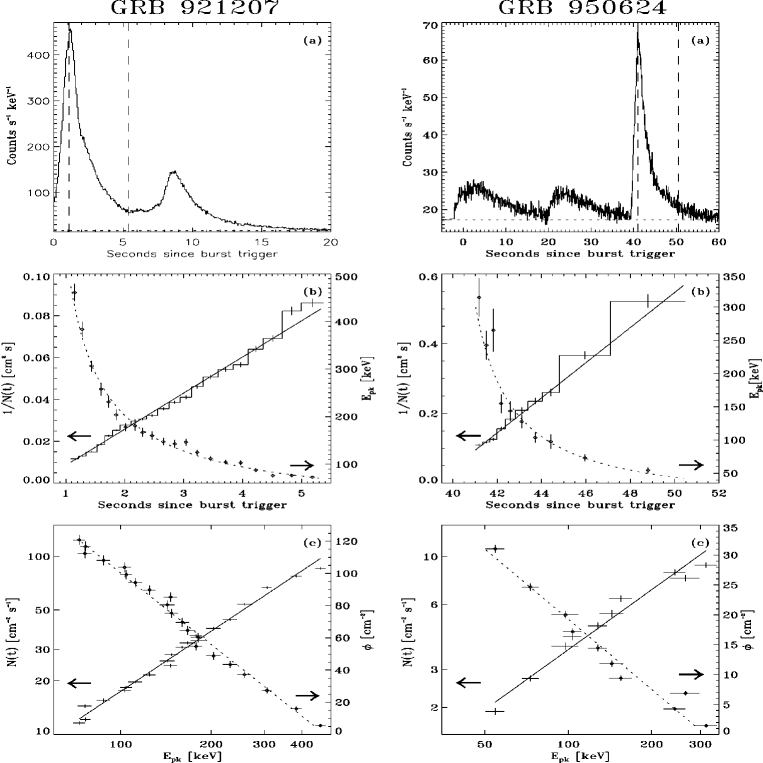
The formulation, given by equations (8) and (9), is a condensate of the HIC and the HFC, which have been proven to be valid in several cases. Ryde & Svensson (1999b) studied a number GRB pulses in this context, fitting both the original correlations, as well as the new equivalent formulation. The fits of the behavior of the decay phases of two such strong pulses are shown in Figure 9. This shows, among other things, that if the HIC and the HFC are valid the decay part of the light curve (intensity) should follow the power-law . This behavior cannot persist too long as the integrated flux (the fluence) has a divergent behavior . The decay of the intensity must thus change into a more rapid one, such as an exponential, or possibly be turned off completely.
4.3. Relation Between the Time-Integrated and Time-Resolved Spectra
The hardness-fluence correlation gives us the possibility to understand in what way the instantaneous and the time-integrated spectra are related over a pulse. What time-integrated spectrum does this relation give rise to? I.e., what does the spectrum on the intensity-energy plane of the GRB-cube look like? The exponential decay of the peak energy with fluence means that a linear increase in fluence by equal steps of photons cm-2 corresponds to a decrease of in equal logarithmic steps. As the instantaneous spectra are, roughly, dominated by the photons cm-2 in a logarithmic interval around the peak energy, is a constant . In other words, the time-integrated, specific flux spectrum is a constant function of energy, and thus the time-integrated photon spectrum, of a single pulse has a power-law slope of . This is a direct result of the specific evolution defined by the hardness-fluence correlation. I.e., the spectral shape is a result of the exponential decay of the peak energy versus photon fluence. This spectral shape is reminiscent of the optically-thin thermal bremsstrahlung spectrum. This was studied in detail by Ryde & Svensson (1999a), who showed analytically how the time evolution of the instantaneous spectra is related to the resulting time-integrated spectrum. They studied mainly the spectra of single FRED pulses and showed that the exponential decay of the peak energy with photon fluence, indeed, does lead to a general, low-energy slope, normalized by the decay constant and having the underlying behavior. This general result is affected by the finite range over which the peak energy evolves; the less it evolves the more the spectrum is affected. The way the spectrum is affected can be found analytically, leading to a function that can be used to fit the time-integrated spectra, and having parameters describing the instantaneous spectra. From the fit to the time-integrated spectrum one can deduce information about the instantaneous spectra, which is of interest as these carry more direct physical information. This is not the case for the time-integrated spectra, as they are merely the result of the exponential decay of the peak energy.
5. Analysis Methodology
5.1. Data Analysis
The observed distribution of the spectral parameters could very well be different from the parent distribution due to observational biases, such as truncation of the data set resulting from the trigger procedure. For instance, is this the case for the narrow range of peak energies found by the BATSE instrument? Cohen et al. (1998) argued that the detection efficiency of the BATSE could lead to an unreal paucity of hard bursts and they suggest that there could exist a large, unobserved population of hard (MeV) bursts. If the luminosity at the peak energies is represented by a standard candle, high peak energies will result in fewer photons, letting fewer pass the trigger. Very low peak energies will correspondingly affect the triggered fraction, as the spectra would have their cut-offs below the detectable range. This is also noted in Lloyd & Petrosian (1999) and Petrosian et al. (1999) who show that the effects of selection biases and data truncations are to produce observed distributions that are narrower than the parent distributions. They also present methods to properly account for this.
Furthermore, are the assigned values of the spectral characteristics, mainly the peak energy, , and the slope of the asymptotic, low-energy power-law, , correctly measured? As it is the asymptotic value of the power-law that is measured, problems can arise the closer the energy break gets to the low-energy cut-off of the energy window of the detector (generally 15-25 keV for BATSE data). The fitting can lead to a wrong value being ascribed to , and consequently also to , as the exponential turnover (curvature) is not modeled correctly. This is also evident in the comparison of the results from fitting a sharply broken power-law to the data, instead. This function does not take the exponential turnover into account and therefore gives a steeper (lower ) power-law compared to the asymptotic value. The errors in the fitted -parameter also increase as the available energy range, for fitting, decreases. Preece et al. (1998b) use the power-law tangent to the ‘GRB’ function at some chosen low energy (e.g. 25 keV) as the upper bound of the low-energy power-law behavior within the observed energy window. This value is, however, always smaller than the asymptotic value. In addition, the values assigned to the fitted parameters can be erroneous due to the existence of any soft component, any previous pulses adding soft photons to the spectrum, or any completely unresolved pulses with lower break energies. These issues could affect the estimated fraction of pulses over which the spectral shape actually changes. Kargatis et al. (1995) and Liang & Kargatis (1996) freeze the power-law values to their average values during the burst, which reduces the spectral variations into merely the hardness variation. Correspondingly, the measured value of is sensitive to the amount of high-energy signal available for its determination. The power peak, in some cases, does not lie within the BATSE band, e.g., when . For a detailed discussion on these issues see Preece (1999).
To be able to study the spectral evolution on finer time scales a coarser hardness measure in needed. Often the hardness ratio between different energy bands is used. Bhat et al. (1994) compared the analysis of the spectral evolution with the two different hardness definitions, conventional spectral fitting and hardness ratios, and found that the two were consistent.
Furthermore, does the BATSE spectrum, between 20 keV and 1900 keV, represent a correct measure of the bolometric flux? The energy spectrum often peaks within the BATSE band and thus it should be a good measure of the bolometric energy flux. Such considerations made Crider et al. (1999) prefer to study the spectral evolution in terms of energy flux rather than photon flux, cf. §5.3.
Moreover, the evolution of the spectral characteristics and the correlations between them could also be affected by various limitations in the observations. Schaefer (1993) discusses methodological problems in connection with the study of the HIC and expresses concern with the fitting technique used (Isobe 1990). He emphasizes the importance of having high spectral resolution rather than time resolution, so as not to introduce artificial correlations. To do spectral analysis correctly it has been shown that the signal-to-noise ratio should be of the order of in the BATSE range (Preece et al. 1998a).
5.2. Detailed Spectral Modeling
To model the time-integrated photon count spectra, from which the background has been subtracted, the ‘GRB’ function (Band et al. 1993) is the most commonly used, cf. §2.2. It is a purely empirical model described by 4 parameters. Besides the normalization, the two power-laws and the break energy are fitted. Earlier studies used the ‘optically-thin thermal bremsstrahlung’ (OTTB) spectrum, and the ’thermal synchrotron’ (TS) spectrum from an optically-thin, mildly relativistic, thermal plasma in a magnetic field ; , where is the temperature and is the critical frequency proportional to (Liang 1982). The empirical models are often used only to determine the general shape, e.g., the hardness, and not to determine physical characteristics of the source, like a temperature. The value assigned to the break of the spectrum depends on the model used and can thus affect the correlations sought for. The break is determined from the fit to the overall continuum shape which is modeled in different ways. This was noted, for instance, by Schaefer et al. (1992) and Kargatis et al. (1994). In the latter study the authors used the OTTB and TS models and found that many cases gave consistent results but that there were cases for which rather different values were obtained. Another such study was done by Ryde (1999), where 10 GRB spectra were fitted with three different models: a sharply broken power-law, the ‘GRB’ model, both with 4 parameters, and the smoothly broken power-law, described by a broken power-law, smoothly and evenly connected through a hyperbolic function with a total of 5 parameters. The extra free parameter describes the width of the transition region (see, e.g., Preece et al. 1996a; Ryde 1999). In some cases, the peak energies attributed to the data differ considerably. As bursts can have an actual curvature that is sharper than the one given by the fixed exponential curvature in the ‘GRB’ function, which is determined solely by , the resulting fits may differ. Adding extra parameters to the model function is meaningful only if the data are good enough to enable a constraining of the parameters.
5.3. Energy or Photon Flux?
The intensity can be characterized either in terms of the photon/count flux or of the energy flux. For instance, Golenetskii et al. (1983) studied the HIC based on the energy flux (luminosity), while Bhat et al. (1994) studied the correlation using the detector count flux instead, allowing for higher time resolution by using hardness ratios to characterize the spectrum. The studies arrive at similar conclusions for the correlation. Liang & Kargatis (1996) choose to study the photon flux in their search of the HFC. This was motivated by the fact that the decay of the hardness versus energy fluence was more difficult to establish because the deconvolved energy flux has larger statistical errors. Liang & Kargatis (1996) discovered the HFC using the photon fluence. In a larger study of the HFC, Crider et al. (1999) used the energy flux instead. More detailed spectral fitting can reduce the statistical errors in the energy fluence. The authors also found the HFC in the energy flux fits for all the 41 cases they studied. In parallel, they also studied the decay versus photon fluence suggested originally, and confirmed the discovery. The reason they prefer the energy fluence over the photon fluence is their argument that the energy fluence represents a more physical quantity and that it is a better measure of the bolometric flux. However, they point out that the two approaches do not represent fundamentally different trends. Ryde & Svensson (1999b) used the photon flux both for the HIC and for the HFC in their synthesis of the spectral evolution of a GRB pulse and showed the relations to hold. What then is the difference and when is a difference between the approaches expected to be seen? Can we determine which correlation is the most fundamental, i.e., the one always valid and not merely a consequence of the other?
The decay tested for is either the exponential decay of the peak energy versus photon fluence,
| (10) |
or the linear decay of the peak energy versus energy fluence, ,
| (11) |
Differentiating equation (10) gives the decay rate of the peak as
| (12) |
The last step in equation (12) is generally only approximately true. The equivalence between the exponential decay in photon fluence, equation (10), and the linear decay in energy fluence, equation (11), depends on the validity of this approximation.
The energy flux
| (13) |
where is the flux-weighted, averaged energy, i.e., the mean energy, and is the normalized spectrum. The assumption that the two decays are the same is equivalent to that . This is exactly the case in the often illustrative Dirac function approximation of the spectrum. It is also the case, when the spectral shape, i.e., the function , is symmetric around the peak energy. The approximation is better the more peaked the logarithmic -spectrum is.
A complication to the discussion stems from the fact that can shift as changes, i.e., when the spectral shape varies, for instance, with an evolving . Furthermore, when the spectral shape changes, the relation between the power peak, , and the photon number peak, , varies, as . For which measured peak energy does the relations hold the best? Ryde & Svensson (1999a) argue that the is the important measure. General uncertainty in the measurement of the peak energy has already been discussed above. These issues add to the fact that the data cannot clearly demonstrate which relation is the correct one. In other words, we cannot make any conclusive statement based on information gleaned from the data alone.
6. Discussion
Gamma-ray bursts are at cosmological distances, as indicated by recent observations of the afterglow, giving high redshift values (e.g., Costa et al. 1997; Metzger et al. 1997). One plausible origin of the huge energy release needed, is from a dissipative, relativistically expanding fireball (blast-wave), or, equivalently, a propagating jet with low baryonic contamination (e.g., Mészáros & Rees 1997). The motivation for this scenario is based on the requirement that the observed amount of energy must be injected inside a very small volume, given by the characteristic time scales of GRBs. The photon energy densities imply that the radiation is super-Eddington (by orders of magnitude; particularly if the radiation is emitted isotropically) and lead to the creation of an optically thick, dense radiation and electron-positron-pair fluid, expanding under its own pressure and cooling adiabatically. The observed radiation can thus not come from the surface of the central energy source. Initially the fireball is thermal and converts the radiation energy into bulk kinetic energy. The thermal emission from the fireball will not be visible in the gamma-ray band, but may be visible at lower energies. It then becomes optically-thin and the kinetic energy of the wind will be tapped by a dissipation mechanism, such as shocks or magnetohydrodynamic (MHD) turbulence, converting it into internal energy and accelerating relativistic particles. The shocks could occur as the fireball crashes into the circum-burst, low-density environment or as different shells, with different Lorentz factors, within the fireball catch up with each other. The general hard-to-soft evolution of the burst spectra could then be explained by the expansion and deceleration of the blast-wave and/or by the decline in the averaged available energy, as more particles reach the shocks. The pair plasma wind has to be highly relativistic with Lorentz factors of to avoid photon-photon degradation through pair-production, as high-energy photons are observed. This implies that the baryonic pollution of the radiation fields cannot be very high (’clean fireball’). Lower Lorentz factors are, however, possible but then the production of the high-energy radiation cannot be directly connected to the lower energy gamma-rays.
The primary source and signatures of the underlying mechanism is enshrouded by the optically-thick pair plasma at the beginning of the life of the fireball and details are washed out and cannot be seen directly in the observations. The observed radiation from this initial phase is from and outside of the pair photosphere. Thus the nature of the primary energy release will not greatly affect the resulting expanding fireball. Models including stellar-mass, compact objects, such as a merging neutron star and a black hole, meet the requirements of occurrence and energetics. This event can either be a single, short-lived, catastrophic event, producing a single fireball, or result in a recurrent central engine capable of producing several shells. The latter could, for instance, be a long-lived accretion system with the debris of the disrupted neutron star accreting onto the black hole. The orbital and spin energy in such a system can be tapped, for instance, through electromagnetic torques.
As the expanding fireball is relativistic the radiation will undergo beaming, time-transformation, and Lorentz-boosting, blueshifting the emission into the gamma-ray band. Furthermore, the emission radiated from the blast-wave at a given comoving time will contribute to a broad observer time interval, due to light travel-time effects. Fenimore et al. (1996) argue that the FRED-like envelope shape of light curves are expected from a relativistically expanding shell, and find that the decay phase should follow a power-law.
Gamma-ray observations may give hints of possible physical causes of the continuum spectral emission, i.e., information on the processes which convert the kinetic energy into the observed radiation. Empirical studies of the dynamics of the burst spectra, enable the systematization and the investigation of the underlying distributions of parameters. These empirical properties provide the important clues for the theoretical efforts to unravel the physical processes. The case is probably that these relations do not point directly to, and are not able to unambiguously state, the physical processes responsible for the radiation. Several different radiation processes could be involved, as well as pure kinematic and relativistic effects, making the physical interpretation difficult and complex. However, if one of the effects is dominant, the observations will give us direct information on physical entities, such as the distribution of particles emitting the radiation and the optical depth, etc. A physical GRB model must, under all circumstances, be able to reproduce the severe constraints that these relations and observations give. The large diversity, time scales, and variability of light curves must be naturally explained, as should the shape and breaks in the spectra. The connection between the spectral and intensity evolution, as described above, must also be addressed by any successful model.
The general trend of the spectrum becoming softer over the whole burst could indicate a single emission region having a memory of previous emission events. Simple radiation processes all have some difficulty in describing the observations. Even on the smallest time scales the observed spectra are broad, much broader than a black body spectrum. Is it a multi-temperature black body mimicking a power-law, e.g., thermal spectra from many short-lived events or do other processes produce the broad spectrum? From the early spectral observations there were suggestions of thermal bremsstrahlung of an optically-thin, hot plasma. The spectra have, however, been shown generally not to follow such a spectrum. The low-energy power-law does not always follow . Thermal bremsstrahlung is also too inefficient (Liang 1982). Furthermore, the hardness-intensity correlation-index is for mildly relativistic thermal bremsstrahlung from a plasma cloud (if the emission measure is constant).
A part of the internal energy will take the form of magnetic fields which will make the relativistic electrons radiate synchrotron radiation, a very efficient radiation mechanism. As the fireball crashes into the surrounding low-density gas, it will form a relativistic, collisionless shock and radiate by optically-thin synchrotron radiation, which will be boosted into the gamma-ray band (the synchrotron shock model; Mészáros & Rees 1993). The electrons, giving rise to the synchrotron spectrum, are assumed to have a truncated power-law distribution. In the comoving frame, the minimum Lorentz factor is approximately equal to (depending on the equipartition between electrons and protons) to the bulk Lorentz factor of the blast wave, while the maximum Lorentz factor is set by the balance of radiative losses and energy gain from the acceleration mechanism at work for the most energetic electrons. If the cooling time of the electrons is very long the electron distribution around the low-energy cut-off will not change and the emerging synchrotron spectrum will have a photon index of . However, if the cooling time is much shorter than the comoving pulse duration, the electrons will settle in a cooled distribution, emitting a synchrotron spectrum with a low-energy photon index between -2/3 and -3/2, depending on the strength of the magnetic field. The electron distribution must have a sufficiently sharp low-energy cut-off during the whole evolution to be able to give rise to the observed spectrum.
The photon index can, in this model never exceed the value , creating a testable ’line of death’ for the synchrotron shock model in its simplest version. Preece et al. (1998b) found that 23 bursts out of their sample of 137, for which they did time-resolved spectroscopy, violate the synchrotron shock model, as the low-energy power-law spectra are harder than the maximally allowed, . Cohen et al. (1997) fitted the time-integrated spectra and found them to confirm the synchrotron shock model. However, as emphasized earlier, it is the time-resolved spectra which should be studied. The spectral index should also be constant, which clearly is not the case, as a softening of the spectra is observed in many bursts (Crider et al. 1997). The pulse width scaling with energy, is, however, consistent with the prediction from radiative cooling by synchrotron losses (Tavani 1996). Synchrotron self-absorption would increase the low-energy power-law index, being for a non-thermal plasma. The optical depth must then, however, be greater than one.
The inclusion of Comptonization of the soft synchrotron photons by the emitting particles themselves, can modify the spectrum (Liang et al. 1997). The spectrum will then be an inverse Compton image of the synchrotron continuum in the comoving frame. The relativistic expansion will then boost the radiation to even higher energies. The empirical correlations point to saturated Comptonization and as noted by Crider et al. (1998b) there also has to be an initial increase in Thomson depth to explain the initial increase of observed in many pulses. Here the relation, found in the keV range, could be an argument against the synchrotron self-Compton mechanism, as the X-rays and -rays would, in that case, be expected to have the same duration, since they would be produced by the same population of electrons (Piro et al. 1997).
Another emission scenario involves photon-starved Comptonization in an optically-thick pair plasma having moderate Lorentz factors, . This scenario cannot explain the very high-energy (GeV) emission observed. It is, however, attractive as it naturally provides a thermostat and can produce a stable spectral break. The nonlinear nature also can explain the highly variable light curves and the large amplitude variations, as such a system can be turned off quickly. See, e.g., Thompson (1998) and Ghisellini & Celotti (1999) for more detailed discussions.
Detailed calculations of resulting light curves and spectra in the blast-wave model, including synchrotron and synchrotron self-Compton emission are given in Dermer & Chiang (1998) and Chiang & Dermer (1999), showing, e.g., how the injected electron distribution is reflected in the radiated spectrum, for various combinations of non-thermal electron distributions and magnetic fields. See also, e.g., Mészáros et al. (1994) and Panaitescu et al. (1997). Daigne & Mochkovitch (1998) calculated the emitted spectrum in an internal shock scenario, and are able to reproduce many of the observations.
An observational feature that has to be explained is the highly variable light curves. The time scales for the variations in classical GRBs can be as low as s and are found to be self-similar with the average power density spectrum of long bursts being a power-law over more than two decades of frequency (Beloborodov et al. 1999). Such a behavior is difficult to explain with just variations in the external medium or shock collisions. Stern (1999) suggests that complex dynamic processes in the shock evolution make the outflow inhomogeneous, giving rise to the observations. This could be MHD turbulence with reconnection or instabilities such as the Rayleigh-Taylor instability.
7. Conclusion
Gamma-ray bursts are observed at a rate of 1 per day with current detectors. Their time histories are a morphological zoo with a large diversity in shape. The energy spectra are peaked, broken power-laws and the instantaneous spectra evolve, sometimes markedly, both within a pulse and over the whole GRB. The intensity and its spectral characteristics are often correlated. This can be described by empirical relations, which are the result of the true intrinsic correlations of the GRB giving rise to empirical correlations. These are the result of the true intrinsic correlations of the GRB event as well as of relativistic effects. Understanding the intrinsic correlations, for instance within a burst, will eventually lead to the unraveling of the secret behind the energy release and the radiation processes in GRBs.
It has been emphasized in this review that it is important to consider the spectral evolution when GRBs are studied, for instance, their light curves. Furthermore, it is the instantaneous spectra, which are more peaked than the time-integrated spectra, and their time evolution that reflect the physical processes responsible for the GRB emission. The time-integrated spectrum is, generally, a result of the specific spectral evolution taking place during the burst. Unfortunately, most theoretical spectral models assume that it is the time-integrated spectrum that reflects the underlying physical emission mechanism. In the study of the spectral characteristics, the low-energy power-law is the best studied and puts constraints on the physical radiation mechanism proposed to be responsible for the observed radiation. At the moment theory lags behind the observational advances. The observations give a number of constraints that have to be met by any successful physical description of the GRB phenomenon.
Acknowledgments.
Thanks are due to L. Borgonovo, V. Petrosian, R. Preece, J. Poutanen and R. Svensson, for discussions and comments on the manuscript.
References
Band, D., et al. 1993, ApJ, 413, 281
Band, D. 1997, ApJ, 486, 928
Barat, C., Lestrade, J. P., Dezalay, J-P, Hurley, K., Sunyaev, R., Terekhov, O., & Kuznetsov, A. 1998, in AIP Conf. Proc. 428, Gamma-ray Bursts, 4th Huntsville Symposium, ed. C. A. Meegan, R. D. Preece & T. M. Koshut (New York: AIP), 278
Beloborodov, A. M., Stern, B., & Svensson, R. 1999, ApJ, 508, L25
Bhat, P. N., Fishman, G. J., Meegan, C. A., Wilson, R. B., Kouveliotou, C., Paciesas, W. S., Pendleton, G. N., & Schaefer, B. E. 1994, ApJ, 426, 604
Boella, M., et al. 1997, A&A Supp. Ser., 122, 299
Bonnell, J. T., & Norris, J. P. 1999a, ApJ, submitted, astro-ph/9905319
Bonnell, J. T., & Norris, J. P. 1999b, these proceedings
Briggs, M. S., Band, D. L., Preece, R. D., Pendleton, G. N., Paciesas, W. S., & Matteson J. L. 1998, in AIP Conf. Proc. 428, Gamma-ray Bursts, 4th Huntsville Symposium, ed. C. A. Meegan, R. D. Preece & T. M. Koshut (New York: AIP), 299
Briggs, M. S. 1999, these proceedings
Castro-Tirado, A. 1994, Ph.D. thesis, Univ. Copenhagen
Chambon, G., Hurley, K., Niel, M., Vedrenne, G., Zenchenko, V., Kuznetsov, A., & Estulin, I. 1979, Space Sci. Instrum., 5, 73
Chernenko, A., & Mitrofanov, I. 1995, MNRAS, 274, 361
Chernenko, A., Briggs, M. S., Paciesas, W. S., Pendleton, G. N., Preece, R. D., & Meegan, C. A. 1998, in AIP Conf. Proc. 428, Gamma-ray Bursts, 4th Huntsville Symposium, ed. C. A. Meegan, R. D. Preece & T. M. Koshut (New York: AIP), 294
Chiang, J., & Dermer, C. D. 1999, ApJ, 512, 699
Cline, T. L., et al. 1973, ApJ, 185, L1
Cline, T. L., & Desai, U. D. 1975, ApJ, 196, L43
Cohen, E., Katz, J. I., Piran, T., Sari, R., Preece, R. D., & Band, D. L. 1997, ApJ, 488, 330
Cohen, E., Piran, T., & Narayan, R. 1998, ApJ, 500, 888
Costa, E., et al. 1997, IAU Circ. 6572; Nature, 387, 783
Crider, A., et al. 1997 ApJ, 479, L39
Crider, A., Liang, E. P., & Preece, R. D. 1998a, in AIP Conf. Proc. 428, Gamma-ray Bursts, 4th Huntsville Symposium, ed. C. A. Meegan, R. D. Preece & T. M. Koshut (New York: AIP), 63
Crider, A., Liang, E. P., & Preece, R. D. 1998b, in AIP Conf. Proc. 428, Gamma-ray Bursts, 4th Huntsville Symposium, ed. C. A. Meegan, R. D. Preece & T. M. Koshut (New York: AIP), 359
Crider, A., Liang, E. P., Preece, R. D., Briggs, M. S., Pendleton, G. N., Paciesas, W. S., Band, D. L. , & Matteson, J. L. 1999, ApJ, 519, 206
Daigne, F. & Mochkovitch, R. 1998, MNRAS, 296, 275
Dermer, C. D., & Chiang, J. 1998, NewA, 3, 157
Fenimore, E. E. 1999, ApJ, 518, 379
Fenimore, E. E., & Bloom, J. S. 1995, ApJ, 453, 25
Fenimore, E. E., in’t Zand, J. J. M., Norris, J. P., Bonnell, J. T., & Nemiroff, R. J. 1995, ApJ, 448, L101
Fenimore, E. E., Madras, C. D., & Nayakshin, S. 1996, ApJ, 473, 998
Fishman, G. J., et al. 1989, in Proc. of the GRO Science Workshop, ed. W. N. Johnson, 2
Fishman, G. J., et al. 1994, ApJS, 92, 229
Ford, L. A., et al. 1995, ApJ, 439, 307
Ghisellini, G., & Celotti, A. 1999, ApJ, 511, L93
Golenetskii, S. V., Mazets, E. P., Aptekar, R. L., & Ilyinskii, V. N. 1983, Nature, 306, 451
Golenetskii, S. V., Aptekar, R. L., Frederiks, D. D., Ilyinskii, V. N., Mazets, E. P., Panov, V. N., Sokolova, Z. J., & Terekhov, M. M. 1998, in AIP Conf. Proc. 428, Gamma-ray Bursts, 4th Huntsville Symposium, ed. C. A. Meegan, R. D. Preece & T. M. Koshut (New York: AIP), 284
Hueter, G. J. 1987, Ph.D. thesis, UCSD
Hurley, K., et al. 1992, in Gamma-Ray Bursts, AIP Conf. Proc. 265, ed. W. S. Paciesas & G. J. Fishman (New York: AIP), 195
Hurley, K., et al. 1994, in AIP Conf. Proc. 307, Gamma-ray Bursts, 2nd Huntsville Workshop, ed. G. J. Fishman, J. J. Brainerd, & K. Hurley (New York: AIP), 726
in ’t Zand, J. J. M., & Fenimore, E. E. 1996, ApJ, 464, 622
in ’t Zand, J. J. M., Heise, J., van Paradijs, J., & Fenimore, E. E. 1999, ApJ, 516, L57
Jourdain, E. 1990, Ph.D. thesis, C.E.S.R., Paul Sabatier Univ., Toulouse
Kargatis V. E., Liang, E. P., Hurley, K. C., Barat, C., Eveno, E., & Niel, M. 1994, ApJ, 422, 260
Kargatis, V. E., et al. 1995, A&SS, 231, 177
Klebesadel, R. W., Strong, I. B., & Olson, R. A. 1973, ApJ, 182, L85
Kouveliotou, C., Paciesas, W. S., Fishman, G. J., Meegan, C. A., & Wilson, R. B. 1992, in The Compton Observatory Science Workshop, ed. C. R. Shrader, N. Gehrels & B. Dennis (Greenbelt: NASA/GSFC), 61
Kouveliotou, C., Paciesas, W. S., Fishman, G. J., Meegan, C. A., & Wilson, R. B. 1993 A&AS, 97, 55
Laros, J. G., Evans, W. D., Fenimore, E. E., Klebesadel, R. W., Shulman, S., & Fritz, G. 1984, ApJ, 286, 681
Laros, J. G., et al. 1985, ApJ, 290, 728
Lee, A., Bloom, E., & Scargle, J. 1998, in AIP Conf. Proc. 428, Gamma-ray Bursts, 4th Huntsville Symposium, ed. C. A. Meegan, R. D. Preece & T. M. Koshut (New York: AIP), 261
Li, H., & Fenimore, E. E. 1996, ApJ, 469, 115L
Liang, E. P. 1982, Nature, 299, 321
Liang, E. P., & Kargatis, V. E. 1996, Nature, 381, 495
Liang, E. P., Kusunose, M., Smith, I. A., & Crider, A. 1997, ApJ, 479, L35
Lloyd, N., & Petrosian, V. 1999, ApJ, 511, 550
Lochner, J. C. 1992, in AIP Conf. Proc. 265, Gamma-Ray Bursts, ed. W. S. Paciesas, & G. J. Fishman (New York: AIP), 289
Loredo, T. J., & Epstein, R. I. 1989, ApJ 336, 896
Matz, S. M., et al. 1985, ApJ, 288, L37
Mazets, E. P., et al. 1981, Nature, 290, 378
Mazets, E. P., Golenetskii, S. V., Ilyinskii, V. N., Guryan, Yu. A., & Aptekar, R. L. 1982, Ap&SS, 82, 261
Mészáros, P., & Rees, M. J. 1993, ApJ, 405, 278
Mészáros, P., & Rees, M. J. 1997, ApJ, 476, 232
Mészáros, P., Rees, M. J., & Papathanassiou, H. 1994, ApJ, 432, 181
Metzger, M., et al. 1997, Nature, 387, 878
Mitrofanov, I. G., Chernenko, A. M., Pozanenko, A. S., Paciesas, W. S., Kouveliotou, C., Meegan, C. A., Fishman, G. J, & Sagdeev, R. Z. 1994, in AIP Conf. Proc. 307, Gamma-ray Bursts, 2nd Huntsville Workshop, ed. G. J. Fishman, J. J. Brainerd & K. Hurley (New York: AIP), 187
Mitrofanov, I. G., Chernenko, A. M., Pozanenko, A. S., Briggs, M. S., Paciesas, W. S., Fishman, G. J., Meegan, C. A., & Sagdeev, R. Z. 1996, ApJ, 459, 570
Murakami, T., et al. 1988, Nature, 335, 234
Norris, J. P., et al. 1986, ApJ, 301, 213
Norris, J. P., Nemiroff, R. J., Scargle, J. D., Kouveliotou, C., Fishman, G. J., Meegan, C. A., Paciesas, W. S., & Bonnell, J. T. 1994, ApJ, 424, 540
Norris, J. P., Nemiroff, R. J., Bonnell, J. T., Scargle, J. D., Kouveliotou, C., Paciesas, W. S., Meegan, C.A., & Fishman, G. J. 1996, ApJ, 459, 393
Palmer, D. M., et al. 1994, ApJ, 433, L77
Palmer, D. M., et al. 1996, in AIP Conf. Proc. 384, Gamma-ray Bursts, 3rd Huntsville Symposium, ed. C. Kouveliotou, M. F. Briggs & G. J. Fishman (New York: AIP), 218
Panaitescu, A., Wen, L., Laguna, P., & Mészáros, P. 1997, ApJ482, 942
Pendleton, G. N., et al. 1994, ApJ, 431, 416
Pendleton, G. N., et al. 1997, ApJ, 489, 175
Petrosian, V., Lloyd, N., & Lee, A. 1999, these proceedings
Piro, L., et al. 1998, A&A, 329, 906
Preece, R. D., Briggs, M. S., Mallozzi, R. S., & Brock, M. N. 1996a, WINGSPAN v 4.4 manual
Preece, R. D., Briggs, M. S., Pendleton, G. N., Paciesas, W. S., Band, D. L., Ford, L. A., & Kouveliotou, C. 1996b, in AIP Conf. Proc. 384, Gamma-ray Bursts, 3rd Huntsville Symposium, ed. C. Kouveliotou, M. F. Briggs & G. J. Fishman (New York: AIP), 243
Preece, R. D., Briggs, M. S., Pendleton, G. N., Paciesas, Matteson, J. L., Band, D. L., Skelton, R. T., & Meegan, C. A. 1996c, ApJ, 473, 310
Preece, R. D., Pendleton, G. N., Briggs, M. S., Mallozzi, R. S., Paciesas, W. S., Band, D. L., Matteson, J. L., & Meegan, C. A. 1998a, ApJ, 496, 849
Preece, R. D., Briggs, M. S., Mallozzi, R. S., Pendleton, G. N., Paciesas, W. S., & Band, D. L. 1998b, ApJ, 506, L23
Preece, R. D. 1999, these proceedings
Preece, R. D., et al. 1999, ApJS, in press (astro-ph/9908119)
Ryde, F. 1999, Astroph. Lett. and Comm., in press (astro-ph/9811462)
Ryde, F., & Svensson, R. 1999a, ApJ, 512, 693
Ryde, F., & Svensson, R. 1999b, ApJ, submitted
Rybicki, G. B., & Lightman, A. P. 1979, Radiative Processes in Astrophysics (New York: Wiley)
Schaefer, B. E., et al. 1992, ApJ, 393, L51
Schaefer, B. E. 1993, ApJ, 404, L87
Schaefer, B. E., et al. 1994, in AIP Conf. Proc. 307, Gamma-ray Bursts, 2nd Huntsville Workshop, ed. G. J. Fishman, J. J. Brainerd, & K. Hurley (New York: AIP), 280
Schaefer, B. E., & Dyson, S. E. 1996, in AIP Conf. Proc. 384, Gamma-ray Bursts, 3rd Huntsville Symposium, ed. C. Kouveliotou, M. F. Briggs & G. J. Fishman (New York: AIP), 96
Schaefer B. E., et al. 1998, ApJ, 492, 696
Schaefer, B. E., & Walker, K. C. 1999, ApJ, 511, L89
Seifert, H. et al. 1997, ApJ, 491, 697
Stern, B. E. 1996, ApJ, 464, L111
Stern, B. E. 1999, in ASP Conf. Series Vol. 161, High Energy Processes in Accreting Black Holes, ed. J. Poutanen & R. Svensson (San Francisco: ASP), 277 (astro-ph/9902203)
Stern, B. E., & Svensson, R. 1996, ApJ, 469, L109
Stern, B. E., Poutanen, J., & Svensson, R. 1997, ApJ, 489, L45
Stern, B. E., Poutanen, J., & Svensson, R. 1999, ApJ, 510, 312
Strohmayer, T. E., Fenimore, E. E., Murakami, T., & Yoshida, A. 1998, ApJ, 500, 873
Tavani, M. 1996, ApJ, 466, 768
Teegarden, B. J. 1982, in AIP Conf. Proc. 77, Gamma-Ray Transients and Related Astrophysical Phenomena, ed. R. E. Lingenfelter, J. C. Higdon & D. M. Worrall (New York: AIP), 123
Thompson, C. 1998, in AIP Conf. Proc. 428, Gamma-ray Bursts, 4th Huntsville Symposium, ed. C. A. Meegan, R. D. Preece & T. M. Koshut (New York: AIP), 737
Yoshida, A., et al. 1989, PASP, 41, 509