Multi-Resolution Imaging and Spectra of Extended Sources
Abstract
I introduce a straightforward technique for the filtering of extended astronomical images into components of different spatial scales. For a positive original image, each component is positive definite, and the sum of all components equals the original image. In this way, the components are each individually suitable for flux measurements and broadband spectra calculations. I present an illustration of this technique on the radio galaxy Cygnus A.
1 Introduction
One common problem in astronomical image processing is the detection of point or small-scale features against a varying background, or more generally, the separation of information on different spatial scales. I introduce a technique for filtering extended astronomical images based on a suggestion in \citeasnounsta98. Images can be decomposed into an arbitrary number of components, each representing structures on different spatial scales and whose sum equals the original image. Each component is positive definite and therefore can be suitable, e.g., for spectral index or optical color studies. The method is similar in some ways to the multi-scale wavelet analysis discussed by [slezak].
I have applied the multiresolution filtering to a number of radio galaxies. I find that the spectra of fine-scale features do not follow a simple pattern, as opposed to the slow gradients which often characterize the more diffuse emission. In this paper, I will show some results on Cygnus A as an example.
2 The Method
For the simplest two-component image separation, the initial image is decomposed into Filtered and Open maps, where .
The Open map is made by first replacing each pixel on the original map by the minimum value in a box of fixed size which slides across the map, (a process called “erosion”), followed by replacing each pixel on the “eroded” map by the maximum value in a sliding box across the map. The result is the Open map. Then, .
The Filtered map now contains only structures with sizes smaller than or on the order of the sliding box size. Everything else, by construction, is in the Open map. The method can be generalized by decomposing the Open map itself into an additional Filtered’ and Open’ map by operating with a larger box on the Open map. This method can be generalized to an arbitrary number of steps. In practice, I have found that a change in box size of approximately four between steps is necessary to isolate independent components.
This technique has been implemented in AIPS with a trivial modification to the task MWFLT and a RUN file to automate the various steps. It would also be quite straightforward to implement, e.g., in IDL. Readers are encouraged to contact the author for details.
3 The Use of Multiresolution Filtering for Spectra
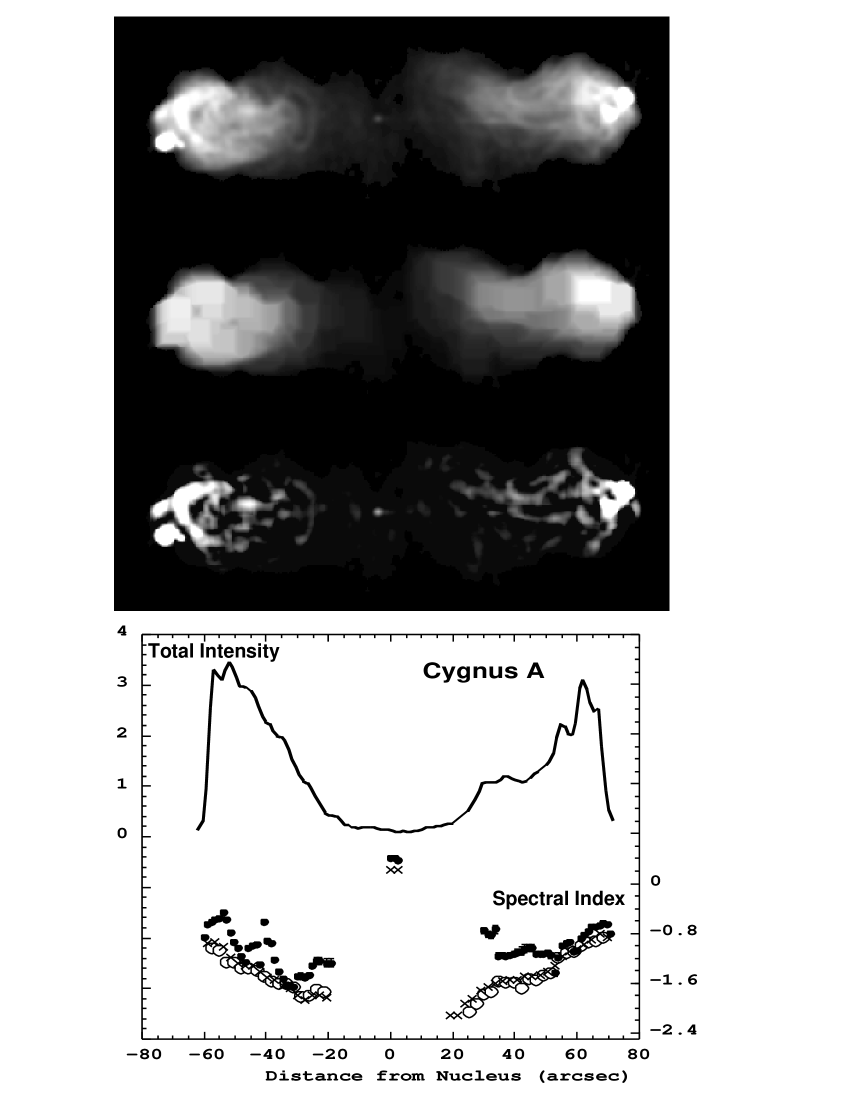
The measurement of spectra in extragalactic radio sources is fraught with problems such as the confusion between overlapping structures, biases due to bowls, and the subjectivity of modelling or other techniques used to isolate features. Each spectral measurement technique, e.g., direct division, the regression, or “T-T” method, or even the tomography we have introduced [kat97], has its own particular problems. Multiresolution filtering offers a complementary method which can be useful when applied with care. I have done a great deal of testing of the robustness of this technique, as will be described in an upcoming paper. An illustration of our results on Cygnus A is shown in Figure 1.
To calculate the spectral index, I first decompose the maps into two or more components. Then, the spectral index can be calculated separately for each component, either by straight division or by regression. In cases where there is a clear bimodal (or more) distribution of spatial scales, this is a meaningful process. If, however, there is a continuous range of spatial scales, then the decomposition and the resultant spectra are somewhat arbitrary. They still may be useful, however, for seeing whether there are differences between fine- and large- scale spectra.
In general, I find that fine-scale structure has a slightly flatter spectral index than the local large-scale structure. For Cygnus A, however, there are locations in the source where the opposite is true. The one-dimensional plots at the bottom of Figure 1 do not show the full range of spectra, but still give an indication of the richness of the fine-scale spectral structure.
Looking at the spectra of the large scale emission (which might be most appropriate for ageing analyses if we could eliminate the problems due to magnetic field variations), we can use this filtering technique to assess/eliminate problems with confusion from small scale structures. In the case of Cygnus A, this turns out not to be a significant problem, as seen by the close correspondence between the spectra of the original (not decomposed) and open maps.
How can the large-scale and fine-scale spectra be different? First, as seen in the numerical simulations such as those presented here by Jones, Tregillis and Ryu, there can be filamentary or other structures with very different particle acceleration and/or loss histories than neighboring features. Alternatively, the local magnetic fields may vary between structures, causing a change in the observed spectral index even if the relativistic particle populations are identical. It is this confusion which causes major problems for standard ageing analyses.
I have also worked with colleagues to experiment with galactic plane continuum data and deep optical/IR images. It appears that multiresolution filtering will be useful for a wide range of astronomical images.
This work is supported by NSF grant AST 96-16964 and AST AST 96-19438 at the University of Minnesota. I am grateful to John Dickey, Andrew Young, Barron Koralesky and Deb Katz-Stone for many useful ideas and feedback.
References
- [1] \harvarditemCarilli et al.1991caril Carilli, C.L., Perley, R. A., Dreher, J.W. & Leahy, J.P., 1999, ApJ, 518,284. \harvarditemKatz-Stone & Rudnick1997Kat97 Katz-Stone, D. M., and Rudnick, L. 1997, ApJ, 488, 146. \harvarditemSlezak, Durrett & Gerbal1994slezak Slezak, E., Durrett, F. and Gerbal, D., 1994, AJ108, 1996. \harvarditemStarck, Murtag and Bijauoi1998sta98 Starck, Murtag and Bijauoi, 1998, Image Processing and Data Analysis, Cambridge Univ. Press.
- [2]