Hubble Space Telescope Observations of the CfA Seyfert 2s: The Fueling of Active Galactic Nuclei11affiliation: Based on observations with the NASA/ESA Hubble Space Telescope obtained at the the Space Telescope Science Institute, which is operated by the Association of Universities for Research in Astronomy, Incorporated, under NASA contract NAS5-26555.
Abstract
We present an investigation of possible fueling mechanisms operating in the inner kiloparsec of Seyfert galaxies. We analyze visible and near-infrared Hubble Space Telescope images of 24 Seyfert 2s from the CfA Redshift Survey sample. In particular, we are searching for the morphological signatures of dynamical processes reponsible for transporting gas from kiloparsec scales into the nucleus. The circumnuclear regions are very rich in gas and dust, often taking the form of nuclear spiral dust lanes on scales of a few hundred parsecs. While these nuclear spirals are found in 20 of our 24 Seyferts, we find only 5 nuclear bars among the entire sample, strongly reinforcing the conclusions of other investigators that nuclear bars are not the primary means of transporting this material into the nucleus. An estimate of the gas density in the nuclear spirals based on extinction measurements suggests that the nuclear spiral dust lanes are probably shocks in nuclear gas disks that are not strongly self-gravitating. Since shocks can dissipate energy and angular momentum, these spiral dust lanes may be the channels by which gas from the host galaxy disks is being fed into the central engines.
1 Introduction
An important unsolved problem in the study of active galactic nuclei (AGN) is how the central massive black hole is fueled. In particular, if the primary fuel source is interstellar gas and dust in the host galaxy, how is that material transported from kiloparsec scales into the central parsecs of the galaxy and onto the supermassive black hole? In order to fuel the AGN, this material must somehow lose nearly all of its angular momentum. Estimates of the mass accretion rate to power AGN range from more than per year for the most luminous quasars to per year for the Seyfert galaxies discussed here. Thus, over an AGN’s lifetime (107-8 years?) a significant amount of material must be transported inwards to feed the central black hole.
A number of dynamical mechanisms have been proposed that could remove angular momentum from the host galaxy’s gas and thus supply the fueling rates required to match the observed luminosities of AGN. These include tidal forces caused by galaxy-galaxy interactions (Toomre & Toomre 1972) and stellar bars within galaxies (Schwartz 1981).
Numerical simulations of galaxy interactions (Hernquist 1989; Barnes & Hernquist 1991; Mihos, Richstone, & Bothun 1992; Bekki & Noguchi 1994; Bekki 1995) have shown that strong perturbations on a galaxy disk due to a close encounter with another galaxy can trigger the infall of large amounts of gas into the central 1 kpc to 10 pc, depending on the simulation resolution, the type of encounter, and the properties of the simulation. Further, relatively minor encounters (“minor mergers”, Hernquist 1989; Mihos & Hernquist 1994; Hernquist & Mihos 1995) can lead to significant gas infall, so one need not invoke disruptive encounters. Observationally, there is ample evidence of past or on-going tidal encounters and companions among nearby luminous QSOs (Hutchings & Neff 1988, 1992, 1997; Bahcall et al. 1995a,b, 1997), but at most only a mild statistical excess of interactions or close companions is seen among the lower-luminosity Seyfert galaxies (Adams 1977; Petrosian 1982; Dahari 1984; Keel et al. 1985; Keel 1996; DeRobertis, Hayhoe, & Yee 1998).
In barred galaxies, the triaxial stellar potential leads to a family of orbits for the stars and gas that can transport material into the inner 1001000 pc of the galaxy. Models of orbits using 2-D and 3-D hydrodynamic simulations of gas and stars in barred potentials (Athanassoula 1992; Friedli & Benz 1993; Piner, Stone, & Teuben 1995) have shown the formation of a shock front at the leading edge of a bar. Material builds up in this shock and falls into the nuclear region, generally forming a nuclear ring with a diameter approximately equal to the bar’s minor axis (1001000 pc). Observations of apparent shock fronts at the leading edges of bars and velocity distributions in barred galaxies are in general agreement with inflow models (Quillen et al. 1995; Regan, Vogel, & Teuben 1997), and provide evidence that the dynamical behavior predicted by the models is realistic.
However, the typical semiminor axis of a bar is still 1001000 pc, and thus while bars might plausibly transport material reasonably close to the center, an additional mechanism is needed to move the material into the nucleus proper. A mechanism proposed to complete the transport of material into the nucleus is the ‘bars within bars’ scenario (Shlosman, Frank, & Begelman 1989; Maciejewski & Sparke 1997; Erwin & Sparke 1998). In this model, a large-scale bar transports material into a kiloparsec-scale disk. This gaseous disk then becomes unstable to bar formation, creating a miniature ‘nuclear’ bar that transports the gas to within approximately 10 pc of the galactic nucleus, which is approximately where the central supermassive black hole’s potential can take over. While large-scale bars in galaxies are readily observable due to their large angular size, small-scale, nuclear bars (Shaw et al. 1995) are a factor of 5 to 10 smaller and thus are more difficult to resolve in distant galaxies. Because of their smaller physical size, nuclear bars were initially discovered in relatively nearby galaxies (de Vaucouleurs 1975; Kormendy 1979; Buta 1986a,b).
Observationally, investigations of the relative fraction of bars in AGN as compared to non-active galaxies have failed to turn up a significant excess of bars among spirals harboring AGN (Kotilainen et al. 1992; McLeod & Rieke 1995; Alonso-Herrero, Ward, & Kotilainen 1996; Mulchaey & Regan 1997). Similarly, searches for nuclear bars using the Hubble Space Telescope (HST) have failed to find them in numbers sufficient to salvage the bar fueling picture (Regan & Mulchaey 1999). We shall reach a similar conclusion in this paper. At most, these observations have shown that nuclear bars are present in only a minority of Seyferts.
This is not to say that bars and interactions are not viable fueling mechanisms as clearly they are operating in a number of Seyferts. The point is that neither is the dominant mechanism, nor necessarily responsible for fueling the AGN in all cases. What is responsible for fueling an AGN in the majority of cases where there is no evidence for either interactions or bars? One way of addressing this question is to assay the amount of potential fuel in the form of interstellar dust and gas in the inner kiloparsec of nearby Seyfert galaxies. Indeed, while Regan & Mulchaey (1999) failed to find a preponderance of nuclear bars in their HST imaging sample of 12 Seyferts, they did find one common morphological structure: spiral arms of dust, of greater or lesser degrees of organization, in the inner few hundred parsecs.
In this paper we present new, high angular resolution HST near-infrared NICMOS images combined with archival WFPC2 images of the nuclear regions of a representative sample of 24 Seyfert 2s to search for dynamical and morphological signatures of AGN fueling. In section 2 we describe our sample selection, and our observations in section 3. In section 4 we describe the nuclear morphology derived from direct flux and color maps to search for nuclear bars and circumnuclear dust structures. Section 5 describes the possible role of these structures in fueling the AGN, and we summarize our results and conclusions in section 6.
2 Sample Selection
The history of the study of interactions among Seyfert galaxies serves to illustrate the main difficulty in drawing conclusions on the nature of AGN from studies of statistical samples, namely the problem of defining an unbiased sample and identifying a suitable control group. As discussed by Keel (1996), the reexamination of interacting galaxy samples illustrated the importance of matching host galaxy types and luminosities (Fuentes-Williams & Stocke 1988). In the last decade, better defined samples of AGN, for example the Center for Astrophysics (CfA) sample (Huchra & Burg 1992) and the Revised Shapley-Ames (Sandage & Tammann 1987) sample of Seyfert galaxies (Maiolino & Rieke 1995), have greatly assisted statistical studies of the AGN population.
The CfA Redshift Survey (Huchra et al. 1982) obtained spectra of a complete sample of 2399 galaxies down to a limiting photographic magnitude of . This relatively unbiased survey avoids many of the problems of traditional surveys for AGN, particularly those based on ultraviolet excesses which are biased against reddened AGN and thus preferentially detecting Seyfert 1s and Seyferts in host galaxies with active star formation. This sample also has the often overlooked advantage of a uniform set of spectral classifications obtained with high signal-to-noise ratio that provides comparable detection limits for weak broad-line components (Osterbrock & Martel 1993). This is essential for making meaningful classifications of Seyfert types 1.8, 1.9, and 2 (Osterbrock 1981) for distinguishing objects with and without obvious broad-line components.
Studies of the relative frequency of close companions among the CfA Seyferts have shown that this sample has only a marginal excess of companions, although a larger fraction of the Seyferts do appear to be currently undergoing the final stages of a past interaction (DeRobertis, Hayhoe, & Yee 1998). In contrast, this same study emphasizes that a small but significant number of the CfA Seyferts show no morphological evidence for recent interactions. Infrared wavelength imaging also shows no signature of a violent interaction history in this sample (McLeod & Rieke 1995), nor does it detect an excess of nuclear bars.
For this study, we have chosen 24 of the 25 Seyfert 2s (including types 1.8 and 1.9 as classified by Osterbrock & Martel 1993) in the CfA sample. We are concentrating on just the Seyfert 2 galaxies because they in general have fainter nuclear point sources than Seyfert 1s (Nelson et al. 1996; Malkan, Gorjian, & Tam 1998), and thus the circumnuclear environment is relatively unaffected by the contamination from the complex HST point-spread function (PSF). This is especially true with NICMOS where the PSF is very complex (MacKenty et al. 1997).
3 Observations
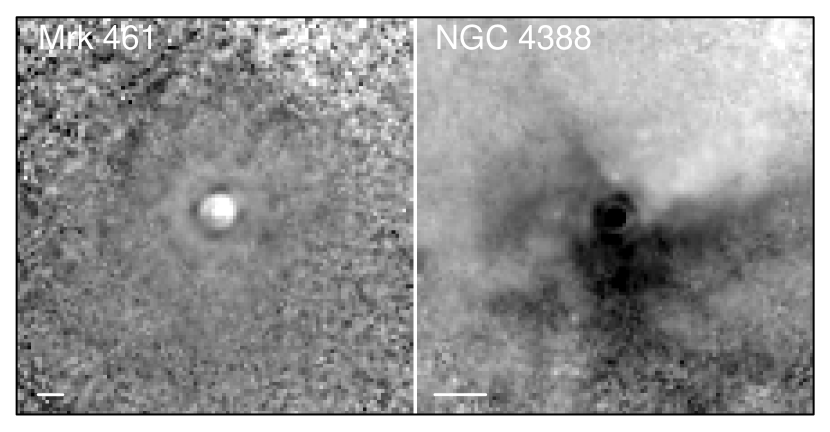
Our observations are comprised of archival visible-band and new near-infrared HST images. The visible wavelength WFPC2 images include all of the Seyfert 2 galaxies in the CfA sample with the exception of NGC 4388 and Mrk 461 (neither have been observed to date with broad-band filters). Most of the visible images were from a snapshot survey of AGN (GO-5479, see Malkan, Gorjian, & Tam 1998) and are single 500s exposures taken through the F606W filter. The remaining archival images were taken through the F547M filter from a variety of programs. Table 1 lists the properties of the sample galaxies and which of these two visible band filters (hereafter referred to collectively as the filter) was used to obtain the band galaxy image used in this investigation. The images were all obtained with the nucleus roughly centered on the PC1 detector of WFPC2, which has a plate scale of 004553 pixel-1 and a total effective field of view of 356 (Biretta et al. 1996).
We obtained near-infrared and band images of 23 of our Seyfert sample with the HST NICMOS Camera 1 during Cycle 7 (Project GO-7867). The remaining galaxy in our sample, NGC 1068, was observed by the NICMOS team as part of their Guaranteed Time Observations. We chose Camera 1 as its plate scale (0043 pixel-1) is closest to that of the PC1 camera ( 0046 pixel-1), although with a substantially smaller field of view (11″). The near match in plate scale between the visible and infrared images is helpful for matching images from the two cameras and achieving the best sampling of the resolutions of the two cameras. Further, the surface brightness of the underlying host galaxies falls off sufficiently fast that we would have obtained less signal-to-noise in the outer regions of NICMOS Camera 2 at a cost of coarser pixel sampling (0075 pixel-1). Our images were taken through both the F110W and F160W filters (hereafter and , respectively), which are each approximately 2000 Å wide and are centered at 1.1 m and 1.6 m.
In each filter we acquired images at four dither positions separated by 1″ (SPIRAL-DITH pattern) so that the effects of bad pixels and other detector artifacts could be eliminated. At each dither position we used an exposure ramp (STEP128) for a total of 256 seconds per position. This allows us to correct for any saturated pixels that might occur if the nucleus is brighter at near-IR wavelengths than suggested by the archival WFPC2 imaging (as would be expected if the nuclei are dusty). The final shifted and combined frames have a cumulative exposure time of 1024 seconds per filter. This was done for each galaxy, resulting in a homogeneous set of relatively deep near-infrared images of the central 11″ of these galaxies.
To calibrate this dataset we had to perform several additional processing steps beyond the standard HST data-reduction pipeline. For the WFPC2 images, this consisted of cosmicray removal and absolute flux calibration. The flux calibration included transforming our F547M and F606W to the Johnson/Cousins system by using the STSDAS SYNPHOT package to convolve a series of galaxy templates with both Johnson and the HST filters.
For the infrared images we shifted and added the four individual exposures from the CALNICA part of the data reduction pipeline (MacKenty et al. 1997) after masking out individual bad pixels and detector artifacts. We chose not to use the CALNICB part of the standard data reduction pipeline as this task attempts to subtract the background from the final mosaic image. As our observations were not through filters contaminated by thermal emission, this step was not necessary. Furthermore, the background subtraction attempted by the CALNICB pipeline was in fact subtracting the flux level due to extended emission from these galaxies, a problem that was particularly acute for our brighter targets that covered the entire array. We finally flux-calibrated our data using the transformations derived by Stephens et al. (2000) to place the near-infrared images on the CIT system. We will present the full atlas of our observations in a future publication.
4 Nuclear Morphology
4.1 Color Maps
If there is cold gas flowing into the nuclear ( pc) regions from the host galaxy, we should see evidence of this material in the form of dust lanes extending from large scales into the nuclear regions. Dust is a useful tracer of this material as it is generally well-mixed with gas and can be detected by its attenuation of light from background stars. Our infrared images primarily trace the stellar distribution in these galaxies, while the visible wavelength images trace both the stellar distribution and the dust. We combined these images to form color maps of all of the galaxies for which we had visible band HST data to map the dust distribution.
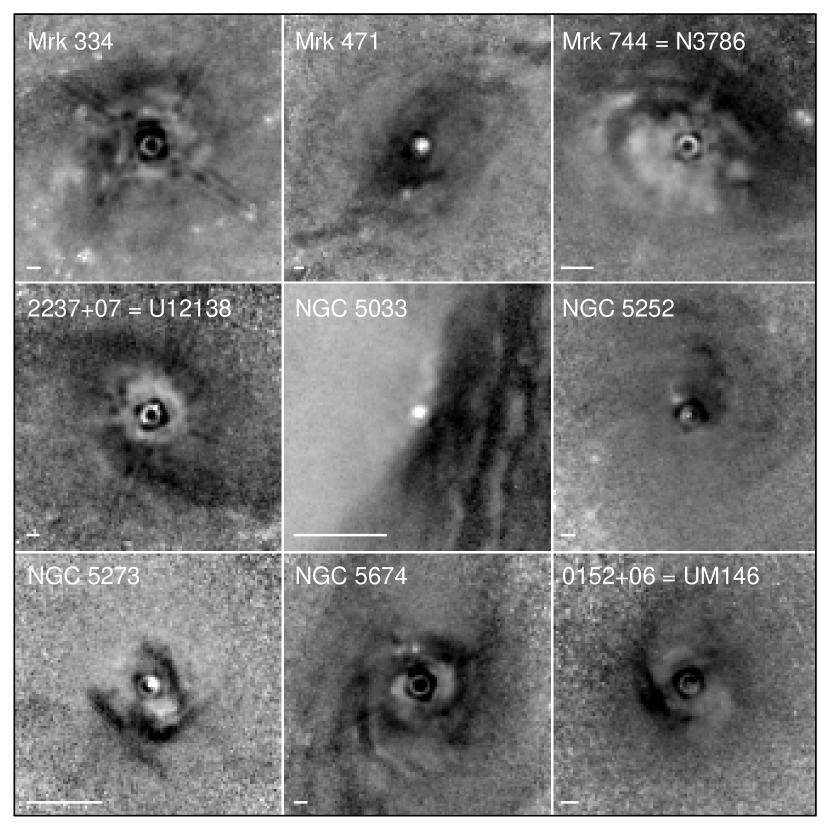
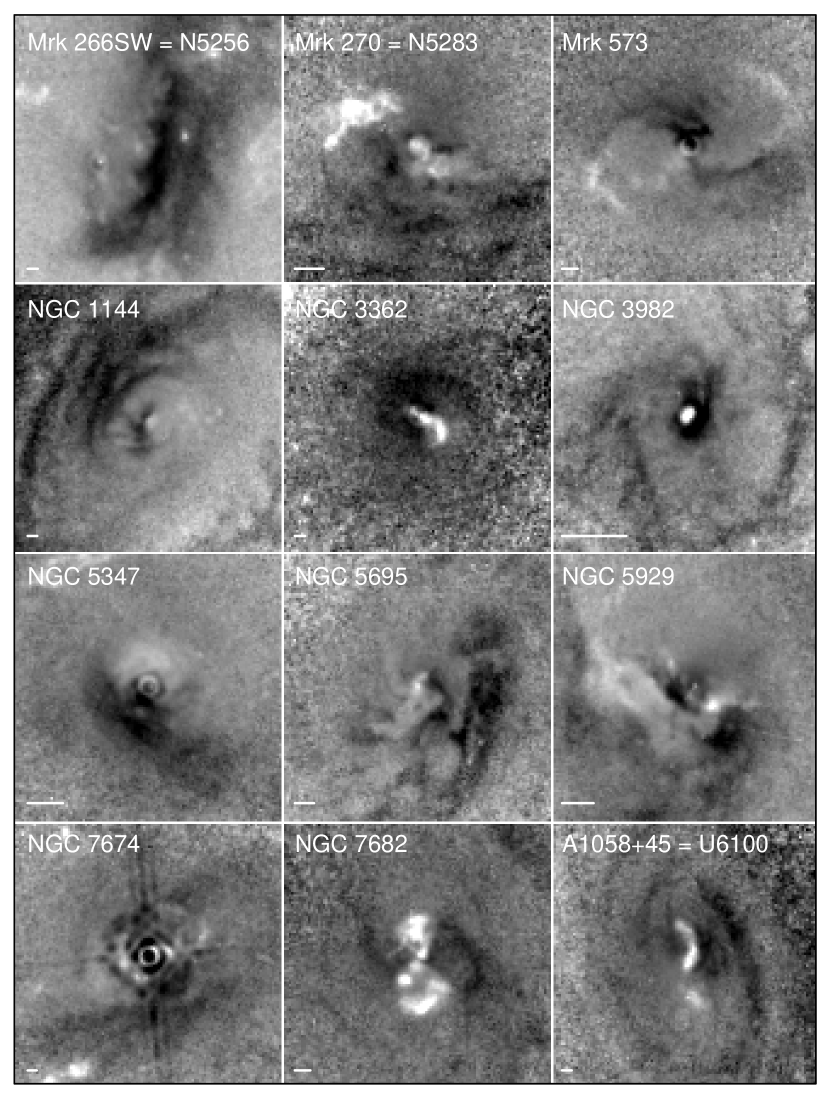
Figure 1 shows the color maps for the Seyfert 1.8s and 1.9s in our sample, while Figure 2 shows the color maps for the Seyfert 2s. In Figure 3 we show the color maps for Mrk 461 and NGC 4388, the two galaxies for which we do not have visible-band HST imaging. These images are 5″ on a side, corresponding to projected spatial sizes between 2.7 kpc and 125 pc in the galaxies for km s-1 Mpc-1. The 2pixel resolution element is 0091, corresponding to projected spatial scales between 50 pc and 2.3 pc. In Table 1, column 8 we list the physical scale corresponding to 1″ at the distance of each galaxy. To provide a visual reference, a bar showing 100 pc projected distance at the galaxy is drawn in the bottom left corner of each frame.
To exactly match the plate scales of the two images, we rebinned our NICMOS images to the plate scale of the PC1 chip using a geometric transformation. Though the resolutions of the two cameras are different, we did not smooth our and images to a common resolution. As a result our color maps, particularly those galaxies with a bright nucleus at , show artifacts of the resolution mismatch as small, “red” rings at the position of the nucleus (e.g. Mrk 334, Mrk 744) as well as “red” spikes from the NICMOS diffraction pattern (e.g. Mrk 334). We did not smooth the and images to a common resolution as we found that this substantially decreased the contrast of the dust features in these color maps. This resolution mismatch, however, introduces small uncertainties into our estimate of the amount of reddening present in the color maps. We discuss this further in section §4.3 below.
The images shown in Figures 1, 2 & 3 reveal a wide range of morphologies, including nuclear spiral patterns, stellar bars, and irregular, clumpy dust distributions. In Table 2 we list our morphological classification for each galactic nucleus. The most common morphology we find in these images are nuclear spiral dust lanes, generally extending into the inner pc. These nuclear spiral arms are wound in the same direction as the main disk spiral arms, but they do not appear to be continuations of the main disk spiral arms. In many of the galaxies with large-scale bars, these nuclear dust spirals are clearly connected to dust lanes along the leading edge of the bar, similar to what is seen in the hydrodynamic simulations of Athanassoula (1992). The most striking examples are Mrk 471, UGC 12138, NGC 5674, NGC 3362, NGC 5347, and NGC 7674.
The nuclear spiral dust lanes in Figures 1, 2, & 3 exhibit a variety of spiral morphologies, ranging from relatively tightly wound arms (e.g., NGC 1144 and UGC 6100) to loosely wound arms (e.g., UGC 12138 and Mrk 573). We find examples of one-sided spiral arms (e.g., NGC 3982 and Mrk 270), two-arm, “grand-design” spirals (e.g., UGC 12138 and NGC 7682), and multi-armed, “flocculent” spirals (e.g., Mrk 334 and NGC 5674). Often it is easier to see spiral arms on one half of the image than the other, indicating that the gas disks containing the spiral structure are inclined to the line of sight and we are more clearly seeing the dust lanes on the near side of the galaxy (e.g. Mrk 744 and NGC 1144).
In some of our color maps we also see regions with very blue colors. These include diffuse “blue” regions that are due to extended emission-line gas and bright, unresolved knots of blue light that are likely regions of OB star formation. In particular, these latter regions are found in Mrk 334, Mrk 744, Mrk 266SW, and NGC 7682 (Figures 1 & 2). While we do not have UV imaging to confirm that there is significant star formation in these sources, some authors (Heckman et al. 1995, 1997; González Delgado et al. 1998) have proposed that massive star formation on 100 pc scales may be a significant contributor to the continuum emission in some Seyfert 2s. These galaxies may therefore be candidates for such Seyfert 2–Starburst galaxies.
4.2 Nuclear Bars
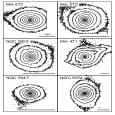
Nuclear stellar bars have been implicated as a possible mechanism for removing angular momentum from gas on 100’s of parsec scales and transporting it to the inner 10’s of parsecs, where the central supermassive black hole begins to dominate the gravitational potential. Recent ground-based (Mulchaey & Regan 1997) and HST observations (Regan & Mulchaey 1999) have shown that most Seyfert galaxies do not have nuclear bars, implying that some other mechanism is responsible for transporting interstellar gas to the central engine. Our data confirm and extend their conclusions with a larger, representative sample of Seyfert 2s. We searched for nuclear bars by qualitatively examining the isophotal contour maps of our , and images. In several galaxies we also found straight dust lanes in the color maps, but in all cases the bar signature was clearly visible in the isophotal contour maps (see Figure 4). In a future paper we will present a more quantitative analysis of bar selection in these galaxies.
We find at most 5 nuclear bars among the 24 galaxies in our sample (see Figure 4). Mrk 573 is the best example of a double-barred galaxy in our sample. It has both a host-galaxy bar and a nuclear bar as seen in previous ground-based and HST visible-wavelength imaging (Pogge & DeRobertis 1993; Capetti et al. 1996), and there is a clear straight dust lane going into the nucleus in visible and visible/near-IR color maps (Pogge 1996; Capetti et al. 1996; Quillen et al. 1999). The appearance of this dust lane in the color map is consistent with dust lanes at the leading edge of the bar (cf. Quillen et al. 1999). The nuclear bar in Mrk 270 is apparent at visible and infrared wavelengths, and there is a straight dust lane in the color map oriented nearly perpendicular to the bar major axis. NGC 5929 has a distinct nuclear bar in the near-infrared images, but it is hidden by dust in the visible-light images. The color map of this galaxy shows the nuclear region is very dusty with an irregular dust morphology. Mrk 471 shows evidence for a nuclear bar in both the near-infrared surface brightness image and through straight dust lanes in the color map. The lowest surface brightness contours in Figure 4 also show the large-scale bar in Mrk 471.
Regan & Mulchaey (1999) report a nuclear bar in NGC 5347. While this galaxy has a clear large-scale bar seen at visible and IR wavelengths (McLeod & Rieke 1995), the nuclear bar is less obvious in the band image (also shown in Figure 4). While we will retain the classification of this galaxy as nuclear barred in the interests of setting a strong upper limit on the nuclear bar fraction in Seyferts, we consider this the weakest case for a nuclear bar of the 5 we have found.
Peletier et al. (1999) have suggested that there is a nuclear bar perpendicular to the main galaxy bar in NGC 5674 at visible wavelengths, but we do not see it in our near-infrared images (Figure 4). Instead, we find a great deal of dust in this galaxy at the position angle of both semiminor axes and thus the “bar” apparent at visible wavelengths is most likely an artifact of the circumnuclear dust distribution. This underscores the advantage of using near-infrared images to search for and confirm suspected nuclear bars, as dust can greatly distort the nuclear surface brightness profiles at visible wavelengths.
Finally, nuclear bars that are heavily enshrouded by dust may not reveal their presence with straight dust lanes in color maps. If nuclear bars are generally hidden by large quantities of dust, however, straight dust lanes may be visible in color maps. We have created color maps for all of the galaxies in our sample, but find no additional evidence for nuclear bars in the color maps that were not detected in our , , or images.
4.3 Circumnuclear Dust Lanes
Seyferts, like more quiescent spirals, have a central stellar component that consists of a disk and a central bulge. In the nuclear regions there is additional light from the AGN and the extended narrow-line region. This latter region is partially resolved in many HST images of Seyferts (Bower et al. 1994; Simpson et al. 1997; Malkan et al. 1998). The near-infrared continuum emission from the unresolved active nucleus proper may also include a contribution from hot dust (e.g., Glass & Moorwood 1985; Alonso-Herrero et al. 1998; Glass 1998).
The presence of circumnuclear dust manifests itself in our images in two ways. First, we expect there to be a relatively uniform distribution of diffuse dust spread throughout the volume of the nuclear bulge and disk of the host galaxy. This component will be difficult to measure as it is expected to be well mixed with the stars. Second, we expect discrete clouds of gas and dust, most likely organized into a disk confined to a plane (or warped slightly), which could give rise to the spiral dust lanes seen in the color maps (Figures 1, 2, & 3).
Diffuse gas and dust uniformly distributed in the central regions of the galaxies would have a relatively low integrated mass, and so is unlikely to be a significant contributor to the fuel reserves of the active nuclei. The discrete, dense dust structures we see in the nuclear disks, however, particularly in the spiral dust lanes, are a more probable fuel source. As these spiral dust lanes are likely to be confined to a disk, their net extinction can be estimated by treating them as a thin, obscuring slab of material and using the change in color between the arm and interarm regions as an estimate of the total extinction, . We define the color excess due to dust in the nuclear disk as:
This excess color is used to estimate the total visual extinction, , via a standard interstellar extinction curve (Mathis 1990). The color excess could also be used for this purpose, but due to the close proximity of these filters in wavelength, they do not provide as precise a measure of . By relating this to a column density of hydrogen atoms, cm for an reddening law (Bohlin, Savage, & Drake 1978) and converting this into a mass column density, we can obtain a rough estimate of the surface density of these disks:
The disk surface density derived by this technique actually estimates the maximum surface density rather than the average. However, as discussed in detail below, this measure of will tend to underestimate the true value of due to uncertainties in the dust geometry and instrumental effects. We therefore chose this conservative approach to estimating the average disk surface density so as to minimize the likelihood that we have significantly underestimated the surface density.
While this estimate is computationally straightforward, there are several systematic effects at work that combine to make these estimates lower limits on the true gas surface density. First, we have used a very simple foreground screen as our dustlane model. A more physically realistic model would be a dust screen sandwiched between two layers of stars, corresponding to the stars behind and in front of the dust relative to the line of sight. For an equal amount of starlight on either side of the dust lane, the arm-interarm defined above reaches a maximum of at for a smooth dust layer. A patchy or clumpy distribution, as discussed below, would increase these numbers. Scattering is another vital component to a realistic dust model. Dust particles are strongly forward scattering and more likely to scatter blue light than red light, causing a “bluing” of the starlight that could counteract, in part, the reddening due to absorption. Significant scattering would reduce the observed , thus leading us to underestimate the total column density of material in these nuclear spiral arms. We estimated the magnitude of scattering by incorporating the “Dusty Galactic Nuclei” model of Witt, Thronson, & Capuano (1992) into our dust sandwich model. We find that scattering can decrease the observed by a factor of two, corresponding to an increase in the disk surface density by the same factor. The simple foreground screen model we have used to estimate the disk surface density therefore results in an underestimate of the true disk surface density by a factor which depends on the true dust geometry, but is useful as it sets a lower limit on the surface density.
Another complication to our estimate of the disk surface density is that our images do not resolve small-scale dust structures in these dust lanes. Studies of the arm-interarm extinction in overlapping galaxies (White & Keel 1992; White, Keel, & Conselice 1996; Berlind et al. 1997) show that while the large-scale dust lanes are optically thin, the extinction law in the spiral arms tends to be grayer than a standard Galactic extinction law, primarily due to unresolved, optically thick clumps (Berlind et al. 1997). Unresolved clumps of dust in these nuclear spirals, particularly in the more distant galaxies, would lead to a grayer extinction law than assumed here, resulting in an underestimate of the total dust mass.
A second resolution effect is due to the finite resolution of the WFPC2 and NICMOS cameras. Many of the dust lanes in our color maps are unresolved or only marginally resolved. We have therefore constructed a simple model of a dust lane to estimate the magnitude of this effect. We constructed models of dust lanes by creating a series of artificial images at and of “ideal” dust lanes in which the dust lane was a step function in flux at a range of widths and (note that for ; Mathis 1990). We then convolved these images with the HST PSF for the PC1 camera and NICMOS Camera 1 from TinyTim (Krist & Hook 1999) and measured the difference as a function of the width of the unconvolved dust lane in units of PC1 pixels. In Figure 5 we plot the difference in to illustrate the effect of unresolved and marginally resolved dust lanes on measurements of the extinction (solid lines). The lines correspond to input values of 1.1, 0.8, and 0.4 with the top line corresponding to the largest we measured. This figure shows that unresolved dust lanes may cause us to underestimate by up to a factor of three for the most heavily reddened dust arms in this sample.
A further complication is the resolution mismatch between the PC1 and NICMOS Camera 1, which corresponds different widths for the and PSFs. Creating a color map corresponds to dividing a band image of the galaxy that has been convolved with the narrower WFPC2 PSF by an band image that has been convolved with the broader NICMOS PSF. The result is a weak unsharp masking effect that causes the color to be slightly larger in unresolved or marginally resolved dust lanes. To measure the size of this effect, we repeated the exercise discussed above, but convolved both the and band image with the same PSF (in this case the PSF for the F606W filter and PC1 detector). We have plotted the results of this test (dotted lines) on Figure 5 for the same values and, as expected, the model dust lanes convolved with different PSFs are systematically redder than the model dust lanes convolved with identical PSFs. The magnitude of this effect, however, is much less than that due to convolving the model dust lanes with a PSF in the first place.
A final factor that introduces systematic uncertainties into the measurement of is the possible presence of diffuse line emission. As mentioned above, we are resolving the narrow-line region in several of these galaxies. In particular, Mrk 270, Mrk 573, NGC 3362, NGC 7682, and UGC 6100 all show bright, extended line emission in the F606W images that result in “blue”, and often cone-shaped, structures in their color maps. The bow-shaped emission line region in Mrk 573 and other Seyfert 2s have been previously studied with HST by Falcke, Wilson & Simpson (1998). Capetti et al. (1996) have seen similar structures in HST images of the narrow line regions in Seyfert 2s. In addition to these discrete structures, there may also be faint, diffuse line-emitting gas spread throughout the circumnuclear regions. Since the F606W filter contains the bright [O III] and H lines, a significant emission-line contamination is possible. We estimated the contribution of emission lines to a variety of Seyfert 2 spectra with the STSDAS SYNPHOT package. This exercise showed that if these lines have a total equivalent width of 100 Å, they would still only increase the band surface brightness by magnitudes. The contribution to the total flux in the F606W filter is small because the filter has an effective width of approximately 1500 Å. The brightest contributors to the band surface brightness, the hydrogen Brackett lines, are significantly lower equivalent width than their visible-wavelength counterparts and therefore the emission-line contribution to the band is expected to be unimportant. In addition to requiring a very high equivalent width to affect the band flux, this emission would have to be correlated or anticorrelated with the dust lanes to lower or raise, respectively, the measured .
To summarize our results, our () color maps of these galaxies exhibit dust lanes with a range in corresponding to inferred mass surface densities of pc-2. While we have overestimated the average surface density by measuring the maximum value of , the dust model and resolution effects could offset this as they lead to an underestimate of the total column density. These surface densities imply that these nuclear disks contain at least of interstellar material in the inner pc. As Seyfert galaxies require mass accretion rates of yr-1 (e.g. Peterson 1997) to fuel their nuclear luminosities, these circumnuclear disks are massive enough to act as potential reservoirs for fueling the AGN.
5 Nuclear Spirals and Fueling
Nuclear spirals like those we have shown here have been observed in quiescent spirals (Phillips et al. 1996; Carollo, Stiavelli, & Mack 1998; Elmegreen et al. 1998; Laine et al. 1999), as well as in Seyfert galaxies (Quillen et al. 1999; Regan & Mulchaey 1999). These nuclear spirals are dynamically distinct from the large-scale spiral arms seen in spiral galaxies as they may lie inside the inner Lindblad Resonance of the outer spiral arms (Elmegreen, Elmegreen, & Montenegro 1992) and they may also be shielded by the dynamical influence of the galaxy’s nuclear bulge (Bertin et al. 1989). The nuclear spiral dust lanes appear to differ from the large-scale spiral structure of their hosts in two important ways: they are unlikely to be the result of gravitational instabilities in self-gravitating disks, and their sound speed is likely to be comparable to the orbital speed.
Elmegreen et al. (1998) estimated the value of Toomre’s (1981) parameter for the nuclear disk in NGC 2207 and determined that the nuclear disk was not self-gravitating. We have applied a similar analysis to the galaxies in our sample after rewriting the expression for in the form:
where is the sound speed, is the azimuthally-averaged disk surface density in pc-2, and is the disk scale height in pc. This expression for assumes that the nuclear disks are in solid–body rotation, as is the case in NGC 2207 (Rubin & Ford 1983) and in the circumnuclear gas disks in galaxies with rapidly rotating cores in the Virgo Cluster (Rubin et al. 1997). We have estimated to be 10 km s-1, which is a reasonable value for the inner disks of spirals (e.g. Spitzer 1978; Elmegreen et al. 1998), although some authors report values of km s-1 for the main disks of spirals (e.g. Kennicutt 1989; van der Kruit & Shostak 1984). We are able to place an upper limit on by assuming that as the disks are thinner than the width of the spiral arms, as is true for spiral arms in galaxy disks proper. Most of our estimates of the arm widths are also upper limits, as at their narrowest points nearly all of the nuclear spiral arms are unresolved. Our estimates of , and are summarized in Table 3.
Values of would imply that the spiral arms are formed by gravitational instabilities in self-gravitating disks (e.g. Binney & Tremaine 1987), whereas values of would correspond to spiral arms formed in non-selfgravitating disks by hydrodynamic instabilities. The values we find for the spiral arms in our Seyfert galaxies range from (Table 3, column 4). We thus conclude, as did Elmegreen et al. (1998) for NGC 2207, that these nuclear spiral arms do not occur in self-gravitating gas disks. Since scales as the square of the sound speed, a lower value of could greatly reduce . As most of our estimates for are significantly above 1, would have to be quite small to change our results in the direction of self-gravitating values. Faster sound speeds, in contrast, would increase as . Our estimates of are rough values that could vary due to several competing effects. As mentioned above, we may be underestimating the column density in these dust lanes due to scattering and the effects of unresolved dust lanes. In contrast, by measuring from the maximum arm-interarm contrast, we may be overestimating the disk surface density. In addition, if the spiral arms are shock fronts they may correspond to density enhancements of up to a factor of 4 (for nonradiating, adiabatic shocks) or higher (for radiating shocks; e.g. Spitzer 1978) over the azimuthally-averaged disk surface density. In addition to the uncertainty in and , our estimate of the scale height is an upper limit as the spiral arms are generally unresolved. However, decreasing would increase and the upper limit on thus only strengthens the argument that these disks are not self-gravitating. The fact that many of these nuclear spirals are multi-arm spirals further supports the notion that they are unlikely to be due to gravitational instabilities in self-gravitating disks (Lin & Shu 1964).
Spiral arms can form in gaseous disks that are not self-gravitating through hydrodynamic shocks. One possibility is that these shocks could be caused by turbulent gas motions driven by the inflow of material from larger radii (Struck 1997). Englmaier & Shlosmann (1999) have also shown that shocks in non-selfgravitating, nuclear disks can form grand-design, two-arm spiral structure in galaxies with a large-scale stellar bar. Since the orbital speeds in the inner regions of galaxies are of order the sound speed, it is also possible that the arms are formed by acoustic shocks (Elmegreen et al. 1998; Montenegro, Yuan, & Elmegreen 1999). Shocks in these gaseous disks could be a viable means of removing angular momentum and energy from the gas and thus these nuclear spirals could be signposts of the fueling mechanisms for Seyfert galaxies. While investigations have traditionally looked for large-scale signatures of interaction or bars in the host galaxies, the actual funneling of gas the last few hundred parsecs into the central black hole may be mediated by the hydrodynamics of non-selfgravitating gas disks on small scales. This mechanism could be common, regardless of whether large-scale bars or interactions transported the gas from large radii to 100’s of parsec scales.
6 Summary and Conclusions
These -band images and color maps of the centers of a representative sample of 24 Seyfert 2 galaxies rule out the presence of nuclear bars in all but at most 5 of the 24 galaxies in our sample. While this is not to say that nuclear bars cannot play some role in fueling an AGN if present, they are found in only a minority of Seyferts. This strengthens and extends similar results found with a smaller sample of Seyferts by Regan & Mulchaey (1999). While this sample is composed of only Seyfert 2s, a study of all of the Seyfert 1s and 2s in the CfA Seyfert sample with HST WFPC2 imaging did not reveal an excess of bars among Seyfert 1s relative to Seyfert 2s (Pogge & Martini 2000). We note, however, that the circumnuclear environments of Seyfert 1s are more difficult to study given their strong nuclear PSFs and they have not been imaged in the near-infrared, which was needed to find 2 of the 5 possible bars in our sample.
Our color maps of the centers of these Seyfert galaxies have shown that 20 of 24 have nuclear spiral structure. Of the 4 that do not show nuclear spiral structure, 2 of these (NGC 4388 and NGC 5033) are nearly edge-on systems and thus the geometry is unfavorable for viewing any kind of nuclear spiral structure. The remaining two, Mrk 266SW and NGC 5929, are both in strongly interacting systems and have very chaotic dust morphologies, perhaps reflecting disordered delivery of host galaxy gas due to the tidal interaction. We have used the color maps to estimate the amount of material in these spiral arms and have found that the nuclear disks in which they reside contain enough gas to serve as a fuel reservoir for the AGN. The surface densities of these disks, along with our estimates of the disk scale height and surface density, also suggest that these disks are not self-gravitating. The nuclear spiral structure is therefore probably formed by shocks propagating in the disk, via either an acoustic mechanism or other hydrodynamic process, and these shocks could dissipate energy and angular momentum from the gas.
Our observations strongly rule out small-scale nuclear bars as the primary means of removing angular momentum from interstellar gas to fuel the AGN in our representative sample of Seyfert 2s. Instead, we find that the most common morphological features in the centers of AGN are nuclear spirals of dust. These spirals may be caused by shock waves in a disk or may be streamers of mass falling inwards from the innermost orbital resonance. The large fraction of Seyfert 2s with dusty nuclear spirals demonstrates the importance of shocks and gas dynamical effects in removing angular momentum from the gas and feeding this material into the nucleus and hence into the supermassive black hole.
An outstanding question posed by these nearly ubiquitous nuclear spirals is how their host nuclear disks formed. As proposed by Rubin et al. (1997) for nuclear disks in some Virgo Cluster galaxies, we conclude that two likely scenarios are the standard processes previously invoked for fueling AGN: bars and interactions. Both large-scale bars and interactions can remove angular momentum from gas and drive it into the inner 100’s of parsecs, where it settles into a nuclear disk. Shocks or other hydrodynamic effects in these disks then complement the action of bars and interactions by removing angular momentum from this accumulated material and feeding the fuel into the active nucleus.
Two future areas of work are suggested by our results. First, similar observations of a large sample of quiescent spiral galaxies should be obtained to determine if the nuclear spirals found in Seyferts are present in all spirals. This work should also be augmented by spectroscopic data to provide kinematic information on the gas and dust in the inner regions. Second, theoretical predictions of accretion rates from spiral structure in both self-gravitating and non-selfgravitating disks are needed. Answers to these questions are needed before we can understand the role played by dusty nuclear spirals in fueling AGN.
References
- (1) Adams, T.F. 1977, ApJS, 33, 19
- (2) Alonso-Herrero, A., Ward, M.J., & Kotilainen, J.K. 1996, MNRAS, 278, 902
- (3) Alonso-Herrero, A., Simpson, C., Ward, M.J., & Wilson, A.S. 1998, ApJ, 495, 196
- (4) Athanassoula, E. 1992, MNRAS, 259, 345
- (5) Bahcall, J.N., Kirhakos, S., & Schneider, D.P. 1995a, ApJ, 447, L1
- (6) Bahcall, J.N., Kirhakos, S., & Schneider, D.P. 1995b, ApJ, 450, 486
- (7) Bahcall, J.N., Kirhakos, S., Saxe, D.H., & Schneider, D.P. 1997, ApJ, 479, 642.
- (8) Barnes, J.E. & Hernquist, L.E. 1991, ApJ, 370, L65
- (9) Bekki, K. & Noguchi, M. 1994, A&A, 290, 7
- (10) Bekki, K. 1995, MNRAS, 276, 9
- (11) Berlind, A., Quillen, A.C., Pogge, R.W., & Sellgren, K. 1997, AJ, 114, 107
- (12) Bertin, G., Lin, C.C., Lowe, S.A., & Thurstans, R.P. 1989, ApJ, 338, 78
- (13) Biretta, J.A., et al. 1996, WFPC2 Instrument Handbook, Version 4.0 (Baltimore: STScI)
- (14) Bohlin, R.C., Savage, B.D., & Drake, J.F. 1978, ApJ, 224, 132
- (15) Bower, G.A., Wilson, A.S., Mulchaey, J.S., Miley, G.K., Heckman, T.M., & Krolik, J.H. 1994, AJ, 107, 1686
- (16) Buta, R. 1986a, ApJS, 61, 609
- (17) Buta, R. 1986a, ApJS, 61, 631
- (18) Capetti, A., Axon, D.J., Macchetto, F., Sparks, W.B., & Boksenberg, A. 1996, ApJ, 469, 554
- (19) Carollo, C.M., Stiavelli, M., & Mack, J. 1998, AJ, 116, 68
- (20) Dahari, O. 1984, AJ, 89, 966
- (21) DeRobertis, M.M., Hayhoe, K., & Yee, H.K.C. 1998, ApJ, 496, 93
- (22) de Vaucouleurs, G. 1975, ApJS, 29, 193
- (23) Elmegreen, B.G., Elmegreen, D.M., & Montenegro, L. 1992, ApJS, 79, 37
- (24) Elmegreen, B.G., Elmegreen, D.M., Brinks E., Yuan, C., Kaufman, M., Klarić, M., Montenegro, L., Struck, C., & Thomasson, M. 1998, ApJ, 503, L119
- (25) Englmaier, P. & Shlosman, I. 1999, ApJ, in press, astro-ph/9908256
- (26) Erwin, P & Sparke, L.S. 1998, in Galaxy Dynamics, Proceedings of a Conference Held at Rutgers University, 8 - 12 August 1998, ed. D.R. Merritt, M. Valluri, and J.A. Sellwood, ASP Conf. Ser.
- (27) Falcke, H., Wilson, A.S., & Simpson, C. 1998, ApJ, 502, 199
- (28) Friedli, D. & Benz, W. 1993, A&A, 268, 65
- (29) Fuentes-Williams, T. & Stocke, J. 1988, AJ, 96, 1235
- (30) Glass, I.S. & Moorwood, A.F.M. 1985, MNRAS, 214, 429
- (31) Glass, I.S. 1998, MNRAS, 297, 18
- (32) González-Delgado, R., Heckman, T., Leitherer, C., Meurer, G., Krolick, J., Wilson, A.S., Kinney, A.,& Koratkar, A. 1998, ApJ, 505, 174
- (33) Heckman, T., Krolick, J., Meurer, G., Calzetti, D., Kinney, A., Koratkar, A., Leitherer, C., Robert, C., & Wilson, A. 1995, ApJ, 452, 549
- (34) Heckman, T.M., González-Delgado, R., Leitherer, C., Meurer, G.R., Krolick, J., Wilson, A.S., Koratkar, A., & Kinney, A. 1997, ApJ, 482, 114
- (35) Hernquist, L.E. 1989, Nature, 240, 687
- (36) Hernquist, L.E. & Mihos, J.C. 1995, ApJ, 448, 41
- (37) Huchra, J. & Burg, R. 1992, ApJ, 393, 90
- (38) Huchra, J., Davis, M., Latham, D., & Tonry, J. 1983, ApJS, 52, 89
- (39) Hutchings, J.B. & Neff, S.G. 1988, AJ, 96, 1575
- (40) Hutchings, J.B. & Neff, S.G. 1992, AJ, 104, 1
- (41) Hutchings, J.B. & Neff, S.G. 1997, AJ, 113, 1514
- (42) Keel, W.C., Kennicutt Jr., R.C., van der Hulst, J.K., & Hummel, E. 1985, AJ, 90, 708
- (43) Keel, W.C. 1996, AJ, 111, 696
- (44) Kennicutt, R. 1989, ApJ, 334, 685
- (45) Kormendy, J. 1979, ApJ, 227, 714
- (46) Kotilainen, J.K., Ward, M.J., Boisson, C., DePoy, D.L., Smith, M.G., & Bryant, L.R. 1992, MNRAS, 256, 125
- (47) Kuchinski, L.E. & Terndrup, D.M. 1996, AJ, 111, 1073
- (48) Kuchinski, L.E., Terndrup, D.M., Gordon, K.D., & Witt, A.N. 1998, AJ, 115, 1438
- (49) Laine, S., Knapen, J.H., Pérez-Ramírez, D., Doyon, R., & Nadeau, D. 1999, MNRAS, 302, L33
- (50) Lin, C.C. & Shu, F.H. 1964, ApJ, 140, 646
- (51) McLeod, K.K. & Rieke, G.H. 1995, ApJ, 441, 96
- (52) MacKenty, J.W., Skinner, C., Calzetti, D., & Axon, D.J. 1997, NICMOS Instrument Handbook, Version 2.0, (Baltimore, STScI)
- (53) Maciejewski, W. & Sparke, L.S. 1997, ApJ, 484, L117
- (54) Maiolino, R. & Rieke, G.H. 1995, ApJ, 454, 95
- (55) Malkan, M.A., Gorjian, V. & Tam, R. 1998, ApJS, 117, 25
- (56) Mihos, J.C., Richstone, D.O., & Bothun, G.D. 1992, ApJ, 400, 153
- (57) Mihos, J.C. & Hernquist, L.E. 1995, ApJ, 425, L13
- (58) Mulchaey, J.S. & Regan, M.W. 1997, ApJ, 482, L135
- (59) Osterbrock, D.E. 1981, ApJ, 249, 462
- (60) Osterbrock, D.E. & Martel, A. 1993, ApJ, 414, 552
- (61) Peterson, B.M. 1997, An Introduction to Active Galactic Nuclei, (Cambridge University Press: Cambridge)
- (62) Piner, B.G., Stone, J.M., & Teuben, P.J. 1995, ApJ, 449, 508
- (63) Phillips, A.C., Illingworth, G.D., MacKenty, J.W., & Franx, M. 1996, AJ, 111, 1566
- (64) Pogge, R.W. & DeRobertis, M.M. 1993, ApJ, 404, 563
- (65) Pogge, R.W. 1996, in Emission Lines in Active Galaxies: New Methods and Techniques, ed. B.M. Peterson, F.-Z. Cheng, & A.S. Wilson, ASP Conf. Ser., 113, 378
- (66) Pogge, R.W. & Martini, P. 2000, AJ, in preparation
- (67) Pogge, R.W., Martini, P., & An, J.H., BAAS, 193, 0604
- (68) Quillen, A.C., Frogel, J.A., Kenney, J.D.P., Pogge, R.W., & DePoy, D.L. 1995, ApJ, 441, 549
- (69) Quillen, A.C., Alonso-Herrero, A., Rieke, M.J., McDonald, C., Falcke, H., & Rieke, G.H. 1999, ApJ, in press, astro-ph/9902233
- (70) Regan, M.W., Vogel, S.N., & Teuben, P.J. 1997, ApJ, 482, L143
- (71) Regan, M.W. & Mulchaey, J.S. 1999, AJ, 117, 2676
- (72) Rubin, V.C. & Ford Jr., W.K. 1983, ApJ, 271, 556
- (73) Rubin, V.C., Kenney, J.D.P., & Young, J.S. 1997, AJ, 113, 1250
- (74) Sandage, A. & Tammann, G.A. 1987, A Revised Shapley-Ames Catalogue of Bright Galaxies (Washington: Carnegie Institution of Washington)
- (75) Shaw, M., Axon, D., Probst, R., & Gatley, I. 1995, MNRAS, 274, 369
- (76) Shlosman, I., Frank, J., & Begelman, M.C. 1989, Nature, 338, 45
- (77) Shlosman, I., Begelman, M.C., & Frank, J. 1990, Nature, 345, 679
- (78) Schwartz, M. 1981, ApJ, 247, 77
- (79) Simpson, C., Wilson, A.S., Bower, G., Heckman, T.M., Krolik, J.H., & Miley, G.K. 1997, ApJ, 474, 121
- (80) Spitzer Jr., L. 1978, Physical Processes in the Interstellar Medium (John Wiley & Sons: New York)
- (81) Stephens, A.W., Frogel, J.A., et al. 2000, AJ, submitted, astro-ph/9909001
- (82) Struck, C. 1997, ApJS, 113, 269
- (83) Toomre, A. & Toomre, J. 1972, ApJ, 178, 623
- (84) Toomre, A. 1981, in The Evolution of Galaxies and Stellar Populations, ed. S.M. Fall & D. Lynden-Bell, (Cambridge University Press: Cambridge) p. 111
- (85) van der Kruit, P.C. & Shostak, G.S. 1984, A&A, 134, 258
- (86) White, R.E. & Keel, W.C. 1992, Nature, 359, 129
- (87) White, R.E., Keel, W.C., & Conselice, C.J. 1996, Nature, astro-ph/9608113
- (88) Witt, A.N., Thronson Jr., H.A., & Capuano Jr., J.M. 1992, ApJ, 393, 611
| Name | Alternate | Seyfert Type | Morphological Type | Note | WFPC2 Filter | Distance | pc/′′ |
|---|---|---|---|---|---|---|---|
| Mrk 334 | 1.8 | Pec | Disturbed | F606W | 91.5 | 444 | |
| Mrk 471 | 1.8 | SBa | F606W | 136.9 | 664 | ||
| Mrk 744 | NGC 3786 | 1.8 | SAB(rs)a pec | Interacting | F606W | 36.1 | 175 |
| UGC 12138 | 2237+07 | 1.8 | SBa | F606W | 102.8 | 498 | |
| NGC 5033 | 1.9 | SA(s)c | Edge On | F547M | 12.1 | 59 | |
| NGC 5252 | 1.9 | SO | F606W | 90.7 | 440 | ||
| NGC 5273 | 1.9 | SA(s)00 | F547M | 14.9 | 72 | ||
| NGC 5674 | 1.9 | SABc | F606W | 98.1 | 476 | ||
| UM 146 | 0152+06 | 1.9 | SA(rs)b | F606W | 71.6 | 347 | |
| Mrk 461 | 2 | none | 65.6 | 318 | |||
| Mrk 266 | NGC5256 | 2 | Comp Pec | F606W | 111.0 | 538 | |
| Mrk 270 | NGC5283 | 2 | SO? | F606W | 38.2 | 185 | |
| Mrk 573 | 2 | (R)SAB(rs)O+: | F606W | 71.0 | 344 | ||
| NGC 1068 | 2 | F606W | 16.2 | 79 | |||
| NGC 1144 | 2 | RingB | F606W | 116.5 | 565 | ||
| NGC 3362 | 2 | SABc | F606W | 108.8 | 527 | ||
| NGC 3982 | 2 | SAB(r)b: | F606W | 17.1 | 83 | ||
| NGC 4388 | 2 | SA(s)b: sp | Edge On | none | 32.2 | 156 | |
| NGC 5347 | 2 | (R’)SB(rs)ab | F606W | 31.4 | 152 | ||
| NGC 5695 | Mrk 686 | 2 | SBb | F606W | 56.9 | 276 | |
| NGC 5929 | 2 | Sab: pec | Interacting | F606W | 34.9 | 169 | |
| NGC 7674 | Mrk 533 | 2 | SA(r)bc pec | F606W | 118.5 | 575 | |
| NGC 7682 | 2 | SB(r)ab | F606W | 70.8 | 343 | ||
| UGC 6100 | A1058+45 | 2 | Sa? | F606W | 117.6 | 570 |
Note. — Properties of the galaxies observed with the NICMOS Camera 1. Columns 1 & 2 list the most common names for the targets, and column 3 lists its Seyfert type as defined by Osterbrock & Martel (1993). In column 4 we have compiled the morphological type for the host galaxy from NED, while in column 5 we have provided additional morphological information. Column 6 lists the visible-band filter of the archival image used in the color map. Column 7 lists the distance of the galaxy in Mpc (assuming km s-1 Mpc-1) and column 8 gives the projected size in pc of at the distance of the galaxy.
| Name | Bar Type | Nuclear Morphology |
|---|---|---|
| Mrk 334 | None | Nuclear Spiral |
| Mrk 471 | Nuclear | Nuclear Spiral |
| Mrk 744 | Host | Nuclear Spiral |
| UGC 12138 | Host | Nuclear Spiral |
| NGC 5033 | None | Edge On |
| NGC 5252 | None | Nuclear Spiral |
| NGC 5273 | None | Nuclear Spiral |
| NGC 5674 | Both | Nuclear Spiral |
| UM 146 | None | Nuclear Spiral |
| Mrk 461 | None | No Visible |
| Mrk 266 | None | Irregular |
| Mrk 270 | Nuclear | Nuclear Spiral |
| Mrk 573 | Both | Nuclear Spiral |
| NGC 1068 | Host | Nuclear Spiral |
| NGC 1144 | Ring | Nuclear Spiral |
| NGC 3362 | Host | Nuclear Spiral |
| NGC 3982 | Host | Nuclear Spiral |
| NGC 4388 | None | Edge On |
| NGC 5347 | Host | Nuclear Spiral |
| NGC 5695 | Host | Nuclear Spiral |
| NGC 5929 | Nuclear | Nuclear Spiral |
| NGC 7674 | None | Nuclear Spiral |
| NGC 7682 | Host | Nuclear Spiral |
| UGC 6100 | None | Nuclear Spiral |
Note. — This table lists the nuclear properties of the galaxies in the sample based upon our classification of the color maps. Column 1 lists the name of the galaxy as in Table 1, while column 2 lists whether a host galaxy and/or nuclear bar is present. Column 3 lists our morphological classification for the galaxy based upon the dust structure shown in our color maps.
| Name | ( pc-2) | (pc) | |
|---|---|---|---|
| Mrk 334 | 20 | 141 | 5 |
| Mrk 471 | 16 | 60 | 15 |
| Mrk 744 | 19 | 16 | 48 |
| UGC 12138 | 14 | 113 | 10 |
| NGC 5252 | 9 | 40 | 41 |
| NGC 5273 | 17 | 7 | 130 |
| NGC 5674 | 15 | 87 | 11 |
| UM 146 | 18 | 32 | 26 |
| Mrk 270 | 6 | 17 | 137 |
| Mrk 573 | 9 | 63 | 26 |
| NGC 1144 | 15 | 51 | 19 |
| NGC 3362 | 9 | 48 | 34 |
| NGC 3982 | 9 | 8 | 215 |
| NGC 5347 | 18 | 42 | 20 |
| NGC 5695 | 14 | 25 | 43 |
| NGC 7674 | 12 | 105 | 12 |
| NGC 7682 | 9 | 31 | 52 |
| UGC 6100 | 12 | 52 | 24 |
Note. — The nuclear disk parameters for all galaxies showing nuclear spiral structure. Column 1 contains the name of the galaxy, as listed in tables 1 and 2. Column 2 has our estimate of the mass surface density based on the color, which is a lower limit. Column 3 is an upper limit to the scale height of the disk based on measuring the width of the spiral arms. Both of these quantities have been derived assuming the distance listed in Table 1. Column 4 lists the value for the Toomre parameter we derived for each disk as discussed in section 6.