Spatially Resolved Hopkins Ultraviolet Telescope Spectra of NGC 1068
Abstract
We present spatially resolved far-ultraviolet spectra (912–1840 Å) of NGC 1068 obtained using the Hopkins Ultraviolet Telescope (HUT) during the March 1995 Astro-2 mission. Three spectra of this prototypical Seyfert 2 galaxy were obtained through a 12″ diameter aperture centered on different locations near the nucleus. The first pointing (A1) was centered west of the optical nucleus; the nucleus was on the eastern edge of the aperture. The second (A2) was centered southwest of the optical nucleus with the nucleus well inside the aperture. The third (B) was centered on the ionization cone, with the nucleus on the southwestern edge of the aperture. While all three aperture locations have spectra similar to the Astro-1 observations of Kriss et al., these new spatially resolved observations localize the source of the far-UV line and continuum emission.
The ionization cone (location B) has both brighter emission lines and continuum than the nuclear region (location A2). Position A1 is fainter than either A2 or B in both lines and continuum. The far-UV emission lines observed with HUT have a spatial distribution that most closely resembles that of [O III] 5007, but appear to be more extended and offset to the northeast along the axis of the radio jet. This supports the previous conclusion of Kriss et al. that the bright C iii and N iii arises in shock-heated gas.
The UV continuum radiation has a more extended spatial distribution than the line-emitting gas. At wavelengths longward of 1200 Å the inferred continuum distribution is consistent with that seen in archival Hubble Space Telescope WFPC2 images through filter F218W, and it appears to contain a substantial contribution from starlight. At wavelengths shorter than 1200 Å, the UV continuum becomes more concentrated in a region matching the location and shape of the UV line radiation, consistent with nuclear flux scattered by a combination of the electron scattering mirror and the NE dust cloud.
Subject headings:
galaxies: active — galaxies: individual (NGC 1068) — galaxies: nuclei — galaxies: Seyfert — ultraviolet: galaxies1. Introduction
The proximity, brightness, and rich phenomenology of NGC 1068 have made it a key source for our current understanding of the structure and physics of active galactic nuclei (AGN). The bright, narrow, high-excitation emission lines of NGC 1068 define it as the prototype of the Seyfert 2 class. In polarized light, however, it shows the blue continuum and broad permitted emission lines typical of Seyfert 1s (Antonucci & Miller (1985); Miller et al. (1991); Code et al. (1993); Antonucci, Hurt, & Miller (1994)). These characteristics inspired the “unified model” of AGN in which the different types of Seyfert galaxy result from a combination of orientation, obscuration, and reflection of light from the continuum source and the broad-line region (BLR). (See the review by Antonucci (1993).) For Seyfert 2 galaxies, the observer’s line of sight lies near the plane of an opaque torus that blocks a direct view of the continuum source and the BLR. Electrons in clouds of hot gas and dust in cooler clouds above and below the plane of the torus reflect radiation from central regions into the observer’s line of sight. For Seyfert 1 galaxies, the observer’s line of sight lies well above the plane of the torus, resulting in an unobstructed view of the interior.
The obscuring torus not only blocks radiation from reaching an observer, but it also shadows gas in the surrounding regions of the galaxy. This anisotropic illumination can produce conical emission-line regions frequently referred to as “ionization cones” (Pogge (1989); Tsvetanov (1989); Evans et al. (1991), 1993, 1994). This standard interpretation presumes that photoionization by radiation from the central source is the primary energy input into the narrow-line region (NLR). The observed line ratios corroborate this interpretation when compared to photoionization models (e.g., Ferland & Osterbrock (1986); Veilleux & Osterbrock (1987); Binette, Courvoisier, & Robinson (1988)). However, in addition to radiation, kinetic energy in the form of outflowing winds and radio jets may also play a significant role in transferring energy from the nuclear region into the surrounding galaxy along the axis of the torus. The principal reflecting region for Seyfert 2s is most likely a wind of hot ( K) electrons driven off the torus by X-rays from the central source (Krolik & Begelman (1986); Krolik & Lepp (1989)). Radio jets in Seyferts are also preferentially aligned with the axis of the ionization cones (Wilson & Tsvetanov (1994)). Kinetic energy from these sources may be a significant input to the energy budget of the NLR. A number of authors have suggested that shocks from such interactions may power a large fraction of the line emission. Morse, Raymond, & Wilson (1996) review the status of shocks for ionizing gas in the NLR. In cases like the bow shock models of Wilson & Ulvestad (1987) and Taylor, Dyson, & Axon (1992), shocks compress the gas and enhance its radiative output, but nuclear radiation drives the ionization. In the “autoionizing shock” models of Sutherland, Bicknell, & Dopita (1993) and Dopita & Sutherland (1995), ionizing photons generated in the primary shocks themselves photoionize the surrounding gas.
A key observational feature of the autoionizing shock models is the strength of collisionally excited far-UV emission lines. Lines such as O vi , C iii , and N iii have high excitation temperatures and are thus prime coolants in the high temperature regions of fast shocks. These lines are particularly strong in NGC 1068 as seen in HUT observations during the Astro-1 mission (Kriss et al. 1992), and the temperature-sensitive ratios I(C iii] )/I(C iii ) and I(N iii] )/I(N iii ) implied temperatures exceeding 50,000 K— temperatures far higher than those characteristic of thermally stable photoionized gas. However, Ferguson, Ferland, & Pradhan (1995) argued that strong C iii and N iii could arise from fluorescence in photoionized gas if turbulent velocities exceeded 1000 .
Radio structures in NGC 1068 show a strong spatial correlation with the emission line gas at visible wavelengths, e.g. [O iii] (Wilson & Ulvestad (1987); Evans et al. (1991); Gallimore et al. (1996); Capetti, Axon, & Macchetto (1997)), and in the near-infrared, e.g., [Fe ii] 1.6435 m (Blietz et al. (1994)). The Astro-1 HUT spectra of NGC 1068 lacked spatial resolution on scales smaller than the and circular apertures used for the observations. Neff et al. (1994) presented far-UV images with ″ resolution obtained with the Ultraviolet Imaging Telescope (UIT) on the Astro-1 mission, but this broad band (1250–2000 Å) image did not separate line and continuum emission. To obtain information on the spatial distribution of the far-UV emission lines and continuum flux, we carried out the observations described in this paper during the Astro-2 mission. We compare our spatially resolved spectra to the far-UV UIT images and to emission line and continuum images at longer wavelengths obtained with HST (Dressel et al. (1997)). We find that the far-UV emission lines observed with HUT are more extended than the [O iii] emission observed with HST, and that it is offset to the northeast along the direction of the radio jet. At wavelengths greater than 1200 Å, the UV continuum has a greater spatial extent than the emission lines. At shorter wavelengths, it becomes more spatially concentrated.
In sections 2 and 3 we describe the HUT Astro-2 observations and our data reduction process. We then discuss in §4 the spatial information that can be gleaned from the HUT observations. In §5 we compare the HUT observations to the UIT and HST images. We discuss the implications of our observations for the excitation of the line emission in NGC 1068 and for the origin of the ultraviolet continuum in §6. We summarize our conclusions in §7.
2. HUT Observations
During the course of the 16-day Astro-2 space shuttle mission in 1995 March we used HUT to obtain one-dimensional spectra through a 12″ aperture at three distinct spatial locations in the nuclear region of NGC 1068. HUT uses a 0.9-m primary mirror in conjunction with a prime-focus, Rowland-circle spectrograph to obtain spectra with a resolution of 3 Å spanning the 820–1840 Å band. The primary mirror and the concave grating are both coated with SiC to provide high UV reflectivity at wavelengths shortward of 1200 Å. Light dispersed by the prime-focus grating is focussed onto a photon-counting detector consisting of a micro-channel-plate intensifier with a CsI photocathode and a phosphor-screen anode. A 1024-diode linear Reticon array is used to detect the intensified pulses on the anode. Events are centroided to a half-diode precision, producing a 2048-pixel, one-dimensional spectrogram. Davidsen et al. (1992) provide a detailed description of HUT. Improvements made to HUT for the Astro-2 mission and HUT’s in-flight performance are described by Kruk et al. (1995).
| Observation | UT Date | UT Start | Integration Time | Comments |
|---|---|---|---|---|
| (s) | ||||
| A1d | 5 March 1995 | 02:43:28 | 716 | Day |
| A1n | 5 March 1995 | 02:55:29 | 290 | Night |
| A2 | 5 March 1995 | 03:00:32 | 660 | Night |
| Bd | 7 March 1995 | 15:47:53 | 496 | Day |
| Bn | 7 March 1995 | 15:56:14 | 888 | Night |
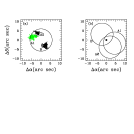
The HUT guidance system relies on a slit-viewing video camera and guide stars. Using this information HUT is manually pointed by a payload specialist aboard the space shuttle. Video frames taken during the observation enable later reconstruction of HUT’s pointing during the observation. Positions of guide stars in the video frames can be centroided to an accuracy of (about 0.5 pixels). The aperture position in the field of view also changes slightly between observations as the slit wheel rotates. Its position can be measured to an accuracy of by measuring the apparent hole it leaves in images with a bright background, such as those obtained near the earth limb in orbital daylight. In Figure 1 we show the pointing errors derived from the video images during our observations of NGC 1068. These errors give the location of the optical nucleus relative to the center of the HUT aperture.
Three dominant groupings of pointing errors are apparent in Figure 1, and we use these as the basis for the three separate spectra we discuss here. During the course of the first observation (A), the payload specialist moved the aperture southwest to place the optical nucleus definitely within the slit. As this was a fairly substantial pointing correction, we have split this observation into two separate pieces. During A1 the optical nucleus is on the very edge of the slit and in A2 the optical nucleus is well within the slit. The second observation (B) occurred one day later. The ionization cone was centered within the aperture while the optical nucleus was near the southwest edge of the aperture.
3. HUT Data
Due to the differences between night and day airglow we separated the night and day portions of observations A1 and B for independent processing. All of observation A2 occurred during orbital night. These data groupings are summarized in Table 1. We reduced the data using the standard procedures described by Kruk et al. (1995; 1999). We determined background from regions free of airglow at wavelengths shortward of the 912 Å Lyman limit. With the exception of the extremely strong geocoronal Ly line at 1216 Å we fitted the airglow lines with symmetric Gaussians and then subtracted the fitted profiles. Fitting the geocoronal Ly line is more difficult due to its broad scattering wings. Thus we constructed Ly templates from blank field observations taken during the Astro-2 mission. We then subtracted the appropriately scaled Ly profile, including its broad scattering wings, from each spectrum. We flux calibrated the background-subtracted spectra by applying a time-dependent inverse-sensitivity curve derived from HUT observations and atmospheric models of white dwarfs (Kruk et al. (1995); Kruk et al. (1999)). A minor correction for second-order light in the 1824-1840 Å range was made based on the measured intensity of the 912–920 Å region. The errors for the raw count spectra were calculated by assuming a Poisson distribution. These errors were propagated through the reduction process. Figure 2 shows our final calibrated spectra for each of the HUT aperture locations.

We use the IRAF111 The Image Reduction and Analysis Facility (IRAF) is distributed by the National Optical Astronomy Observatories, which is operated by the Association of Universities for Research in Astronomy,Inc. (AURA), under cooperative agreement with the National Science Foundation. task specfit (Kriss (1994)) to fit the continuum and emission lines in our spectra. For the continuum we assume a power law shape of the form modified by the extinction curve of Cardelli, Clayton, & Mathis (1989). Keeping fixed at 3.1, we found = 0.02 provides the best fit for all three spectra. The best fit power law normalization and spectral indices are listed in Table 2. Our best fit extinction is in rough agreement with those used in previous ultraviolet studies of NGC 1068 (Kriss et al. (1992), Snijders et al. (1986), and Ferguson et al. (1995)). Fortunately, due to the comparative nature of our study, our results are insensitive to uncertainties in the extinction.
Table 2
Continuum Parameters for the HUT Spectra of NGC 1068a
Observation
A1
4.939
0.240
A2
5.834
0.294
B
8.070
0.415
aThe parameters
describe a power law
with in units of ,
assuming an extinction correction of = 0.02.
To measure the emission lines, we fit symmetric Gaussians to the spectral features of NGC 1068. In our fits we have not included the wavelength region from 1200-1217 Å due to contamination from the Ly geocoronal line. However NGC 1068’s intrinsic Ly emission line was sufficiently bright and redshifted to disentangle it from geocoronal emission. We detected and fit broad components to the Ly and C IV emission lines as described by Kriss et al. (1992). In our fits we linked the widths of the Ly and C IV broad line components so that they were identical. We also linked the widths and redshifts of the blended Ly and O VI lines.
Tables 3–5 give the best fit fluxes, velocities, and full-width at half-maximum (FWHM) for the emission lines in observations A1, A2, and B. The fluxes are as observed, with no correction for extinction. The velocities are relative to a systemic redshift of (Huchra et al. (1992)). The quoted error bars are the formal uncertainties derived from the error matrix of our fit. We caution that errors for observation A1 could be underestimated due to a high percentage of day airglow contamination and relatively large pointing deviations for this observation. Our flux measurements and Gaussian widths are consistent with earlier data from Astro-1 (Kriss et al. (1992)) and IUE (Snijders et al. (1986)). The widths of our Ly and C IV broad lines are in excellent agreement with the H width measured by Miller et al. (1991; FWHM=3030 ). As in the earlier observations by Kriss et al. (1992), we were unable to detect the O III] lines in any of our observations.
| Flux | aaVelocities are relative to a systemic redshift of (Huchra et al. (1992)). | FWHM | ||
|---|---|---|---|---|
| Line | ||||
| C III | 977.03 | |||
| N III | 991.00 | |||
| Ly | 1025.72 | |||
| O VI | 1031.93 | |||
| O VI | 1037.62 | |||
| He II | 1085.15 | |||
| Ly n | 1215.67 | |||
| Ly b | 1215.67 | |||
| N V | 1240.15 | |||
| C II | 1334.53 | |||
| Si IV+O IV] | 1400.00 | |||
| N IV] | 1486.50 | |||
| C IV n | 1549.05 | |||
| C IV b | 1549.05 | |||
| He II | 1640.50 | |||
| O III] | 1664.00 | |||
| N III] | 1750.00 |
4. Intercomparison of the HUT Observations
Aperture location B, centered on the ionization cone, shows both brighter far-UV line and continuum emission than either of the other two aperture locations. This is readily seen in Figure 3, which compares the short wavelength portions of the HUT spectra. To make a more quantitative comparison, we calculated emission line and continuum flux ratios using the data from location B as a fiducial reference. Figures 4 and 5 show the relative emission line and continuum fluxes, respectively.
We can use the relative intensities seen at the various aperture locations to infer the location and extent of the far-UV line and continuum emission in NGC 1068. For this analysis we also use the Astro-1 data from Kriss et al. (1992). Since these data were obtained through even larger apertures ( and diameters), they provide an overall normalization for the total flux. (We assume that the fluxes have not varied since our 1990 Astro-1 observations.) Qualitatively, it is helpful to first consider how one would expect the ratios to be behave in some simple, limiting cases. Referring to the relative aperture locations illustrated in Figure 1, one can see that a point source at the location of the optical nucleus would show roughly the same intensity at all three aperture locations. If one offset a point source to the northeast, toward the center of aperture B, its intensity in aperture B would brighten slightly as vignetting due to the aperture edge decreased. Conversely, its intensity as seen through aperture locations A1 and A2 would decrease drastically as the source moved beyond the edge of the aperture. Comparisons to the observed Astro-1 intensities mainly constrain the extent of the emission source. In the limit of a large, uniformly bright extended source, the intensities seen through apertures A1, A2, and B would all be comparable, but they would be fainter than that seen in the Astro-1 observation by the ratio of the angular areas, . For sources with angular extents smaller than the aperture sizes, the ratio relative to Astro-1 would gradually approach unity, depending on how close the center of emission was to the aperture edge.
As one can see in Figure 4 and Table 6, the ratios of the line fluxes among the observations is remarkably uniform. We find error-weighted averages for the emission line flux ratios to be and . Within this range none of the measured flux ratios differ appreciably (Fig. 4). The far-UV line emission distribution appears largely independent of species or degree of ionization. In particular, high-excitation-temperature lines like C III , N III , and O VI appear to have comparable spatial distributions, and their relative brightness seen through aperture B suggests that most of this emission originates from a region northeast of the optical nucleus, closer to the center of aperture B.
Fig. 3.— Comparison of the three HUT spectra in the 950–1100 Å range. The spectra have been smoothed with a box-car filter of width 5 pixels, but they have have not been renormalized or scaled. The high intensity of the B spectrum, where the aperture was centered on the ionization cone, relative to A1 and A2, where the ionization cone was largely outside the aperture, is apparent. Note also the greater relative brightness of the emission lines in aperture B compared to the continuum.
| Line | A1/B | A2/B | B/Astro-1 | |
|---|---|---|---|---|
| (Å) | ||||
| C III | 977.03 | 0.280.05 | 0.470.06 | 0.880.17 |
| N III | 991.00 | 0.200.05 | 0.730.10 | 1.130.31 |
| Ly | 1025.72 | 0.540.12 | 0.660.09 | 0.430.09 |
| O VI | 1031.93 | 0.290.03 | 0.640.05 | 0.660.09 |
| O VI | 1037.62 | 0.410.04 | 0.680.05 | 0.600.07 |
| He II | 1085.15 | 0.530.09 | 0.630.11 | 0.920.26 |
| Ly narrow | 1215.67 | 0.250.05 | 0.470.10 | 0.450.03 |
| Ly broad | 1215.67 | 0.290.10 | 0.980.10 | 1.590.35 |
| N V | 1240.15 | 0.430.02 | 0.670.03 | 0.850.05 |
| C II | 1334.53 | 0.260.10 | 0.710.13 | 0.740.18 |
| Si IV+O IV] | 1400 | 0.320.05 | 0.590.06 | 0.900.14 |
| N IV] | 1486.50 | 0.610.10 | 0.760.13 | 0.650.15 |
| C IV narrow | 1549.05 | 0.410.08 | 0.630.06 | 0.620.06 |
| C IV broad | 1549.05 | 0.380.08 | 0.640.07 | 1.230.25 |
| He II | 1640.50 | 0.460.03 | 0.700.04 | 0.810.07 |
| N III] | 1750.00 | 0.650.17 | 0.840.24 | 0.470.14 |
The intensity ratios of the narrow to broad components for the Ly and C IV emission lines show little variance among the three observations or between the Ly and C IV lines themselves (Table 7). A weighted average of the three pointings and both the Ly and C IV emission lines yields . In contrast, previous observations by Kriss et al. (1992) through an 18″ aperture found a more dominant contribution from the narrow lines: and . This is likely due to the smaller aperture used in the Astro-2 observations. These new observations include less of the extended narrow line region. Also, in Kriss et al. (1992) the Ly and C IV narrow-to-broad line ratios are very different, not uniform as in our observations. A possible explanation could be that the C IV narrow-line region is less extended than the Ly narrow-line region.
Fig. 4.— Flux ratios of selected HUT emission lines are shown for aperture location A1 relative to B (A1/B) and A2 relative to B (A2/B). The dotted lines are the weighted mean ratios for A1/B and for A2/B.
Fig. 5.— HUT continuum flux ratios are shown for aperture locations A1 and A2 relative to B.
Table 7
Intensity Ratios of Narrow to Broad Lines
Observation
Line
A1
A2
B
Ly
C IV
| Wavelength Region | Number of | A1/B | A2/B |
|---|---|---|---|
| Å | Data Points | ||
| 925– 970 | 89 | 0.5130.020 | 0.6810.027 |
| 1004–1020 | 40 | 0.5380.020 | 0.7010.025 |
| 1100–1200 | 194 | 0.6360.011 | 0.7530.014 |
| 1422–1469 | 92 | 0.6870.017 | 0.7530.019 |
| 1674–1842 | 327 | 0.7000.014 | 0.7760.017 |
| Wavelength Region | aaOffset in Right Ascension relative to NGC 1068’s optical nucleus. | bbOffset in Declination relative to NGC 1068’s optical nucleus. | FWHM | |
|---|---|---|---|---|
| (arc sec) | (arc sec) | (arc sec) | ||
| Emission lines | 5.50.7 | 0.12 | ||
| 925–970 Å | 5.50.6 | 0.55 | ||
| 1004–1020 Å | 6.00.4 | 0.08 | ||
| 1100–1200 Å | 7.50.5 | 0.08 | ||
| 1422–1469 Å | 9.00.5 | 0.04 | ||
| 1674–1842 Å | 7.50.4 | 0.22 |
In contrast to the emission lines, Figure 5 and Table 8 show that the far-UV continuum has a very different distribution from that of the far-UV emission lines. The continuum is concentrated in location B, but not nearly as strongly as the emission lines. Also, unlike the emission lines, the continuum ratios are wavelength dependent. The continuum appears to have a broader spatial distribution covering all three aperture locations at wavelengths longward of 1200 Å. The continuum flux becomes increasingly concentrated in the ionization cone region at wavelengths shortward of 1200 Å.
To quantify these inferences, we fit a simple model of the line and continuum flux surface brightness distributions to the relative intensities as seen at the different aperture locations. The total flux from Astro-1 and the three Astro-2 measurements provide us with four data points. If we model the emission with a Gaussian surface brightness distribution, we have four free parameters that are exactly constrained by our data— total intensity, location (two coordinates), and the full-width at half maximum (FWHM). We determine the parameters by using a fit to a series of Gaussian images with the FWHM incremented in steps of . At each step we vary the location freely and measure the total fluxes inside circular apertures in diameter whose centers were fixed at the relative locations determined by the HUT pointing errors shown in Figure 1.
Table 9 gives the best-fit locations relative to the optical nucleus and the sizes for the emission line and continuum flux emitting regions. The near-zero values of in our fits result from the zero degrees of freedom— four data points precisely determine four free parameters. Using statistics gives the added value of permitting us to determine error bars for our results. The quoted error bars are (assuming relative to ). These errors are appropriate for internal comparisons of relative locations and sizes; however, they do not include the systematic errors of in determining the location of the optical nucleus in the HUT acquisition video frames.
The results of the fits roughly correspond to our qualitative conclusions. Since the point-spread function (PSF) of HUT is (Davidsen et al. (1992)), we see that the emission line region, with FWHM=, is slightly resolved. In contrast, the far-UV continuum comes from an extended region spanning many arc seconds. At wavelengths longer than 1200 Å, the center of the emission is consistent with that of the optical nucleus. At shorter wavelengths, the peak of the emission shifts in the direction of the emission line region, and its size becomes comparable to that of the emission line region.
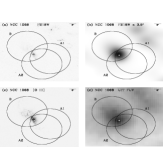
The relative offsets of the different regions are a bit more puzzling. We see that the center of the emission line region lies east of the long wavelength UV continuum, in the direction of the center of aperture B and the ionization cone. The puzzling aspect is the offset to the south. Given the geometry of the ionization cone, we would have expected a slight shift to the north. The puzzle is most likely explained by a more detailed consideration of the actual morphology. As one can see in Fig. 6, the northern edge of aperture A1 lies near the starburst knots visible in the HST and UIT images. Some flux from these knots falls in the aperture due to the broad PSF and pointing jitter. This contributes to the large size inferred for the continuum regions at wavelengths longward of 1200 Å, and also shifts the fitted centroid to the north. This conclusion is made clearer through a detailed comparison to the HST images that we discuss in the next section.
5. Comparison to HST and UIT Images
To reference the coarse spatial resolution of our far-UV 1-D aperture spectra to higher resolution, longer wavelength images, we use archival HST WFPC2 images of NGC 1068 obtained by H. Ford, as reduced and analyzed by Dressel et al. (1997). We also compare our results to the far-UV image obtained by Neff et al. (1994) using UIT on the Astro-1 mission. Table 10 summarizes nine images covering a range of emission lines and continuum bands from the far-UV to the visible.
To compare the HUT spectra to the HST and UIT images, the images must be registered on a common coordinate system, convolved to the HUT spatial resolution, and integrated over the spectrograph entrance aperture. We start with the F218W ultraviolet continuum image as this overlaps the long wavelength end of the HUT bandpass and is devoid of strong emission lines. As noted in the last section, the HUT PSF has FWHM. To obtain a more precise estimate specifically for the NGC 1068 observations that also takes into account the pointing jitter, we convolved the F218W image with a series of Gaussians, incrementing the FWHM in steps of . As in our fits in the last section, we measured total fluxes inside circular apertures in diameter corresponding to the HUT aperture locations. By comparing the intensity ratios at the three locations measured in the convolved HST image to those in the HUT spectra in the 1674–1842 Å continuum region, we are able to determine the best fit registration for the HUT apertures on the HST images as well as the best matching PSF. The best-fit Gaussian has FWHM=. The registration places the peak of the UV emission in the F218W image at a position relative to the optical nucleus as determined from the HUT video frames of , . Note that this reverses the situation encountered in the last section, where the fit to the HUT data alone placed the centroid of the 1800 Å continuum flux north of the optical nucleus. Figure 6 shows the HUT aperture locations determined in this process superimposed on the F218W image of NGC 1068 . By examining Fig. 6b, where the HST image is convolved with the HUT PSF, one can see that the starburst knots northwest of the nuclear region contribute a significant amount of flux to aperture A1. This is the likely explanation for the width inferred from the simple Gaussian fit in the last section as well as the bias to the north for the centroid of that fit.
Table 10
UIT and HST/WFPC2a Images of NGC 1068
Name
Notes
Exposure Time
()
UIT/B1
1250–2000 Å
1629
WFPC2/F218W
continuum
1200
WFPC2/F336W
continuum
450
WFPC2/F343N
[Ne V]
900
WFPC2/F375N
[O II]
900
WFPC2/F502N
[O III]
450
WFPC2/F547M
continuum
220
WFPC2/F656N
450
WFPC2/F791W
continuum
220
aHST/WFPC2 images courtesy of Zlatan Tsvetanov.
The flux distribution of the F218W image also provides a good fit to the 1450 Å region flux in the HUT data. With a FWHM of , we obtain . The F218W spatial distribution, however, gives a significantly worse fit to the short wavelength fluxes in the 1004–1020 Å band. Here we obtain for a best-fit FWHM of . This is consistent with the results of our simpler, single Gaussian model that showed the short-wavelength radiation arising in a more compact region— the flux distribution in the F218W image has a greater spatial extent than is seen through the HUT apertures at 1000 Å. The F218W spatial distribution is a very poor match to the emission-line flux distribution— for the best fit. This rules out any substantial contribution of the northwest starburst knots to the far-UV line emission seen with HUT.
If we do a fit to optimize the registration and resolution of the [O III] image, we obtain for FWHM= arc sec and an offset relative to the position of the F218W image of , . Panel (c) of Figure 6 shows the HUT aperture locations superimposed on the [O III] image of NGC 1068 . These results imply the UV line emission has a broader spatial distribution than that of the [O III] emission, and it is offset to the northeast.
The UIT image is described by Neff et al. (1994). We obtained the six images made using the far-UV detector through the B1 Sr filter from the National Space Sciences Data Center (NSSDC). These images had exposure times ranging from 22 s to 752 s, with the shortest images providing unsaturated exposures of the brightest portions of the nuclear region. We registered and stacked these images to produce the image shown in the lower right, Fig. 6d. Comparing the UIT image to the convolved HST F218W image, one sees that while similar, the UIT image has distinctly brighter emission to the NE of the nucleus in the ionization-cone region. This is likely due to the fact that the UIT image includes bright line emission in its bandpass from Si iv, C iv, He ii, and C iii]. The enhanced emission to the NE resembles the cone defined by the [O iii] emission shown in Fig. 6c.
Finally, we convolved the other seven HST images to the HUT spatial resolution using a Gaussian with FWHM= and measured relative intensities by integrating over the three HUT aperture locations using the registration inferred from our fit to the F218W image. The resulting ratios are shown in Figure 7 and listed in Table 11. The continuum flux ratios computed from the HST images continue the trend with wavelength apparent in the HUT data. The observed ratios are consistent with a broader, less concentrated source of radiation becoming more dominant at longer wavelengths. The distribution of line emission viewed with HST is qualitatively, but not precisely, similar to what we see with HUT. The very broad spatial distribution of the low ionization emission lines, H and [O II] , readily apparent in the HST images, also shows up in the ratios illustrated in Figure 7 and Table 11. The closest resemblance is for the highest ionization lines, [O III] and [Ne V] , but even here we do not get a good match to the flux distribution measured with HUT.
Fig. 7.— Emission line and continuum flux ratios derived from HST images convolved to the HUT resolution with a Gaussian of 3.5′′ FWHM. Fluxes are measured within 12′′ circular apertures at the HUT observation locations determined from the fit to the F218W image.
6. Discussion
6.1. Line Emission and Potential Excitation Mechanisms
The greater extent and larger offset to the northeast of the far-UV line emission relative to the [O III] emission are at odds with a photoionized origin for the far-UV emission lines. As argued by Kriss et al. (1992), the strengths of the temperature-sensitive C III and N III emission lines imply high temperatures for the line-emitting gas. For photoionized excitation, this implies high ionization parameters. Hence, one would expect the C III and N III emission to come from a more compact region closer to the central ionizing source than the [O III] emission. Instead, the offset to the northeast along the direction of the radio jet suggests that interaction of the jet with the line emitting clouds has more importance for the production of these emission lines than photoionization by the central engine.
Table 11
HST Line and Continuum Intensity Ratios
Line/Filter
Wavelength
A1/B
A2/B
[Ne V]
3430
0.729
0.800
[O II]
3736
0.664
0.745
[O III]
5012
0.623
0.744
H
6562
0.676
0.805
F218W
2189
0.700
0.776
F336W
3342
0.779
0.855
F547M
5476
0.893
0.968
F791W
7926
0.909
0.988
The fluxes measured in the C III and N III emission lines in our Astro-2 observations are consistent with those seen in Astro-1, given the geometrical uncertainties. These uncertainties, the shorter observation times, and the complicating effects of airglow in the Astro-2 observations actually make the Astro-1 measurements a more reliable measure of the total flux contributing to the temperature-sensitive ratios I()/I() and I()/I(). Using the values with 90% confidence errors as given by Kriss et al. (1992), improved atomic physics calculations since then allow us to update the inferred temperature for the line-emitting gas. For I()/I() = , the diagnostic diagrams in McKenna et al. (1999) give . For I()/I() = , we obtain . The revisions to the relevant atomic parameters have moved both estimates in opposite directions— the C III temperature is now lower, while the N III value is higher.
As noted by Kriss et al. (1992), both temperature estimates are lower limits since they rely on observed values and do not include any corrections for extinction, which may be substantial. Our fits to the continuum give a low extinction, , but, as we argue below, this is not very reliable due to the wide variety of actual sources for the continuum light and its subsequent shape. The He ii recombination lines (, , and ) give (Kriss et al. (1992); Koski (1978)), and other indicators suggest the extinction to the line emitting regions may be as high as (Malkan & Oke (1983)). At values this high, the inferred C III temperature is 59,300 K, and the N III temperature is K.
The high temperatures implied by the observed C III and N III line ratios are easily matched by the autoionizing shock models computed by Allen, Dopita, & Tsvetanov (1998). The diagnostic diagrams they developed to discriminate between shocks and photoionization show a clear separation between shock and photoionization models when one compares the ratios [O III]/H and either C III] /C III or C III] /C III . For either ratio, the temperatures are higher than can be produced in typical photoionization models. Neither is a precise match to any of the simple shock models. Given that our large apertures encompass a wealth of unresolved complex spatial structure, it is easy to see that any simple model could easily fail. A clear resolution of this problem will require sub-arcsecond observations in far-UV lines. An experiment optimized for far-UV imaging and long-slit spectroscopy in the 900–1200 Å band could provide the key data for this problem and many others.
Ferguson et al. (1995) argue that higher-than-expected intensities of C III and N III can be produced in photoionized gas by fluorescent processes. To produce the intensities observed in NGC 1068, however, their models require turbulent velocities of . While line widths this high are observed in NGC 1068, it is hard to see how one can avoid fast shocks in clouds with such high internal turbulence. The fluorescent enhancement of photoionized emission is formally possible, but it is also certainly an incomplete physical picture of the excitation and emission process under such extreme hydrodynamic conditions. One can also get a velocity spread of in an accelerating wind, but one would expect this to occur in a very small spatial region, essentially a point source with a size on the order of the electron scattering mirror. The spatial distribution inferred from our data definitely excludes a point-like source, and so we rule out this alternative.
Another frequently cited indicator of shock excitation is the 1.6435 m transition of [Fe II]. Given the close spatial correlation between the morphology of the radio jet in NGC 1068 and of the [Fe II] emission, Blietz et al. (1994) concluded that the emission was produced in gas irradiated by nuclear X-rays, or in shocks excited by an outflow or jet from the nucleus. Examining the morphology of the [Fe II] emission in their Figure 1, one can see that it peaks near the optical/IR nucleus, but that a significant fraction of the emission arises from a more extended region to the northeast along the axis of the radio jet. This is quite similar to the morphology we infer for the far-UV emission lines from our own observations.
6.2. The Origin of the Continuum Radiation
The strong wavelength dependence of the morphology of the continuum emission suggests that a variety of sources contribute to the continuum light seen in the HUT spectra. This supports the conclusions of Neff et al. (1994) that “several sources probably contribute to the integrated UV emission of NGC 1068 ,” including dust and electron-scattered nuclear radiation, starlight, and line and continuum emission from the NLR. On spatial scales of 30″ and at wavelengths longward of 1200 Å, starlight is a major contributor. Heckman et al. (1995) discuss the aperture-size dependence of the nuclear UV flux from NGC 1068 and conclude that apertures that include the starburst ring contain substantial amounts of UV flux from starlight. The broader spatial extent we observe for radiation at wavelengths Å (see §4) suggests that much of this light has a stellar origin. This stellar flux is directly visible in the spectra from the -aperture Astro-1 observations (Kriss et al. (1992)). As discussed in §5 and shown in Fig. 6b, portions of the starburst ring also contribute to the flux seen in the A1 spectrum.
Below 1200 Å the increasing concentration of the continuum emission in the vicinity of the ionization cone can be attributed to a stronger relative contribution of scattered nuclear radiation. This is likely due to two factors that cannot be disentangled at the spatial resolution of our observations. First, some of this light must be due to the electron scattering mirror inferred from the spectropolarimetric observations (Antonucci & Miller (1985); Miller et al. (1991); Code et al. (1993); Antonucci, Hurt, & Miller (1994)). Second, the NE dust cloud visible in the imaging polarimetry of Miller, Goodrich, & Matthews (1992) and in the UV spectropolarimetry of Code et al. (1993) falls squarely within the HUT aperture location B. Since the scattering cross section of dust rises rapidly with shorter wavelengths, the intensity of scattered light from this cloud will form an increasingly large fraction of the signal in aperture B at wavelengths shortward of 1200 Å. The roughly extent we infer for the 1000 Å continuum light is comparable to the distance of the NE cloud from the optical nucleus, and could account entirely for the size we infer from our observations.
To assess the extent to which our observed fluxes are due to scattered radiation from the obscured AGN, we compare our results to spectropolarimetric observations obtained with HST (Antonucci, Hurt, & Miller (1994)) and with the Wisconsin Ultraviolet Photo-Polarimeter Experiment (WUPPE) (Code et al. (1993)). At 1800 Å, the portion of the UV flux attributable to direct reflection of the central engine by the electron scattering mirror is (Antonucci, Hurt, & Miller (1994)). The NE dust cloud contributes (Code et al. (1993)). The sum accounts for only 80% of the flux we observe at 1800 Å at aperture position B in our observations. At aperture locations A1 and A2, this total accounts for 89% and 73% of the observed flux, respectively. As locations A1 and A2 largely exclude the NE dust cloud, the fraction of the observed UV radiation we see at these locations attributable to scattered AGN radiation is likely even less. Given that the A1 and A2 spectra are significantly redder than the B spectrum, we conclude that diffusely distributed starlight and/or additional scattered (but reddened) nuclear flux is present within the central surrounding the nucleus.
7. Conclusions
We have described three spatially distinct HUT observations of NGC 1068. During observation A1 the optical nucleus was near the eastern edge of the aperture while in A2 the nucleus was near the northeastern edge. In the third observation, B, we centered the aperture on the ionization cone with the optical nucleus near the southwestern edge.
The observed fluxes and emission line ratios are consistent with those seen in our Astro-1 observations. The far-UV emission lines are brightest in aperture B in the vicinity of the ionization cone and the radio jet. All the far-UV emission lines have similar spatial distributions, including the high-excitation-temperature lines C III , N III , and O VI . We found observation B to be brighter than A1 and A2 in far-UV emission lines by factors of and respectively. From comparison to HST images, we find that the far-UV emission lines have a spatial distribution relative to the [O III] emission that is more extended and offset further to the northeast along the direction of the radio jet.
Using updated atomic physics (McKenna et al. (1999)) to re-evaluate the temperatures implied by the ratios I()/I() and I()/I(), we find a lower limit from the C III ratio of 21,200 K, and a lower limit of 27,200 K from the N III ratio. Given the high ionization parameter normally required to produce such high temperatures in photoionized gas, we would have expected the spatial distribution inferred from our observations to be more compact and more concentrated near the nucleus. Since it appears more extended and offset along the axis of the radio jet, we conclude that our Astro-2 observations provide more evidence for this emission to arise in shock-heated rather than photoionized gas.
The continuum appears to have a broader spatial distribution than the emission lines, but it grows progressively more concentrated in the ionization cone region at wavelengths shorter than 1200 Å. At longer wavelengths an increasing portion of the flux appears to come from starlight. Within aperture location A1, this arises in the starburst knots northwest of the optical nucleus. Within aperture B, 80% of the flux can be attributed to scattered nuclear radiation from the electron scattering mirror and from the NE dust cloud. The remaining flux must come from more diffusely distributed starlight or scattered (but reddened) nuclear radiation within the central .
References
- Allen et al. (1998) Allen, M. G., Dopita, M. A., & Tsvetanov, Z. I. 1998, ApJ, 493, 571
- Antonucci (1993) Antonucci, R. 1993, ARAA, 31, 473
- Antonucci, Hurt, & Miller (1994) Antonucci, R., Hurt, T., & Miller, J. 1994, ApJ, 430, 210
- Antonucci & Miller (1985) Antonucci, R. R. J., & Miller, J. S. 1985, ApJ, 297, 621
- Binette, Courvoisier, & Robinson (1988) Binette, L., Courvoisier, T. J.-L., & Robinson, A. 1988, å, 190, 29
- Blietz et al. (1994) Blietz, M., Cameron, M., Drapatz, S., Genzel, R., Krabbe, A., van der Werf, P., Sternberg, A., & Ward, M. 1994, ApJ, 421, 92
- Capetti, Axon, & Macchetto (1997) Capetti, A., Axon, D. J., & Macchetto, F. D. 1997, ApJ, 487, 560
- Cardelli, Clayton, & Mathis (1989) Cardelli, J. A., Clayton, G. C., Mathis, J. S. 1989, ApJ, 345, 245
- Code et al. (1993) Code, A. D., et al. 1993, ApJ, 403, L63
- Davidsen et al. (1992) Davidsen, A. F., et al. 1992, ApJ, 392, 264
- Dopita & Sutherland (1995) Dopita, M. A., & Sutherland, R. S. 1995, ApJ, 455, 468
- Dressel et al. (1997) Dressel, L.L., Tsvetanov, Z.I., Kriss, G.A., & Ford, H. C. 1997, in Proceedings of the NGC 1068 Workshop, eds. J.F. Gallimore & L.J. Tacconi, Ap&SS, 248, 85
- Evans et al. (1991) Evans, I. N., Ford, H. C., Kinney, A. L., Antonucci, R. R. J., Armus, L., Caganoff, S 1991, ApJ, 369, L27
- Evans et al. (1993) Evans, I. N., Tsvetanov, Z., Kriss, G. A., Ford, H. C., Caganoff, S., & Koratkar, A. P. 1993, ApJ, 417, 82
- Evans et al. (1994) Evans, I. N., Ford, H. C., Kriss, G. A., & Tsvetanov, Z. 1994, in The First Stromlo Symposium: The Physics of Active Galaxies, ed. G. V. Bicknell, M. A. Dopita, & P. J. Quinn, (Astronomical Society of the Pacific: San Francisco), p. 3
- Ferguson et al. (1995) Ferguson, J. W., Ferland, G. J., Pradhan, A. K. 1995, ApJ, 438, L55
- Ferland & Osterbrock (1986) Ferland, G., & Osterbrock, D. E. 1986, ApJ, 300, 658
- Gallimore et al. (1996) Gallimore, J. F., Baum, S. A., O’Dea, C. P., & Pedlar, A. 1996, ApJ, 458, 136
- Heckman et al. (1995) Heckman, T., Krolik, J., Meurer, G., Calzetti, D., Kinney, A., Koratkar, A., Leitherer, C., Robert, C., & Wilson, A. 1995, ApJ, 452, 549
- Huchra et al. (1992) Huchra, J., Geller, M., Clemens, C., Tokarz, S. & Michel, A. 1992, Bull. Inf. C.D.S. 41, 31
- Koski (1978) Koski, A. T. 1978, ApJ, 223, 56
- Kriss (1994) Kriss, G. A. 1994, in Astronomical Data Analysis Software and Systems III, ASP Conf. Proc. 61, ed. D. R. Crabtree, R. J. Hanisch, & J. Barnes (San Francisco: ASP), 437
- Kriss et al. (1992) Kriss, G. A., Davidsen, A. F., Blair, W. P., Ferguson, H. C., Long, K. S. 1992, ApJ, 394, L37
- Krolik & Begelman (1986) Krolik, J. H., & Begelman, M. C. 1986, ApJ, 308, 55
- Krolik & Lepp (1989) Krolik, J. H., & Lepp, S. 1989, ApJ, 347, 179
- Kruk et al. (1995) Kruk, J. W., Durrance S. T., Kriss, G. A., Davidsen, A. F., Blair, W. P., Espey, B. R. 1995, ApJ, 454, L1
- Kruk et al. (1999) Kruk, J. W., Brown, T. M., Davidsen, A. F., Espey, B. R., Finley, D. S., & Kriss, G. A. 1999, ApJS, 122, 1
- Malkan & Oke (1983) Malkan, M. A., & Oke, J. B. 1983, ApJ, 265, 92
- McKenna et al. (1999) McKenna, F., et al. 1997, in preparation
- Miller et al. (1991) Miller, J. S., Goodrich, R. W., Mathews, W. G. 1991, ApJ, 378, 47
- Morse, Raymond, & Wilson (1996) Morse, J. A., Raymond, J. C., Wilson, A. S. 1996, PASP, 108, 426
- Neff et al. (1994) Neff, S., et al. 1994, ApJ, 430, 545
- Pogge (1989) Pogge, R. W. 1989, ApJ, 345, 730
- Snijders et al. (1986) Snijders, M. A., Netzer, H, Boksenberg, A. 1986, MNRAS, 222, 549
- Sutherland, Bicknell, & Dopita (1993) Sutherland, R. S., Bicknell, G. V., & Dopita, M. A. 1993, ApJ, 414, 510
- Taylor, Dyson, & Axon (1992) Taylor, D., Dyson, J. E., Axon, D. J. 1992, MNRAS, 255, 351
- Tsvetanov (1989) Tsvetanov, Z. 1989, Nature, 341, 422
- Veilleux & Osterbrock (1987) Veilleux, S., & Osterbrock, D. E. 1987, ApJS, 63, 295
- Wilson & Tsvetanov (1994) Wilson, A. S., & Tsvetanov, Z. I. 1994, AJ, 107, 1227
- Wilson & Ulvestad (1987) Wilson, A. S., & Ulvestad, J. S. 1987, ApJ, 319, 105