The First Sources of Light in the Universe
Abstract
The formation of the first stars and quasars marks the transition between the smooth initial state and the clumpy current state of the Universe. In popular CDM cosmologies, the first sources started to form at a redshift and ionized most of the hydrogen in the Universe by . Current observations are at the threshold of probing the reionization epoch. The study of high-redshift sources is likely to attract major attention in observational and theoretical cosmology over the next decade.
Astronomy Department, Harvard University, Cambridge, MA 02138
Preface
It is a special privilege for me to contribute to the celebration of Hy Spinrad’s 65th birthday. Although I am not an observer, I can empathise with the Hy- experience that was described so often at this meeting. About seven years ago, when I started constructing theoretical models for sources at high redshifts, there was little interest in this problem among my fellow theorists, with a few notable exceptions. It now appears in retrospect that I could have made more friends among the observers. Thanks to the pioneering work of Hy and his colleagues, this field has not only matured over the past several years, but might actually come to dominate the research in cosmology over the next decade.
1. Introduction
The detection of cosmic microwave background (CMB) anisotropies (Bennet et al. 1996) confirmed the notion that the present structure in the Universe originated from small density fluctuations at early times. The gravitational collapse of overdense regions could explain the present-day abundance of bound objects, such as galaxies or X-ray clusters, under the appropriate extrapolation of the detected large-scale anisotropies to smaller scales (e.g., Baugh et al. 1997). Recent deep observations with the Hubble Space Telescope (Steidel et al. 1996; Madau et al. 1996; Chen et al. 1998; Clements et al. 1999) and ground-based telescopes, such as Keck (Lowenthal et al. 1996; Dey et al. 1999; Hu et al. 1998, 1999; Spinrad et al. 1999; Steidel et al. 1999), have constrained considerably the evolution of galaxies and their stellar content at . However, in the bottom-up hierarchy of the popular Cold Dark Matter (CDM) cosmologies, galaxies were assembled out of building blocks of smaller mass. The elementary building blocks, i.e. the first gaseous objects to have formed, acquired a total mass of order the Jeans mass (), below which gas pressure opposed gravity and prevented collapse (Haiman & Loeb 1997; Ostriker & Gnedin 1997). In variants of the standard CDM cosmology, these basic building blocks formed at – (see Fig. 1).

The first light from stars and quasars ended the “dark ages” of the Universe and initiated a “renaissance of enlightenment” in the otherwise fading glow of the big bang. It is easy to see why the mere conversion of trace amounts of gas into stars or black holes at this early epoch could have had a dramatic effect on the ionization state and temperature of the rest of the gas in the Universe. Nuclear fusion releases eV per hydrogen atom, and thin-disk accretion onto a Schwarzschild black hole releases ten times more energy; however, the ionization of hydrogen requires only 13.6 eV. It is therefore sufficient to convert a small fraction of of the total baryonic mass into stars or black holes in order to ionize the rest of the Universe. (The actual required fraction is higher because only some of the emitted photons are above the ionization threshold of 13.6 eV and because each hydrogen atom could recombine more than once at ).
Calculations of structure formation in popular CDM cosmologies imply that the Universe was ionized at – (Haiman & Loeb 1998, 1999b,c; Gnedin & Ostriker 1998). The free electrons produced during reionization scatter the microwave background and smooth its anisotropies on angular scales below the size of the horizon at the reionization epoch ( for reionization at ). The fractional decrement in the anisotropy amplitude is of order the optical depth of the intergalactic medium to Thomson scattering, i.e. a few percent. The forthcoming MAP and PLANCK satellites will thus be able to constrain the reionization redshift (Zaldarriaga, Seljak, & Spergel 1997). Secondary anisotropies are also produced during this epoch on smaller angular scales (Hu 1999).
A variety of CDM models that are all consistent with both the COBE anisotropies () and the abundance of objects today () differ appreciably in their initial amplitude of density fluctuations on small scales. The reionization history of the Universe is determined by the collapse redshift of the smallest objects (–) and is therefore ideally suited to discriminate between these models.
2. Formation of the First Galaxies
Current observations reveal the existence of galaxies out to redshifts as high as (Chen et al. 1999; Weymann et al. 1998; Dey et al. 1998; Spinrad et al. 1998; Hu et al. 1998, 1999) or possibly even higher (Clements et al. 1999), and bright quasars out to (Fan et al. 1999). Based on sources for which high resolution spectra are available, the intergalactic medium appears to be predominantly ionized at this epoch, implying the existence of ionizing sources at even higher redshifts (Madau 1999; Madau, Haardt, & Rees 1999; Haiman & Loeb 1998, 1999c; Gnedin & Ostriker 1997).
The Next Generation Space Telescope (NGST), the successor to the Hubble Space Telescope, is scheduled for launch in 2008, and is expected to reach an imaging sensitivity better than 1 nJy in the infrared. Its main scientific goal is to probe directly the first galaxies (see, http://ngst.gsfc.nasa.gov/ for more details).
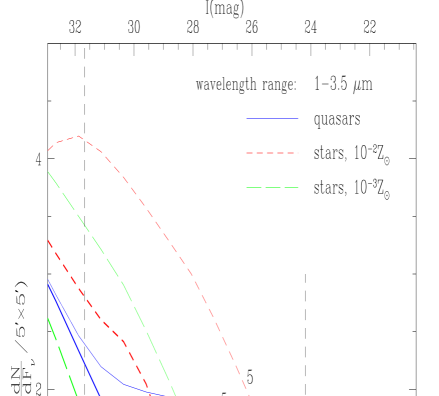
How many sources will NGST see? Figure 2 shows the predicted number of quasars and star clusters expected per field of view of NGST, based on semi-analytic modeling of a hierarchical CDM cosmology (Haiman & Loeb 1999c). In this calculation, a fraction of the gas in each dark matter halo forms stars, and a much smaller fraction assembles into a massive central black hole. The star formation efficiency was calibrated based on the inferred metallicity range of the Ly forest (Songaila & Cowie 1996; Tytler et al. 1995) while the characteristic quasar lightcurve was calibrated in Eddington units so as to fit simultaneously the observed luminosity function of bright quasars at –4, and the black hole mass function in the local universe (Magorrian et al. 1998). Both populations of sources were extrapolated to high redshifts and low luminosities using the Press-Schechter formalism (for more details, see Haiman & Loeb 1997, 1998, 1999c).
Typically, there should be of order tens of sources at redshifts per field of view of NGST. The lack of point source detection in the Hubble Deep Field is consistent with a low-mass cutoff for luminous matter in halos with circular velocities –75, due to photoionization heating (Haiman, Madau, & Loeb 1999). The redshift of early sources can be easily identified photometrically based on their Ly trough. Figure 2 demonstrates that NGST will play a dominant role in exploring the reionization epoch and in bridging between the initial and current states of the Universe. Existing telescopes are just starting to probe this epoch now.
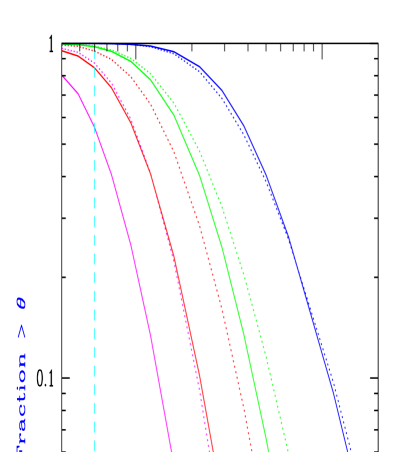
The expected size distribution of high-redshift galaxies was calculated semi-analytically by Barkana & Loeb (1999). Figure 3 shows that most of the galaxies are more extended than the resolution limit of NGST, . Despite the cosmological dimming in surface brightness, galaxies at are predicted to have an observed surface brightness which is comparable to their counterparts. This follows from the decline in the proper size of galactic disks with increasing redshift (which is caused by the higher density of the Universe and the lower masses of the galaxies at high redshifts). Due to the compactness of high-redshift galaxies, only of the sky is expected to be covered by galactic disks at and only by galaxies at . Hence, deep high-resolution observations of galaxies at high-redshifts (e.g., with NGST) are not expected to be confusion limited or miss considerable levels of star formation due to surface brightness limitations. The radiation produced by the first sources might however get reprocessed through galactic and intergalactic dust and contribute to the diffuse infrared background (Haiman & Loeb 1998; Loeb & Haiman 1997).
Barkana & Loeb (1999) also predicted that about of these galaxies will be gravitationally lensed by foreground galaxies. Lensing would bring into view sources which are otherwise below the detection threshold. Lensed sources would be multiply imaged and hence appear to be compsed of multiple components; their redshift identification requires sub-arcsecond resolution, since it might be otherwise compromised by blending of background light from the lensing galaxy.
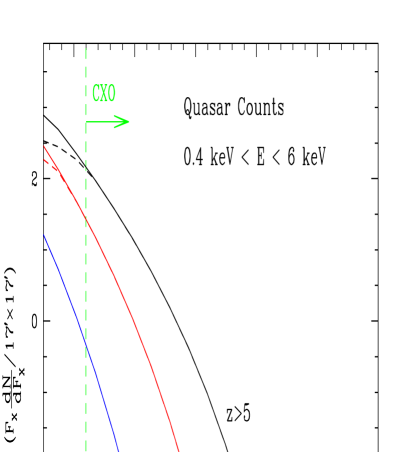
Which sources triggered reionization? It is currently unknown whether the Universe was reionized by quasars or stars at . Haiman & Loeb (1999b) pointed out that quasars can be best distinguished from stellar sources by their X-ray emission. Based on simple semi-analytic extension of the observed quasar luminosity function, we have shown that deep X-ray imaging with CXO will likely reveal quasars per field of view from redshift at the flux threshold of (see Fig. 4). The redshifts of these faint point-sources could be identified by follow-up infrared observations from the ground or with NGST. By summing-up the UV emission from these quasars, one could determine whether they triggered reionization. The X-ray selection of these quasars is not influenced by dust obscuration.
3. Feedback on the Intergalactic Medium (IGM)
3.1. Reionization
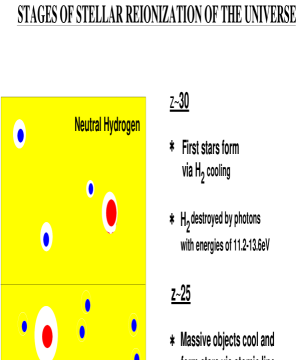
The stages in the reionization history of the Universe are illustrated schematically in Figure 5. This sequence follows the collapse redshift history of baryonic objects shown in Figure 1, which was calculated with a spherically-symmetric code for the gas and the dark matter dynamics (Haiman, Thoul, & Loeb 1996). For objects with baryonic masses , gravity dominates and results in the characteristic bottom-up hierarchy of CDM cosmologies; at lower masses, gas pressure delays the collapse. The first objects to collapse are located at the “knee” that separates the above regimes. Such objects reach virial temperatures of several hundred degrees and could fragment into stars only through cooling by molecular hydrogen [see Haiman et al. (1996) or Tegmark et al. (1997), for details regarding the chemistry network leading to the formation of in a primordial gas].
However, molecular hydrogen () is fragile and could easily be photo-dissociated by photons with energies of –eV, to which the Universe is transparent even before it gets ionized. Haiman, Rees, & Loeb (1997) showed that a UV flux of is capable of dissociating throughout the collapsed environments in the Universe (see also Haiman, Abel, & Rees 1999). This flux is lower by more than two orders of magnitude than the minimum flux necessary to ionize the Universe, which amounts to one UV photon per baryon. The inevitable conclusion is that soon after the first stars form, the formation of additional stars due to cooling is suppressed. Further fragmentation is possible only through atomic line cooling, which is effective in objects with high virial temperatures, K. Such objects correspond to a total mass . Figure 5 illustrates this sequence of events by describing two classes of objects: those with K (small dots) and those with K (large dots). In the first stage (top panel), some low-mass objects collapse, form stars, and create ionized hydrogen (HII) bubbles around them. Once the UV background between 11.2–13.6eV reaches some critical level, is photo-dissociated throughout the Universe and the formation of new stars is delayed until objects with K collapse. Each massive source creates an HII region which expands into the intergalactic medium. Initially the volume of the Universe is dominated by neutral hydrogen (HI). But as new sources appear exponentially fast (due to the Gaussian tail of the rare high-amplitude perturbations), numerous HII bubbles add up, overlap, and transform all the remaining HI into HII over a short period of time. Since the characteristic separation between sources is eventually much smaller than the Hubble distance, the transition completes over a period of time which is much shorter than the Hubble time, and can be regarded as sudden.
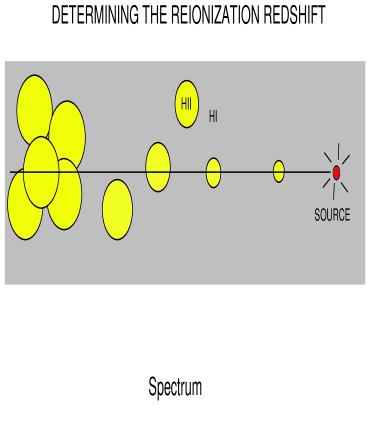
Reionization is defined as the time when the volume filling factor of ionized hydrogen in the intergalactic medium (IGM) approached a value close to unity. Is it possible to identify the reionization redshift, , from the spectrum of high-redshift sources? The most distinct feature in the spectrum of a source at would be the Gunn-Peterson absorption trough due to the neutral intergalactic medium that fills the Universe prior to reionization. Figure 6 provides a sketch of the spectrum of a source with , which contains some transmitted flux between the Gunn-Peterson troughs due to Ly and Ly absorption. This transmitted flux is suppressed by the residual Ly forest in the post-reionization era (Haiman & Loeb 1999a). The possibility of identifying from the damping wing of the Gunn-Peterson trough (Miralda-Escudé 1997) suffers from potential confusion with damped Ly absorption along the line of sight and from ambiguities due to peculiar velocities and the proximity effect. An alternative method makes use of the superposition of the spectra of many sources. In the absence of the Ly forest this superposition should result in the sawtooth template spectrum (Haiman, Rees, & Loeb 1997).
The reionization redshift can also be inferred from a direct detection of intergalactic HI. Loeb & Rybicki (1999) have shown that the existence of a neutral IGM before reionization can be inferred from narrow-band imaging of embedded Ly sources. The spectra of the first galaxies and quasars in the Universe should be strongly absorbed shortward of their rest-frame Ly wavelength by neutral hydrogen in the intervening intergalactic medium. However, the Ly line photons emitted by these sources are not eliminated but rather scatter until they redshift out of resonance and escape due to the Hubble expansion of the surrounding intergalactic HI (see Fig. 7). Typically, the Ly photons emitted by a source at scatter over a characteristic angular radius of around the source and compose a line which is broadened and redshifted by relative to the source. The scattered photons are highly polarized (Rybicki & Loeb 1999). Detection of the diffuse Ly halos around high redshift sources would provide a unique tool for probing the neutral intergalactic medium before the epoch of reionization. The Ly sources serve as lampposts which illuminate the surrounding HI fog. On sufficiently large scales where the Hubble flow is smooth and the gas is neutral, the Ly brightness distribution can be used to determine the cosmological mass densities of baryons and matter. NGST might be able to detect the Ly halos around sources as bright as the galaxy discovered by Hu et al. (1999) at , even if such a galaxy is moved out to .
Loeb & Rybicki (1999) explored the above effect for a uniform, fully-neutral IGM in a pure Hubble flow. It would be useful to extend their analysis to more realistic cases of sources embedded in an inhomogeneous IGM, which is partially ionized by the same sources. One could extract particular realizations of the perturbed IGM around massive galaxies from hydrodynamic simulation, and apply a suitable radiative transfer code to propagate the Ly photons from the embedded galaxies. Observations of Ly halos could in principle be used to map the pecluiar velocity and density fields of the neutral IGM during the reionization epoch.
3.2. Metal Enrichment
In addition to altering the ionization state of hydrogen in the Universe, the first galaxies enriched the IGM with metals. Because the potential wells of the first dwarf galaxies are relatively shallow (), supernova–driven winds are likely to have expelled the metal–rich gas out of these systems and mixed it with the intergalactic medium. Incomplete mixing could have led to the observed order-of-magnitude scatter in the C/H ratio along lines-of-sight to different quasars (Rauch, Haehnelt, & Steinmetz 1997; Hellsten et al. 1998). It is an interesting coincidence that the supernova energy output associated with a metal enrichment of corresponds to eV per hydrogen atom, which is just above the binding energy of these early star clusters. Supernova feedback in these objects could have therefore dictated the average metallicity observed in the Ly forest. Direct observations of these supernovae might be feasible in the future (Miralda-Escudé & Rees 1997).
The rise of the UV background during reionization is also expected to boil the gas out of shallow potential wells. Barkana & Loeb (1998) have shown that a dominant fraction of the virialized gas in the Universe at will likely reside in potential wells with circular velocity of and evaporate shortly after reionization. This process could also enrich the intergalactic medium with metals.
Acknowledgments.
I thank my collaborators, Rannan Barkana, Zoltan Haiman, Martin Rees, and George Rybicki for many illuminating discussions on the topics described in this review. This work was supported in part by the NASA grants NAG 5-7039 and NAG 5-7768.
References
Barkana, R., & Loeb, A. 1999a, ApJ, in press, astro-ph/9901114
Barkana, R., & Loeb, A. 1999b, ApJ, submitted, astro-ph/9906398
Baugh, C. M., Cole, S., Frenk, C. S. & Lacey, C. G. 1997, astro-ph/9703111
Bennett, C. L. et al. 1996, ApJ, 464, L1
Chen, H.-W., Lanzetta, K., & Pascarelle, S. 1999, Nature, 398, 586
Dey, A., et al. 1998, ApJ, 498, L93
Fan, X. et al. (SDSS collaboration) 1999, AJ, in press, astro-ph/9903237
Gnedin, N. Y., & Ostriker J. P. 1997, ApJ, 486, 581
Haiman, Z., & Loeb, A. 1997, ApJ, 483, 21
Haiman, Z., & Loeb, A. 1998, ApJ, 503, 505
Haiman, Z., & Loeb, A. 1999a, ApJ, in press, astro-ph/9807070
——————————. 1999b, ApJ, in press, astro-ph/9904340
——————————. 1999c, in “After the Dark Ages: When Galaxies Were Young (the Universe at )”, Eds. S. S. Holt & E. P. Smith, AIP Conf. Proc. 470, (AIP: New-York), pp. 34-47, astro-ph/9811395
Haiman, Z., Abel, T., & Rees, M. J. 1999, ApJ, submitted, astro-ph/9903336
Haiman, Z., Madau, P., & Loeb, A. 1999, ApJ, 514, 535
Haiman, Z., Thoul, A., & Loeb, A. 1996, ApJ, 464, 523
Haiman, Z., Rees, M. J., & Loeb, A. 1996, ApJ, 467, 522
———————————————–.1997, ApJ, 476, 458
Hellsten, U., Hernquist, L., Katz, N., & Weinberg, D. H., 1998, ApJ, 499, 172
Hu, W. 1999, ApJ, submitted, astro-ph/9907103
Hu, E. M., Cowie, L. L. & McMahon, R. G. 1998, ApJ, 502, L99
Hu, E. M., McMahon, R. G., & Cowie, L. L. 1999, astro-ph/9907079
Loeb, A., & Haiman, Z. 1997, ApJ, 490, 571
Loeb, A., & Rybicki, G. 1999, ApJ, in press, astro-ph/9902180
Lowenthal, J. D., Koo, D. C., Guzman, R., Gallego, J., Phillips, A. C., Faber, S. M., Vogt, N. P., Illingworth, G. D., & Gronwall, C. 1996, ApJ, in press, astro-ph/9612239
Madau, P. 1999, in Physica Scripta, Proceedings of the Nobel Symposium, Particle Physics and the Universe (Enkoping, Sweden, August 20-25, 1998), astro-ph/9902228
Madau, P., Ferguson, H. C., Dickinson, M., Giavalisco, M., Steidel, C. C., & Fruchter, A. 1996, MNRAS, 283, 1388
Madau, P., Haardt, F., & Rees, M. J. 1999, ApJ, 514, 648
Magorrian, J., et al. 1998, AJ, 115, 2285
Miralda-Escude, J. 1997, ApJ, 501, 15
Miralda-Escude, J., & Rees, M. 1997, ApJL, 478, L57
Ostriker, J. P., & Gnedin 1996, N. Y. 1996, 472, L63
Rauch, M., Haehnelt, M. G. & Steinmetz M. 1997, ApJ, 481, 601
Rybicki, G., & Loeb, A. 1999, ApJL, in press, astro-ph/9903291
Songaila, A., & Cowie, L. L. 1996, AJ, 112, 335
Spinrad, H. et al. 1998, AJ, 116, 2617
Steidel, C. C., Giavalisco, M., Dickinson, M., Adelberger, K. L. 1996, AJ, 112, 352
Tegmark, M. et al., 1997, ApJ, 474, 1
Tytler, D. et al. 1995, in QSO Absorption Lines, ed. G. Meylan ed., Springer, p. 289
Weymann, R. J., et al. 1998, ApJ, 505, L95
Zaldarriaga, M., Spergel, D. N., & Seljak, U. 1997, ApJ, 488, 1