Radio Continuum Morphology of Southern
Seyfert Galaxies
††thanks: Based on observations done with the Australia Telescope
Compact Array (ATCA) and the Very Large Array(VLA)
Abstract
We present radio observations for 29 southern Seyfert galaxies selected from a volume limited sample with km s-1, and declination . Objects with declination were observed with the Very Large Array (VLA) at 6 cm (4.9 GHz) and objects with were observed with the Australia Telescope Compact Array (ATCA) at 3.5 cm (8.6 GHz). Both the VLA and the ATCA observations have a resolution of . These new observations cover more than 50% of the southern sample with all but two of the 29 objects detected above our limit of 0.15 mJy. Combining these data with data available from the literature gives almost 85% coverage of the southern sample and further expands the radio observations of a distance limited sample by 22%.
Collecting additional sources from the literature, consisting of known Seyferts with km s-1, we find that 38% of the sources are unresolved at arcsecond resolution, and 34% have linear radio structure. Our results expand upon and are consistent with earlier studies. We confirm a correlation between the size of the radio structure and the radio luminosity. A comparison between Seyfert types 1 and 2 finds that type 2s tend to have a larger linear size. There is no statistically significant difference in radio power between types 1 and 2, although all the most powerful objects appear to be Seyfert 2’s. No significant difference has been found in the spectral indices.
Key Words.:
radio sources: galaxies, galaxies: Seyfert1 Introduction
Radio emission from Seyfert galaxies traces energetic, mechanical processes occurring in the active nucleus. The radio continuum spectra of Seyferts are almost invariably steep, consistent with optically-thin synchrotron emission. In those sources where the radio continuum has been resolved, the morphology is commonly linear, interpreted to trace a stream of ejected plasma, or a jet, originating from the central engine. For example, most well-resolved Seyfert radio sources are double or triple sources straddling the active nucleus. The radio emission of the nearest and brightest Seyferts resolves into tightly collimated structures originating from the active nucleus, consistent with a jet interpretation (e.g., NGC 1068: Gallimore et al. 1996; Muxlow et al. 1996; Wilson & Ulvestad 1983; NGC 4151: Pedlar et al. 1993; Mrk 3: Kukula et al. 1993). There is evidence that Seyfert radio jets impact the dense gas in the near-nucleus environment and affect the gas distribution, morphology, and ionization of the narrow-line region (NLR). The orientation of the radio jet is also the only straightforward measure of the symmetry axis of the active nucleus, useful for testing orientation-based unifying schemes for AGNs.
Early studies searching for differences between Seyfert 1’s and 2’s (de Bruyn & Wilson 1978; Meurs & Wilson (1984); Ulvestad & Wilson 1984a , Ulvestad & Wilson 1984b ) concluded that Seyfert 2’s have stronger and larger radio sources than Seyfert 1’s, however, these studies were biased by optical selection: weaker Seyfert 2 galaxies were omitted from the samples. There was found to be little or no difference between Seyfert 1 and 2 radio sources in follow-up studies which properly considered relatively unbiased, volume-limited samples (Edelson (1987); Ulvestad & Wilson (1989); Giuricin et al. 1990). More specifically, there is no statistically significant difference in the distribution of radio luminosity, and only a marginal difference in the distribution of radio source sizes, with Seyfert 2’s tending to be slightly larger than Seyfert 1’s (although only at % significance, Wilson 1991). In contrast, unifying schemes predict that the radio jets in Seyfert 2’s should appear larger in projection, since the unifying model orients the collimating disk more nearly edge-on in narrow-line AGNs. It is not simple to reconcile the statistics of radio sources with the unified scheme hypothesis.
While there is no tendency for the radio sources to orient in any preferred direction with respect to the plane of the host galaxy (Ulvestad & Wilson 1984a ), the radio sources are commonly elongated in the same direction as the NLR (Haniff, Wilson & Ward 1988; Pogge (1989); Wilson, Ward & Haniff 1988), i.e. the inner part of the optical emission regions (extending up to few kpc). In some Seyfert 2s the NLR has a conical or bi-conical shape with the nucleus at the apex (eg. Pogge (1989); Pogge 1997). Wilson & Tsvetanov (1994) showed that the radio axis is invariably co-aligned with the ionization cone axis for the 11 ionization cones known at that time.
The alignment of the radio jet and NLR raises a question of energetics — does the radio jet ionize and heat the NLR significantly compared to ionizing radiation from the AGN? In several well-studied cases, there is a detailed morphological association between the NLR and the radio emission (e.g. Whittle et al. 1988, Whittle 1989, Capetti et al. 1996; Gallimore et al. 1996). Currently, the numbers of such well-studied cases is too small to address questions of interaction and energetics in a statistically complete and meaningful sense.
To this end, Tsvetanov et al. (in prep.) have recently assembled a volume-limited sample ( km s-1) of well-classified Seyfert galaxies. The main advantage of this sample is that all of the sources have been extensively observed in the optical with narrow-band imaging done with the ESO NTT, 3.6m and 2.2m telescopes. This survey provides high-quality emission-line maps (in [O III] 5007and H+[N II]) with a typical resolution of ″. The sample includes objects with and without known extended emission line regions, providing detailed information about the extent, morphology, and degree of ionization (obtained from the [O III] 5007/H+[N II]ratio) of the emission-line regions. It is therefore important to obtain for such a sample detailed radio images in order to perform a detailed comparison of the radio and optical morphology on arcsecond (hundred-pc) scales.
Here we present a radio imaging survey of the Tsvetanov et al. sample, made using the Very Large Array (VLA)111The National Radio Astronomy Observatory is operated by Associated Universities, Inc., under contract with National Science Foundation. and the Australia Telescope Compact Array (ATCA)222Operated by the CSIRO Australia Telescope National Facility. aperture synthesis telescopes. Observing configurations and frequencies were chosen to match the 1″ resolution of the optical narrow-band observations. We discuss the radio properties and statistics for the 29 surveyed sources, and a more detailed comparison of the radio and optical properties will be presented in a forthcoming paper.
2 Observations
2.1 Sample
The sample includes 51 well classified (from their optical spectra) Seyfert galaxies south of declination and with redshift km s-1. More details about selection and optical observations of this sample are presented in Tsvetanov et al. (in prep.), Tsvetanov et al. (1998).
The 29 sources listed in Table 1 were observed with either the VLA or ATCA, depending on their declination. One source, NGC 3393, was observed with both arrays. The array configurations and frequencies were chosen to obtain a resolution of ″ in order to match the resolution of the optical data. In particular, the VLA was used in its B and BNA configurations, providing a resolution of 1 ″ at 6 cm (4.9 GHz). To obtain similar resolution with the ATCA required an observing frequency of 3.5 cm (8.6 GHz) with the 6 km configuration. Owing to missing short baselines in either array, our data are more sensitive to compact emission from the circumnuclear region but less sensitive to extended, diffuse emission. In addition, faint, diffuse emission from active spirals tends to have very steeply falling radio spectra with increasing frequency; at observing wavelengths of 3.5 and 6 cm any diffuse emission will probably have dropped below our surface brightness detection limit.
Table 1: VLA observations (6 cm)
| Object | Resolution | rms | Peak | Array | ||||||
|---|---|---|---|---|---|---|---|---|---|---|
| arcsec | arcsec | deg | mJy beam-1 | mJy beam-1 | ||||||
| NGC 1097 | 02 46 19.1 | 30 16 28 | 2.1 | 1.3 | 59 | 0 | .051 | 3 | .78 | BNA |
| NGC 1320 | 03 24 48.7 | 03 02 33 | 2.5 | 1.4 | 38 | 0 | .081 | 1 | .98 | B |
| NGC 3393 | 10 48 24.0 | 25 09 40 | 2.2 | 1.3 | 3 | 0 | .049 | 15 | .80 | BNA |
| NGC 3660 | 11 23 32.2 | 08 39 30 | 2.1 | 1.4 | 1 | 0 | .049 | 0 | .49 | B |
| NGC 4968 | 13 07 06.0 | 23 40 43 | 2.3 | 1.4 | 4 | 0 | .046 | 13 | .06 | BNA |
| NGC 5427 | 14 03 25.9 | 06 01 50 | 2.1 | 1.4 | 17 | 0 | .048 | 2 | .49 | B |
| NGC 7172 | 22 02 02.1 | 31 52 12 | 3.6 | 1.0 | 36 | 0 | .053 | 3 | .62 | BNA |
| NGC 7314 | 22 35 46.0 | 26 03 02 | 3.0 | 1.2 | 31 | 0 | .034 | 2 | .74 | BNA |
Many of those sources lying north of have been observed in previous studies. The data available in the literature will be included in our discussion in 4.
Thoughout the paper we adopt a Hubble constant H∘=75 km s-1 Mpc-1.
2.2 VLA Observations
VLA snapshot observations were obtained for eight of the survey Seyferts in the declination range . The VLA observations are summarized in Table 1. The observations were carried out using the standard 6 cm (4.9 GHz) continuum mode, that is, with two 50 MHz-wide channels at bandwidth-separated frequencies (4.835 & 4.885 GHz). Three sources were observed using the B-array (8 Apr 1993); the remaining five were observed using the BN333The BN configuration comprises the east-west portion of the B-array and and extended northern arm; this configuration provides roughly B-array resolution for southern sources. array (1 Feb 1993).
Data reduction followed standard procedures using the NRAO software package AIPS. The calibration sequence includes: (1) calibrating the flux scale against observations of the flux standards 3C 48 & 3C 286, adopting the standard scaling of Baars et al. (1977) and adjusting for calibrator variability; (2) bootstrapping this flux scale to observations of the phase calibrators; (3) performing station-based phase and amplitude calibrations on the phase calibrators; and (4) applying the phase calibrator solutions to the target sources. Four iterations of phase-only self-calibration were then applied to each source. Solution intervals were typically 5–10 minutes for each iteration of self-calibration.
2.3 ATCA observations
The ATCA observing parameters are summarized in Table 2. Twenty-two objects in the most southern part of this sample () were observed at 3.5 cm (8.6 GHz) with the ATCA in 6 km configuration. The only overlap with the VLA observations is NGC 3393.
Table 2: ATCA Observations (3.5 cm)
| Object | Resolution | rms | Peak | ||||
|---|---|---|---|---|---|---|---|
| arcsec | arcsec | degrees | mJy beam-1 | mJy beam-1 | |||
| TOL 0109-383 | 01 11 27.8 | –38 04 58 | 2.58 | 0.83 | 46.0 | 0.14 | 10.43 |
| NGC 1365 | 03 33 35.5 | –36 08 22 | 1.61 | 0.77 | 5.4 | 0.11 | 4.06 |
| NGC 1386 | 03 36 46.3 | –35 59 58 | 1.68 | 0.75 | –0.6 | 0.13 | 9.88 |
| NGC 1566 | 04 20 00.3 | –54 56 18 | 1.29 | 0.75 | 17.5 | 0.17 | 5.65 |
| ESO 362-G18 | 05 19 35.5 | –32 39 30 | 1.89 | 0.75 | –5.7 | 0.14 | 2.40 |
| IC 2560 | 10 16 19.2 | –33 33 53 | 1.76 | 0.94 | –19.3 | 0.26 | 3.86 |
| NGC 3281 | 10 31 52.1 | –34 51 15 | 1.67 | 0.80 | –16.3 | 0.20 | 16.06 |
| NGC 3393 | 10 48 24.0 | –25 09 40 | 2.29 | 0.76 | –0.5 | 0.17 | 7.33 |
| NGC 3783 | 11 39 01.7 | –37 44 19 | 1.59 | 0.74 | –10.5 | 0.24 | 8.15 |
| NGC 4507 | 12 35 37.0 | –39 54 31 | 1.45 | 0.83 | 25.0 | 0.16 | 3.18 |
| TOL 1238-364 | 12 40 52.8 | –36 45 21 | 2.42 | 0.88 | 50.0 | 0.16 | 10.29 |
| MCG-6-30-15 | 13 35 53.7 | –34 17 45 | 1.66 | 0.79 | 1.2 | 0.16 | 0.62 |
| NGC 5643 | 14 32 41.3 | –44 10 24 | 1.50 | 0.71 | –1.7 | 0.10 | 4.36 |
| ESO 137-G34 | 16 35 14.2 | –58 04 41 | 1.32 | 0.70 | 32.6 | 0.12 | 2.02 |
| ESO 138-G01 | 16 51 20.5 | –59 14 11 | 1.42 | 0.71 | 45.9 | 0.14 | 4.34 |
| NGC 6221 | 16 52 46.6 | –59 12 59 | 1.29 | 0.72 | 27.6 | 0.16 | 2.96 |
| NGC 6300 | 17 16 59.2 | –62 49 11 | 1.48 | 0.72 | 28.3 | 0.14 | 2.03 |
| IC 5063 | 20 52 02.8 | –57 04 14 | 1.05 | 0.81 | 51.8 | 0.15 | 160.01 |
| IC 5201 | 22 20 57.3 | –46 02 04 | 1.32 | 0.82 | 3.0 | 0.15 | 0.45 |
| NGC 7496 | 23 09 46.9 | –43 25 42 | 1.94 | 0.67 | 16.1 | 0.12 | 4.83 |
| NGC 7582 | 23 18 23.1 | –42 22 11 | 1.29 | 0.78 | 2.7 | 0.10 | 6.22 |
| NGC 7590 | 23 18 55.0 | –42 14 16 | 1.39 | 0.88 | 7.2 | 0.30 | 0.90 |
The observations occurred during July, 1995. Data were taken simultaneously at 8.256 and 8.896 GHz, each through a bandwidth of 128 MHz. These dual-frequency observations improved the coverage of the -plane and the sensitivity. Use of dual-frequency synthesis substantially improves the image quality generated by data from sparse arrays.
We used the MIRIAD package (Sault, Teuben & Wright (1995)) for data reduction. The flux density scale was calibrated against observations of PKS 1934638, assumed to be 2.84 Jy at 8.6 GHz according to the latest analysis by Reynolds (1996). Each source was observed in 8 scans with a duration of roughly 20 minutes each. The scans were spread throughout a 12 hour observing period in order to optimize the coverage within the available integration time. Sources with particularly weak or interesting structure were repeated in order to improve the signal-to-noise and image quality.
3 Results
Table 3 summarizes our measurements for the 29 observed Seyferts. The listed radio morphologies follow the convention of Ulvestad & Wilson (1989). The angular and linear size of the radio emission, measured for those Seyferts with well-resolved radio structure, were measured to the outermost significant surface brightness contour; upper limits are given for unresolved Seyferts. The radio maps of the resolved objects are presented in Figures 1 to 4 for the objects observed with the VLA and in Figures 5 to 15 for the objects observed with ATCA. To emphasize ring or shell structures that can be lost on contour maps, we present all maps as contours on top of greyscale.
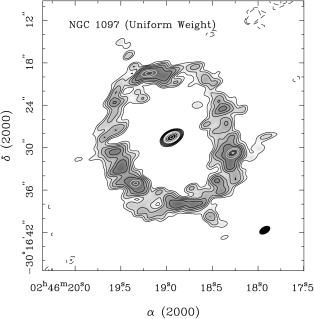
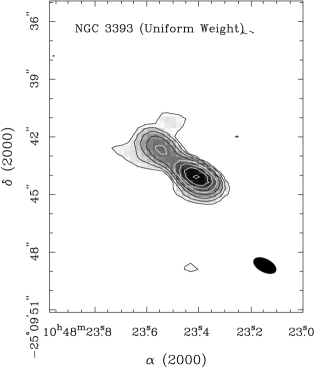
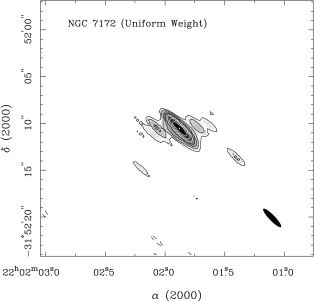
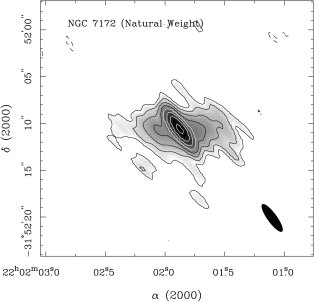
Table 3. The Radio Parameters
from VLA & ATCA observations
| Object | cz | Type | log P6cm | Radio | LAS | LLS | |
| km/s | Sey | mJy | W Hz-1 | Morp. | arcsec | kpc | |
| NGC 1097 | 1276 | 1* | 62.3 | 21.33 | U+R | 16.0 | 1.32 |
| NGC 1097 nucleus | … | 1* | 3.8 | 20.12 | U | 0.2 | 0.02 |
| NGC 1097 ring | … | 1* | 58.5 | 21.30 | R | 16.0 | 1.32 |
| NGC 1320 | 2716 | 2 | 2.0 | 20.51 | U | 0.8 | 0.14 |
| NGC 3393 | 3710 | 2 | 23.1 | 21.83 | L | 2.7 | 0.65 |
| NGC 3393 SW peak | … | 2 | 16.0 | 21.67 | U | 0.4 | 0.10 |
| NGC 3393 NE peak | … | 2 | 5.0 | 21.16 | S | 1.3 | 0.31 |
| NGC 3660 | 3300 | 2 | 0.5 | 20.06 | U | 1.6 | 0.34 |
| NGC 4968 | 3007 | 2 | 13.1 | 21.40 | U | 0.7 | 0.14 |
| NGC 5427 | 2565 | 2 | 2.5 | 20.54 | U | 0.5 | 0.08 |
| NGC 7172 | 2527 | 2 | 11.7 | 21.20 | L | 6.4 | 1.05 |
| NGC 7314 | 1430 | 1.9 | 2.7 | 20.07 | U | 0.5 | 0.05 |
| Object | cz | Type | log P3cm | Radio | LAS | LLS | |
| km/s | Sey | mJy | W Hz-1 | Morp | arcsec | kpc | |
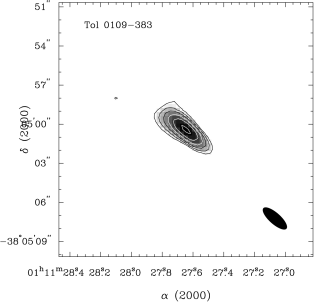
| TOL 0109-383 | 3496 | 2 | 13.5 | 21.54 | S? | 3 | 0.68 |
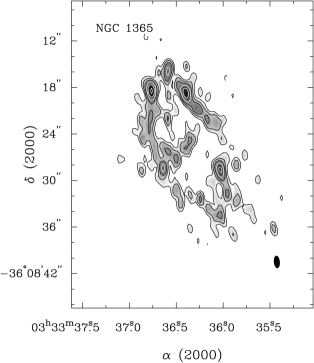
| NGC 1365 | 1662 | 2 | 98.2 | 21.76 | R+L | 20 | 2.15 |
| NGC 1365 “jet” | … | … | … | … | L | 5 | 0.54 |
| NGC 1386 | 924 | 2 | 12.7 | 20.36 | U | 1.5 | 0.09 |
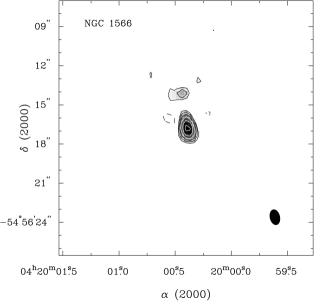
| NGC 1566 | 1496 | 1 | 8.0 | 20.58 | S? | 3 | 0.29 |
| ESO 362-G18 | 3777 | 1 | 3.0 | 20.95 | U | 1.5 | 0.37 |
| IC 2560 | 2873 | 2 | 6.2 | 21.03 | U | 1.5 | 0.28 |
| NGC 3281 | 3460 | 2 | 18.1 | 21.66 | S | 2.0 | 0.45 |
| NGC 3393 | 3710 | 2 | 13.3 | 21.59 | L | 3.0 | 0.72 |
| NGC 3393 SW peak | … | … | 9.3 | 21.43 | … | … | … |
| NGC 3393 NE peak | … | … | 3.3 | 20.98 | … | … | … |
| NGC 3783 | 3208 | 1 | 10.03 | 21.34 | U | 1.5 | 0.31 |
| NGC 4507 | 3957 | 2 | 5.57 | 21.27 | S | 3 | 0.77 |
| TOL 1238-364 | 3292 | 2 | 10.58 | 21.39 | U | 2.0 | 0.43 |
| MCG-6-30-15 | 2248 | 1 | 1.12 | 20.08 | U | 1.5 | 0.22 |
| NGC 5643 | 1199 | 2 | 5.68 | 20.24 | U | 1.5 | 0.12 |
| ESO 137-G34 | 2620 | 2 | 9.84 | 21.16 | L | 4.0 | 0.68 |
| ESO 138-G01 | 2740 | 2 | 7.79 | 21.09 | S | 3.0 | 0.53 |
| NGC 6221 | 1482 | 2? | 14.91 | 20.84 | L | 5.0 | 0.48 |
| NGC 6300 | 1110 | 2 | 2.70 | 19.85 | S | 3.5 | 0.25 |
| IC 5063 | 3402 | 2 | 229.09 | 22.75 | L | 4.2 | 0.92 |
| IC 5201 | 915 | 2 | 0.45 | 18.90 | … | … | |
| NGC 7496 | 1649 | 2 | 6.52 | 20.57 | U | 1.5 | 0.16 |
| NGC 7582 | 1575 | 2 | 49.29 | 21.41 | D | 6 | 0.61 |
| NGC 7590 | 1596 | 2 | 0.9 | 19.69 | … | … |
| Radio Morphology: L = linear; R = ring; D = diffuse; A = ambiguous; S = slightly resolved; U = unresolved. |
| ∗ NGC 1097 is a LINER that periodically shows Sy1-like broad lines (Storchi-Bergmann, Baldwin, & Wilson 1993). |
Most of the resolved sources bear a linear radio structure as is commonly observed in Seyfert nuclei. In NGC 1097 and NGC 1365 we resolve a central, unresolved radio source, apparently related to the AGN, and a ring associated with star forming regions (compare with Hummel, van der Hulst & Keel 1987 and Sandqvist, Jörsäter & Lindblad 1995, respectively). NGC 7582 displays diffuse radio structure. Only two objects of the observed (IC 5201 and NGC 7590) were undetected; both are part of the group observed at 3 cm with ATCA.
Previous observations for 9 of the 29 objects have been reported in the literature by various authors. Where possible we have used these data in combination with our new observations to estimate a radio spectral index, , defined as . We caution that there are inestimable uncertainties in the spectral indices for extended sources owing to differences in the coverage between our observations and those in the literature. Nevertheless, the indices are accurate for unresolved sources and otherwise provide a sense of the spectral shape for the extended sources.
In the next section we discuss each source individually and also summarize relevant radio and optical observations available in the literature. Where possible, the flux at 20 cm (1.4 GHz), and the Parkes-Tidbinbilla interferometer (PTI) flux measurements at 13 cm (2.3 GHz) taken from literature, are listed. The PTI observations have an effective resolution of 1, much higher that the data presented in this paper. The main information we can derive from PTI observations is whether a compact radio structure (1) is present. Where possible we compute spectral indices between 20 and 6 cm () and between 6 and 3 cm (), and compare with previously reported values.
Our snapshot observations are insensitive to structures larger than 15–18 arcsec, or around 4 kpc at the redshift limit of this survey. The observations therefore resolve out diffuse emission from galaxy disks, but we remain sensitive to radio emission from compact star-forming regions. An interesting result of this survey is that star-forming rings are not common. Only NGC 1097 and NGC 1365 display starburst rings, similar to the one observed in NGC 1068, for example, even though our observations would have detected and resolved such rings out to the redshift limit of the survey. Otherwise the radio structures resolved by this survey resemble the classic linear radio structures commonly observed in Seyfert nuclei, and we assume that these structures are jets powered by the AGN. Of course, we are unable to distinguish jets and compact nuclear starbursts in unresolved sources, corresponding to linear scales pc at the redshift limit of the survey.
3.1 Notes on individual sources
TOL 0109-383 (NGC 424):
This object has been observed by Ulvestad & Wilson (1989) at 20 and 6 cm. With
″ resolution they found a slightly extended source with
flux of 22.3 mJy at 20 cm, and 14.9 mJy at 6 cm. In our data we also
find a structure that is slightly extended to the east (Fig.5), although the
very elongated beam of our observations make this very uncertain. Ulvestad & Wilson (1989)
found that the dominant component has a flat spectrum with a spectral
index between 20 and 6 cm of . Our 3 cm
measurement shows that the spectrum remains flat between 6 and 3 cm,
.
NGC 1097:
Originally classified as a LINER by the optical emission-line
spectrum, the recent appearance of broad Balmer-line emission and a
featureless blue continuum implies that it has a Seyfert 1 nucleus
(Storchi-Bergmann, Baldwin, & Wilson 1993). The radio structure
(Fig. 1) comprises an unresolved point source and the well-known
star-forming ring. A detailed radio study of this object was
performed by Hummel, van der Hulst & Keel (1987) and shows an overall steep spectrum
( between and ) and an inverted spectrum () for the nuclear component. The flux of the nucleus measured
from our data is very similar to that found by Hummel, van der Hulst & Keel (1987).
An upper limit to the core flux ( mJy) has been obtained
from PTI observations by Sadler et al. (1995, hereafter S95).
NGC 1365:
This is a well known southern barred galaxy. It was observed in the
radio continuum (20, 6 and 2 cm) by Sandqvist, Jörsäter & Lindblad (1995, hereafter
SJL95). As in SJL95, our map (Fig. 6) shows a ring of emission with
angular dimensions . This ring-like
emission is similar to that found in NGC 1097. SJL95 also identify
the existence of a jet-like structure originating from the nucleus and
about long in position angle (PA) (i.e., aligned
with the minor axis of the galaxy). We observe a similar structure in
our map. The detailed study of the spectral data (SJL95) indicate
that both the jet and the nucleus have a steep spectral index. This
jet-like feature appears to be aligned with the axis of the ionized
gas. NGC 1365 has also been observed with the PTI at 13 cm (
resolution) by Roy et al. (1994) (hereafter R94) and S95
in which a 4 mJy component was detected. This object has been
extensively studied in H I by Jörsäter & van Moorsel (1995).
NGC 1320 (Mrk 607):
This object is unresolved in our VLA observations. PTI observations
place an upper limit of mJy on the compact flux density at
13cm (R94).
NGC 1386:
Ulvestad & Wilson 1984b observed this object at 20
and 6 cm. In their observations, NGC 1386 is barely resolved with an
extension to the southwest (PA=), and it is unresolved in
our 3.5 cm map. Ulvestad & Wilson 1984b give a flux density of 13 mJy and 23.0 mJy at 6
and 20 cm, respectively, and a spectral index of . The spectral index between 6 and 3cm is very flat,
. PTI observations find a flux density of 4 mJy
at 13 cm (R94, S95).
NGC 1566:
A possible faint blob of radio emission is detected 3″ north of
central peak (Fig. 7). Observations with the PTI at 13cm (R94 and S95) give
a 5 mJy flux.
ESO 362–G18 : This object is not resolved by our
observations. PTI observations give an upper limit of mJy on
the flux density at 13 cm (R94). ESO 362–G18 has been studied in
[O III] 5007and H by Mulchaey et al. (1996).
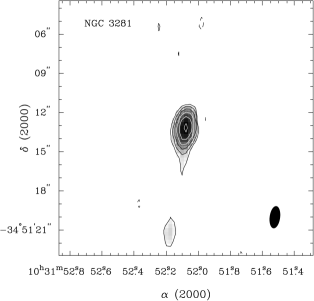

NGC 3281: This object is possibly barely resolved (along the
north-south direction) in our data (Fig. 8), and was not resolved by Ulvestad & Wilson (1989).
Ulvestad & Wilson (1989) find a flux of 61.2 mJy at 20 cm and 26.7 mJy at 6 cm which gives
a steep spectral index of . Our observations
show that the spectral index remains steep out to 3 cm, ().
NGC 3393: This object was observed with both the VLA and ATCA.
The two radio maps are very similar and show a double structure. Here
we show only the VLA map (Fig. 2), which has a slightly better beam
shape. From the two frequencies we derive a spectral index of
for the NE side and for the SW side. The
NLR is elongated along a similar position angle as the radio –
PA PA – with a close
correspondence to the radio morphology. This is very clear in the HST
image (Pogge 1997) which shows a spectacular S-shape morphology. A
core of 16 mJy was detected with the PTI at 13 cm (R94).
NGC 3660: This object is unresolved in our observations. The
source was previously detected by the Effelsberg 100m telescope (Kollatschny et
al. 1983). The total flux measured in our observation (0.5 mJy) is much
smaller than that reported by Kollatschny et al. (11 mJy). The reason for
this discrepancy is likely to be the presence of other two bright unrelated
sources in the field. These sources could not be separated from NGC 3660 by
the 100m telescope but they are in our VLA data.
NGC 3783:
The object is unresolved in our 8 GHz observations and was also
reported unresolved by Ulvestad & Wilson 1984b who give a flux density of 13 mJy at 6 cm.
A spectral index of is derived from Ulvestad & Wilson 1984b and our
flux measurements. An upper limit ( mJy) was obtained from the
PTI observations at 13 cm (R94).
NGC 4507: In our 3 cm data, this object is slightly extended
along PA (Fig. 9). This face-on galaxy shows an high
excitation NLR with a fairly symmetric edge-brightened bicone shape.
TOL 1238–364 (IC 3639):
In our 3 cm map the source is unresolved. TOL 1238–364 object was observed
at 20 and 6 cm by Ulvestad & Wilson (1989). At 20 cm the source appears to have a diffuse
emission around a relatively strong core. At 6 cm only the core of
the source was detected. Ulvestad & Wilson (1989) find a 6 cm flux of 13.6 mJy which
combined with our data gives a spectral index of .
A core of 13 mJy was detected with the PTI at 13 cm (R94).
NGC 4968:
This object is unresolved in our observations. A core of 10 mJy has
been detected with the PTI at 13 cm (R94).
MCG-6-30-15:
This is an unresolved and barely detected object. Ulvestad & Wilson 1984b reported a flux
density of 1 mJy at 6 cm and 1.7 at 20 cm, giving a spectral index of
. The flux density from our observations give an
inverted spectral index at high frequencies . The upper
limit to the flux with the PTI is mJy at 13 cm (R94).
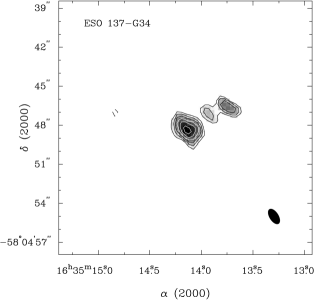
ESO 137-G34: This is a low-surface brightness spiral
classified as Seyfert 2. The radio morphology (Fig. 10) consists of
three knots aligned along PA. The
ionized gas has an S-shape morphology within a larger scale bi-cone.
The radio emission is coincident with the inner (linear) part of the
line-emitting gas.
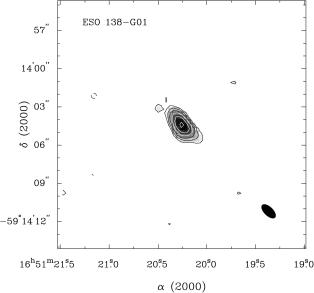
ESO 138-G01: This is a Seyfert 2 nucleus residing in early
type host galaxy. The radio emission (Fig. 11) is possibly elongated in
PA. The NLR has a jet-like morphology elongated
PA The radio emission is also misaligned by with respect to the major axis of the galaxy.
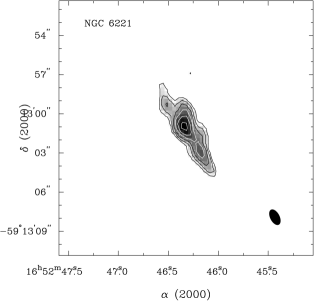
NGC 6221: We resolve a radio triple (see Fig.12) aligned along
PA. The upper limit to the core flux
with the PTI at 13 cm is mJy (S94).
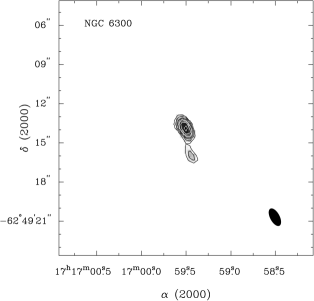
NGC 6300: The radio morphology (Fig. 13) of this object is
slightly elongated.
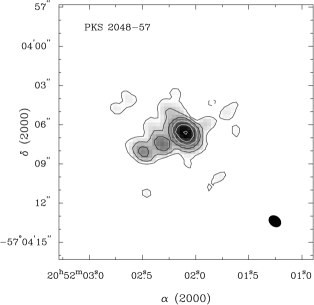
IC 5063 (PKS 2048-57): This is an early-type galaxy hosting a
Seyfert 2 (Colina, Sparks & Macchetto 1991). Its radio luminosity is
nearly 100 times larger than typical values for nearby Seyferts. Our
ATCA radio map (Fig. 14, see also Morganti, Oosterloo & Tsvetanov
1998) resolves a linear radio structure comprising three compact
features aligned along PA. The spectral
index is steep: (Danziger, Goss & Wellington
1981). The optical line-emitting gas traces an X-shape
(Morganti et al. 1998), and the radio emission coincides with the
inner part of the line emitting region. Recent H I observations with
ATCA and VLBI reveal a well defined H I disk aligned with a
morphologically similar system of dust lanes (Morganti, Oosterloo &
Tsvetanov 1998, Oosterloo et al. 1998). PTI observations measure a
flux of 140 mJy at 13 cm and 10 mJy at 3 cm Slee et al (1994).
NGC 7172:
This object has a linear radio structure (Figs. 3 and 4) which is
elongated roughly east-west (PA). A 13 cm core
flux of 3 mJy has been detected with the PTI (R94).
IC 5201:
This source is undetected in our observations. An upper limit
mJy has been obtained from PTI observations at 13 cm (S94).
NGC 7496:
This source is unresolved by our observations. A core flux of 7 mJy
has been detected with the PTI at 13 cm (R94).
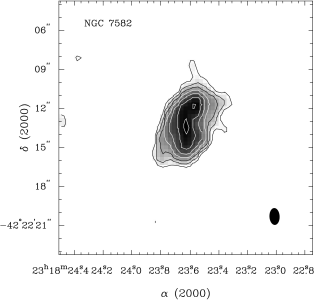
NGC 7582:
Ulvestad & Wilson 1984b detected a weak core surrounded by an extended emission. They
measure 69 mJy at 6 cm and 166 mJy at 20 cm, giving a spectral index
of . We find (Fig. 15) that the spectral index remains steep
out to 3 cm with . For comparison, the NLR is a
good example of an edge-brightened, wide angle bi-cone with a cone
axis projected along PA. In addition, the
host galaxy has a prominent bar along PA. An
upper limit to the flux density of mJy has been set by the PTI
observations (S95, R94).
NGC 7590:
This object is not detected in our data; the upper limit to the flux
density from PTI is mJy at 13 cm (R94).
Table 4. Radio Parameters from the Literature
| Object | cz | Sey | log | Radio | Size | Ref. | |
|---|---|---|---|---|---|---|---|
| km/s | Type | mJy | W Hz-1 | Morph. | kpc | ||
| NGC 2639 | 3336 | 1 | 54.5 | 22.11 | L | 0.41 | 4 |
| NGC 3227 | 1157 | 1 | 34.0 | 20.99 | S | 0.30 | 3 |
| NGC 3516 | 2649 | 1 | 4.3 | 20.81 | U | 0.05 | 3 |
| NGC 3786 | 2678 | 1 | 3.4 | 20.72 | S | 0.28 | 3 |
| NGC 4051 | 725 | 1 | 6.0 | 19.83 | L-D? | 0.57 | 3 |
| NGC 4151 | 995 | 1 | 125.0 | 21.42 | L | 0.34 | 3, 5 |
| NGC 4235 | 2410 | 1 | 5.3 | 20.82 | U | 0.05 | 3 |
| NGC 4253 | 3876 | 1 | 19.5 | 21.80 | U | 0.35 | 4 |
| NGC 4593 | 2698 | 1 | 1.6 | 20.40 | U | 0.04 | 3 |
| NGC 5033 | 875 | 1 | 3.3 | 19.73 | U | 0.02 | 4 |
| NGC 5273 | 1054 | 1 | 0.9 | 19.33 | S | 0.10 | 3 |
| NGC 6814 | 1563 | 1 | 2.2 | 20.06 | S | 0.03 | 3 |
| 0714-2914 | 1630 | 2 | 28.2 | 21.20 | L | 0.55 | 4 |
| 0942+0950 | 3897 | 2 | 0.4 | 20.11 | U | 0.10 | 4 |
| Mrk 3 | 4050 | 2 | 361.0 | 23.10 | L | 0.58 | 2, 6 |
| Mrk 270 | 2700 | 2 | 5.7 | 20.95 | L | 0.61 | 2 |
| Mrk 348 | 4540 | 2 | 480.0 | 23.32 | L | 0.06 | 2, 7 |
| Mrk 1066 | 3605 | 2 | 35.5 | 21.99 | L | 0.70 | 4 |
| NGC 0591 | 4547 | 2 | 7.9 | 21.54 | L | 0.18 | 4 |
| NGC 0788 | 4078 | 2 | 1.2 | 20.63 | U | 0.08 | 4 |
| NGC 1068 | 1136 | 2 | 1090.0 | 22.48 | L | 1.43 | 1, 8 |
| NGC 1358 | 4013 | 2 | 1.2 | 20.62 | S | 0.10 | 4 |
| NGC 1667 | 4547 | 2 | 1.0 | 20.64 | S | 0.12 | 4 |
| NGC 1685 | 4527 | 2 | 5.3 | 21.37 | S | 0.12 | 4 |
| NGC 2273 | 1840 | 2 | 19.0 | 21.14 | L | 0.24 | 3 |
| NGC 3081 | 2385 | 2 | 0.9 | 20.04 | U | 0.06 | 3 |
| NGC 3982 | 1109 | 2 | 2.2 | 19.76 | U | 0.03 | 4 |
| NGC 4117 | 871 | 2 | 0.6 | 18.99 | S | 0.08 | 4 |
| NGC 4388 | 2524 | 2 | 76.0 | 22.02 | L | 3.92 | 3 |
| NGC 4941 | 1108 | 2 | 4.3 | 20.05 | S | 0.10 | 3 |
| NGC 5135 | 4112 | 2 | 58.8 | 22.33 | A | 1.97 | 4 |
| NGC 5347 | 2335 | 2 | 2.2 | 20.41 | U | 0.06 | 4 |
| NGC 5695 | 4225 | 2 | 0.5 | 20.28 | U | 0.38 | 4 |
| NGC 5728 | 2788 | 2 | 4.6 | 20.88 | L? | 2.34 | 3, 9 |
| NGC 5929 | 2561 | 2 | 24.7 | 21.54 | L | 0.18 | 3, 10 |
| NGC 6890 | 2419 | 2 | 4.2 | 20.72 | U | 0.06 | 4 |
| NGC 7450 | 3191 | 2 | 1.7 | 20.57 | L? | 0.62 | 3 |
| NGC 7672 | 4117 | 2 | 1.0 | 20.56 | L | 1.86 | 4 |
| Tol 0074 | 3285 | 2 | 13.6 | 21.50 | D | 0.09 | 4 |
| MCG-5-23-16 | 2482 | 2 | 6.0 | 20.90 | S | 0.08 | 3 |
| NGC 2110 | 2284 | 2 | 175.0 | 22.29 | L | 0.87 | 3 |
| NGC 2992 | 2311 | 2 | 77.0 | 21.94 | L-D? | 1.36 | 3, 11 |
| NGC 5506 | 1853 | 2 | 160.0 | 22.07 | S | 0.65 | 3 |
References: (1) Wilson & Ulvestad (1983); (2) Ulvestad & Wilson 1984a; (3) Ulvestad & Wilson 1984b; (4) Ulvestad & Wilson 1989; (5) Pedlar et al. 1993; (6) Kukula et al. 1993; (7) Neff & de Bruyn 1983; (8) Gallimore et al. 1996; (9) Schommer et al. 1988; (10) Su et al. 1996; (11) Wehrle & Morris 1988
4 Discussion
The new radio observations presented in this paper cover more than 50% of our southern () volume limited ( km s-1) sample of Seyfert galaxies; adding data from the literature increases the coverage to almost 85%. There remain 9 sources in the southern sample for which radio information at arcsec resolution is not available yet.
Our survey largely overlaps with the samples studied by Ulvestad & Wilson 1984b and Ulvestad & Wilson (1989). We do not, therefore, expect results completely independent from theirs. We note, however, that the sample of Ulvestad & Wilson contained all Seyferts with km s-1 known at the time of their observations ( years ago), and was declination-limited by the VLA horizon restrictions. Our sample, on the other hand, covers all Seyferts with reliable classification to date at southern declinations () and increases the distance-limited sample of Ulvestad & Wilson (1989) by 22%.
However, in order to further improve the statistics, we have collected additional sources from the literature, consisting of known Seyferts with km s-1, derived mainly from Ulvestad & Wilson (1989) and references therein. The selected sources are listed in Table 4. For this compilation, we selected only radio data of similar observing frequency and resolution to our observations (–1″). Most of the collected data were obtained at 6 cm. The combined sample includes 71 objects of which 17 are Seyfert 1’s and 54 Seyfert 2’s.
Here we concentrate on the discussion of the radio characteristics of the studied sample. A discussion on the comparison between the radio and optical properties will be done in a forthcoming paper.
4.1 Radio Spectra
We derived the spectral indices for most of our sources by combining our data with previous observations (see 3.1). The exception is NGC 3393, for which we use the 3 and 6 cm data presented here. In three cases (NGC 1097, NGC 1365 and IC 5063), we are unable to estimate the spectral index owing to complex source structure and poor matches in coverage. For NGC 1097 and NGC 1365 detailed studies of the spectral indices are already available (Hummel, van der Hulst & Keel 1987; Sandqvist, Jörsäter & Lindblad 1995 respectively).
In three cases (NGC 7582, NGC 3281 and Tol 0109-383) we find that the spectral index at high frequencies (, between 3 and 6 cm) is similar to the value at lower frequencies (); that is, the spectra are steep in the first two cases, and flat for Tol 0109-383. In two cases (MGC-6-30-15 and NGC 1386) the spectra appear to flatten with increasing frequency (), although the radio source in MGC-6-30-15 is very weak, and the derived spectral index is uncertain. New spectral indices have been derived for NGC 3393, NGC 3783 and Tol 1238-364: in all these cases the spectral index is steep (). For comparison, most of the Seyfert galaxies have steep radio spectra, but flat-spectrum cores are found in a few Seyferts (Wilson 1991).
Accepting uncertainties in our spectral index measurements due to mismatched coverage in the 3 and 6 cm maps, we measure a median spectral index steep () for our Seyfert nuclei. This result is in agreement, with the spectral indices of the inner nuclear regions of spirals (and Seyferts) as measured by Sadler et al. (1995) using PTI observations. Their investigation of the compact radio cores in spiral and elliptical galaxies found a median spectral index for spirals (and Seyferts) of , and that spirals usually have steeper core spectra than do elliptical galaxies (median spectral index ). The flat (or inverted) spectral index of the cores is a typical characteristic of elliptical galaxies found on all scales in which the nuclear regions have been observed (from arcsec and sub-arcsec scale, see e.g. Morganti et al. 1997 and Slee et al. 1994 to VLBI scale). Thus, our study confirms the result that the spectral indices of Seyferts are much steeper than in the cores of ellipticals, and that the spectral index remains close to the same value over to 1″ scales.
In connection with this difference in spectral index, it is worth remembering that the nuclear regions of Seyfert galaxies appear to have a more complicated situation than in radio galaxies: following the detailed studies of few well objects (e.g. NGC 1068, Gallimore et al. 1996, Roy et al. 1998; NGC 4151 Ulvestad et al. 1998) free-free absorption appears to be relevant in Seyfert to dim the ”real” radio core. Thus the nuclear emission (and its spectral index) can be dominated not by the core itself but by bright blobs. This would be in agreement with the finding (Sadler et al. 1995) that in ellipticals most of the radio emission in the central kpc comes from the parsec-scale core, while in Seyferts this is only a small fraction (10-25%).
4.2 Radio Structure
Table 3 summarizes the classification of the radio morphology for the newly observed objects, following the scheme of Ulvestad & Wilson 1984b . Table 4 provides source classifications for data taken from the literature. Including Seyferts from the literature, we find 38% of the sample are unresolved sources, 23% have slightly resolved structures and 34% have linear structure at arcsecond resolution; the remaining 5% have diffuse, amorphous, or ringed structures.

We can compare these numbers with the results from Ulvestad & Wilson (1989) and references therein (see also the summary in Wilson 1991). Compared to Wilson (1991), we measure a higher fraction of unresolved sources and a lower fraction of galaxies with diffuse radio emission. This result may be due to an observational bias; our observations are not as sensitive to diffuse, extended, steep spectrum emission as are the 20 cm VLA observations of, e.g., Ulvestad & Wilson (1989). Otherwise, we measure a similar detection fraction of linear or slightly resolved structures.
Linear radio sources in Seyfert galaxies generally trace radio outflows, but it is worth checking that linear radio emission is not associated with star formation in an edge-on galaxy. Among the linear radio sources detected in this survey, only the host galaxy NGC 7172 is near edge-on. The radio structure aligns with the plane of the host galaxy, casting doubt on a jet origin; rather, it appears that the linear radio source of NGC 7172 may be associated plausibly with a nuclear starburst. Otherwise, the remaining linear radio sources are more likely associated with an AGN-driven outflow.
To compare the distributions of radio power, we adjusted all of the radio luminosities to their 6 cm values. For sources not observed at 6 cm, we adjusted the luminosities using measured spectral indices where possible. For those sources having neither 6 cm measurements or measured spectral indices, we assumed a spectral index of . Many of the low power sources are unresolved, resulting in an upper limit to the source size. Since we are interested in the compact radio emission from jets rather than extended, low surface brightness emission (which may come from star-forming regions and starburst-driven superwinds), we also assumed that the three undetected sources were unresolved (size upper limit) and radio weak (flux upper limit). To account appropriately for these limits, we employed survival analysis techniques from the ASURV package (Feigelson & Nelson 1985; Isobe, Feigelson, & Nelson 1986) as it is implemented in IRAF.
We confirm a correlation between radio power and size (Fig. 16), originally discussed by Ulvestad & Wilson (1984b) and Giuricin et al. (1990). Both the power-size and flux-angular size correlations are significant at better than 1% (probability of no correlation) according to the traditional survival analysis tests (Kendall’s , Spearman’s , and the Cox Proportional History model). A summary of log-linear models for the power-size correlation is provided in Table 5. Comparing with the results of Ulvestad & Wilson 1984b , we find a steeper slope in the correlation owing to a proper treatment of limits at low radio-powers. Mrk 348 is an outlier, falling at relatively small size for its radio power. The present analysis ignores the kiloparsec radio lobes in this source, which may arise from either a starburst-driven superwind, or old nuclear-driven ejecta. Accounting for the extended radio lobes places Mrk 348 closer to the best-fit line, except that Mrk 348 now falls somewhat oversized for its luminosity according to the correlation.
Table 5. Log-linear fit to Radio Power vs. Size
| Method | Intercept | Err | Slope | Err |
|---|---|---|---|---|
| Buckley-James | -11.36 | … | 0.51 | 0.09 |
| E-M | -12.31 | 2.25 | 0.55 | 0.11 |
| Schmitt | -12.72 | 2.20 | 0.56 | 0.10 |


4.3 A Comparison of Seyfert 1s and 2s
Previous radio studies of volume-limited samples of Seyfert galaxies find: a) marginal or no statistically significant difference between the distributions of radio luminosities of Seyfert 1s and 2s; b) Seyfert 2’s galaxies tend to have a larger radio sources than Seyfert 1s, although at % significance level; c) the two types of Seyferts have essentially the same distribution of spectral indices (Giuricin et al. 1990, Rush et al. 1996) although there seems to be some evidence that flat spectrum cores are more common in Seyfert 1s than in Seyfert 2s (Ulvestad & Wilson (1989)); and d) compact radio cores (on the sub-arcsec scale) are more common in Seyfert 2s than in Seyfert 1s (R94).
Examining first the distribution of spectral index (see histograms in Fig. 17), we find a median value for the spectral index ( or ) of for Seyfert 1s and for Seyfert 2s. However, the two distributions are not significantly different under a Kolmogorov-Smirnov test (13% probability that the two distributions are not different). Unfortunately, we have too few Seyfert 1’s with measured spectral indices to compare the frequency of flat-spectrum cores.
We also compared the distribution of radio sizes and powers (see histograms in Figs. 18 and 19 respectively) of Seyfert 1 and Seyfert 2 galaxies. To improve the fairness of the comparison, we only included sources out to a redshift of km s-1, at which the redshift distributions of Seyferts 1 and 2 matched according to a K-S test. At marginal significance, we find that Seyfert 2 radio sources tend to be more luminous than Seyfert 1 radio sources; the probability that Seyferts 1 and 2 arise from the same parent distribution is for most two-sample tests, for the logrank test. Ulvestad & Wilson (1984a) found a similar result for Markarian Seyferts, but they showed in a follow-up paper (Ulvestad & Wilson (1989)) that the significance is reduced owing to the paucity of low-luminosity Seyfert 2s in the Markarian sample. Inspection of the power-size diagram (Fig. 12) suggests that any significance in the difference of radio powers owes to a handful of luminous Seyfert 2s, but most Seyferts 1 and 2 have comparable radio powers. Formally, we measure mean log radio powers of for Seyfert 2s, and for Seyfert 1s.
In contrast, we measure a significant difference in radio sizes. All of the two-sample tests report a difference in parent populations to a significance of , with the exception of the logrank test, which is significant only to 87%. Seyfert 2s tend to be larger, with a mean size of kpc, compared to Seyfert 1s, mean size kpc. The errors on the mean sizes represent the dispersion in the intrinsic value. Given the statistical agreement in the distribution of radio powers, it is natural to interpret the size difference in terms of an orientation unifying scheme. The prediction of this model is the nuclear axes of Seyfert 1s are viewed more nearly pole-on, and so radio jets are foreshortened by projection.
5 Conclusions
We have presented VLA 6 cm and ATCA 3.5 cm radio data for 29 southern Seyfert galaxies selected from a volume limited sample ( km s-1). The resolution of the observations is about ″, similar to that of the ground-based, optical narrow band images. The new radio observations presented in this paper cover more than 50% of our southern () volume limited ( km s-1) sample of Seyfert galaxies. When data available from the literature are added the coverage improves to greater than 80%. Only 2 of the 22 newly observed sources are undetected in our radio observations. Including data from the literature, we find 38% of the distance-limited sample is unresolved at arcsecond resolution, and most of the resolved objects (34% of the sample) show, as expected, a linear structure.
Statistical comparisons are consistent with the picture that Seyferts 1 and 2 arise from the same parent population of AGN, but the radio jets of Seyfert 1 galaxies are smaller in projection owing to their orientation. This model is not contrary to the power-size correlation, but, conversely, projection effects add noise to the measured correlation. An additional prediction is that, binned in radio power, Seyfert 1s should be smaller than Seyfert 2s. Unfortunately, owing to the small number of sources per decade in radio power and the large number of limits at low radio power, we are unable to test this prediction with the current sample.
Acknowledgements.
MA acknowledges the support of an Australian Post-Graduate Research Award (APRA). This research has made use of the NASA/IPAC Extragalactic Database (NED) which is operated by the Jet Propulsion Laboratory, Caltech, under contract with NASA.References
- (1) Baars, J. W. M., Genzel R., Pauliny-Toth I. I. K., Witzel A. 1977, A&A, 61, 99
- Capetti et al. (1996) Capetti, A., Axon, D. J., Macchetto, F., Sparks, W. B., Boksenberg, A. 1996, ApJ 469, 554
- (3) Colina, L., Sparks, W.B. & Macchetto, F. 1991, ApJ 370, 102
- (4) de Bruyn, A. G., & Wilson, A. S. 1978, A&A, 64, 433
- (5) Danziger, J.I., Goss, W.M. & Wellington, K.J. 1981, MNRAS 196, 845
- Edelson (1987) Edelson, R. A. 1987, ApJ, 313, 651
- Feigelson & Nelson (1985) Feigelson, E.D., & Nelson, P.I., 1985, ApJ, 293, 192
- (8) Gallimore, J.F., Baum, S.A., O’Dea, C.P., & Pedlar, A. 1996a, ApJ, 458, 136
- (9) Gallimore, J.F., Baum, S.A. & O’Dea, C.P. 1996b, ApJ, 464, 198
- (10) Giuricin G., Mardirossian F., Mezzetti M., Bertotti G. 1990, ApJ, 72, 551
- (11) Haniff, C. A., Wilson, A. S., & Ward, M. J. 1988, ApJ, 334, 104
- (12) Hummel, E., van der Hulst, J. M., Keel, W. C. 1987, A&A, 172, 32
- Isobe, Feigelson, & Nelson (1986) Isobe, T., Feigelson, E.D., & Nelson, P.I. 1986, ApJ, 306, 490
- (14) Jörsäter, S., van Moorsel, G. A. 1995, AJ 110, 2037
- (15) Kollatschny, W., Fricke, K.J., Biermann, P., Huchtmeier, W. & Witzel, A. 1983, A&A 119, 80
- (16) Kukula, M.J., Ghosh, T., Pedlar, A., Schilizzi, R.T., Miley, G.K., de Bruyn, A.G., & Saikia, D.J. 1993, MNRAS, 264, 893
- Meurs & Wilson (1984) Meurs, E. J. A., & Wilson, A. S. 1984, A&A, 136, 206
- (18) Morganti, R., Oosterloo, T.A. & Tsvetanov, Z. 1998, AJ, 115, 915
- (19) Morganti, R., Oosterloo, T.A., Reynolds, J., Tadhunter, C.N., Migenes, V. 1997, MNRAS, 284, 541
- (20) Mulchaey, J.S., Wilson, A.S. & Tsvetanov, Z. 1996, ApJS, 102, 309
- (21) Muxlow, T.W.B., Pedlar, A., Holloway, A.J., Gallimore, J.F., Antonucci, R.R.J. 1996, MNRAS 278, 854
- (22) Neff, S.G., & de Bruyn, A.G. 1983, A&A 128, 318;
- (23) Oosterloo, T., Morganti, R., Tzioumis, A., Reynolds, J. & Tsvetanov, Z. 1998, in IAU 164 Zensus A., Wrobel J.M., Taylor G.B. 1998 p.197
- (24) Pedlar, A., Kukula, M.J., Longley, D.P.T., Muxlow, T.W.B., Axon, D.J., Baum, S., O’Dea, C., & Unger, S.W. 1993, MNRAS, 263, 471
- Pogge (1989) Pogge, R. W. 1989, ApJ, 345, 730
- Pogge (1997) Pogge, R. W. 1997, in “Emission Lines in Active Galaxies: New Methods and techniques”, eds. B. M. Peterson, F.-Z. Cheng and A. S. Wilson, ASP Conf. Series, 113, 378
- Reynolds (1996) Reynolds, J.E. 1996 in “Australia Telescope Compact Array User’s Guide” eds. W.M.Walsh & D.J. McKay
- Roy et al. (1994) Roy, A. L., Norris, R. P., Kesteven, M. J., Troup, E. R., Reynolds, J. E. 1994, ApJ, 432, 496 (R94)
- (29) Roy, A. L., Colbert, E.J., Wilson, A.S. & Ulvestad, J.S., 1998, ApJ, 504, 147
- (30) Rush, B., Malkan, M.A., Edelson, R.A. 1996, ApJ 473, 130
- Sault, Teuben & Wright (1995) Sault, R. J., Teuben, P. J., Wright, M. C. H. 1995, in Astronomical Data Analysis Software and Systems. IV, eds. R. Shaw, H.E. Payne and J.J.E. Hayes, ASP Conf. Series, 77, 433
- (32) Sadler, E. M., Slee O. B., Reynolds, J. E., Roy, A. L. 1995, MNRAS 276, 1373 (S95)
- (33) Sandqvist, A., Jörsäter, S., & Lindblad, P. O. 1995, A&A, 295, 585
- (34) Schommer, R.A., Caldwell, N., Wilson, A.S., Baldwin, J.A., Phillips, M.M., Williams, T.B., Turtle, A.J. 1988, ApJ, 324, 154
- (35) Slee, O. B., Sadler, E. M., Reynolds, J. E., Ekers, R. D. 1994, MNRAS, 269, 928
- (36) Storchi-Bergmann, T., Baldwin, J.A., & Wilson, A.S. 1993, ApJ 410L, 11
- (37) Su, B.M., Muxlow, T.W.B., Pedlar, A., Holloway, A.J., Steffen, W., Kukula, M.J., & Mutel, R.L. 1996, MNRAS, 279, 1111
- (38) Tsvetanov, Z., Morganti, R., Fosbury, R.A.E., Allen, M.G., Gallimore, J. 1998, in “Looking Deep in the Southern Sky”, ESO/Australia workshop, Morganti & Couch eds., Springer, p.248
- (39) Ulvestad, J.S. & Wilson, A.S. 1984, ApJ, 278, 544
- (40) Ulvestad, J.S. & Wilson, A.S. 1984, ApJ, 285, 439
- Ulvestad & Wilson (1989) Ulvestad, J.S. & Wilson, A.S. 1989, ApJ, 343, 659
- (42) Ulvestad, J.S., Roy, A., Colbert, J.M. & Wilson, A.S. 1998, ApJ, 496, 196
- (43) Wehrle, A.E. & Morris, M., 1988, AJ 95, 1689
- (44) Whittle, M., Pedlar, A., Meurs, E.J.A., Unger, S.W., Axon, D.J. & Ward, M.J. 1988 ApJ 326, 125
- (45) Whittle, M. 1989, in Extranuclear Activity in Galaxies eds. E.J.A. Meurs and R.A.E. Fosbury, ESO Conf Proc. No.32, 199
- (46) Wilson, A.S. & Ulvestad J.S., 1983, ApJ 275, 8
- (47) Wilson, A.S., Ward, M.J. & Haniff, C.A. 1988 ApJ 334,121
- Wilson & Ulvestad (1987) Wilson, A.S. & Ulvestad J.S., J.S. 1987, ApJ, 319, 105
- (49) Wilson A.S. & Tsvetanov Z. 1994, AJ, 107,1227
- (50) Wilson, A. S. 1991, in “The interpretation of Modern Synthesis Observations of Spiral Galaxies” eds. N.Duric & P.C. Crane, ASP Conf. Series Vol.18, p227