1 Introduction
The lower part of the classical instability strip and the surrounding main sequence are populated by a large variety of pulsating variable stars. In the past years a great effort was made by the stellar group of Brera Observatory (E. Antonello, M. Bossi, L. Mantegazza, E. Poretti, F.M. Zerbi) to collect a large amount of photometric and spectroscopic data on Sct stars, the more numerous class. Observations were carried out using the telescopes located in Merate (0.50 m and 1.02 m; a third telescope having a diameter of 1.32 m will be available in the near future) and in La Silla (European Southern Observatory, Chile; we used the 0.50 m, 0.90 m, 1.0 m to make the photometric observations, the 1.4-m CAT for the spectroscopic ones).
In this paper I will describe our approach to the study of Sct stars and some results we obtained; the reader can find other related aspects in the contributions written by F.M. Zerbi in this volume. As a first step, in Sect. 2.1 I show as the light curves of high–amplitude Sct stars can be described in a synthetic and powerful way by using the Fourier decomposition. In Sect. 2.2 some interesting cases are presented, i.e. the peculiar light curves of some double–mode pulsators and the multiperiodicity of V974 Oph. As regards the small amplitude Sct stars, the results which can be extracted from the photometry and (high-resolution) spectroscopy are discussed in Sect. 3; the importance of combining the two techniques into the synergic approach is stressed. As a final step, an excursus on the Dor stars is presented in Sect. 4; the rich pulsational content makes these stars very similar to Sct variables.
The Sct class (DSCT in the GCVS notation) contains now most of the stars previously classified as Sct, SX Phe, AI Vel, RRs variables. The only separation now maintained is between Population I (i.e. DSCT stars) and Population II (i.e. SXPHE stars). The amplitude of the light variation is not considered a physical discriminant and hence both high (up to 0.50 mag) and small (down to the mmag level) amplitude pulsators are included in the DSCT class. For sake of clarity, let us consider separately the two subclasses.
2 The high–amplitude Sct stars
2.1 The Fourier parameters
Most of these variable stars are single–periodic, showing a light curves significatively deviating from a sine shape. In such a case it is possible to fit the measurements by a sum of cosine functions having frequencies (Fourier decomposition) and then to study the particularities of the phase and amplitude parameters (see Poretti, this volume, for the application of this technique to Cepheid light curves).
As a natural extension of this work toward the lower part of the instability strip, Antonello et al. (1986) applied the Fourier decomposition to the light curves of high amplitude (0.20 mag), short period ( 0.35 d) Sct stars, generally considered to be very stable single–mode pulsators. Later, Poretti et al. (1990) continued this study covering all the available sample, actually constituted by 30 stars, i.e. all the objects which could be observed by photoelectric photometry, plus a few stars observed with CCD detectors. A more robust sample is necessary to better investigate some unclear observational facts, still open even considering the output of large–scale projects as MACHO and OGLE:
-
1.
Poretti et al. (1990) suggested a bimodal distribution of the amplitude ratios . The matter is controversial since contradictory results were obtained by Templeton et al. (1998) and by Morgan et al. (1998). From a theoretical point of view, the mechanism which limits the pulsational amplitude is far from being well understood and Fourier plots can get new light on the subject;
-
2.
The progression of the phase differences is well defined, but a change in the slope is observed at P=0.09 d. The observational fact that no first–overtone pulsator was found among high amplitude Sct stars (no sequence similar to that of -Cepheids was found in the plane) need to be confirmed. We remind that overtone pulsators are quite common in small amplitude Sct stars;
-
3.
Poretti & Antonello (1988) discovered some stars showing a descending branch of the light curve steeper than the ascending one (V1719 Cyg variables). The implications on stellar models were stressed by Antonello et al. (1988) and by Guzik (1992), but the physical conditions necessary to generate such a light curve are not yet well established (helium diffusion? resonances?). In the next section the V1719 Cyg light curves will be further discussed.

Recently, well-defined light curves of SX Phe stars belonging to the globular cluster Centauri were decomposed (Poretti 1999). As a result, an excellent overlap between globular and galactic stars exists in the plane (Fig. 1); moreover, some peculiar cases (an anomalous light curve and a group of slightly deviating values) were found (see Poretti 1999 for details).
2.2 Peculiar light curves


Figure 2 shows the light curves of V798 Cyg: the first period (left panel) has a rising branch covering more than half period, owing to a bump clearly visible just after the minimum light. This kind of asymmmetry is quite uncommon in pulsating star light curves (Poretti & Antonello 1988). Respect with to preliminary results described there, it should be noted that new CCD measurements (Musazzi et al. 1998) confirm not only the existence of a second term, but also that its frequency is 6.41 c d-1. This means that =0.80, as happens for the other star showing the same asymmetrical light curve, i.e. V1719 Cyg. The possible link between the double–mode pulsation and asymmetrical light curve deserves further attention in the future.
In Fig. 3 the spectacular light curve of the 17th–mag star V831 Tau is presented: the amplitude is about 0.70 mag and since the period is 92 min, the ascending branch is only 20 min long. It reminds more known and brighter stars as CY Aqr and DY Peg.
Among the high amplitude Sct stars, V974 Oph is an unique case. Its multimode nature became evident after an observing run at the ESO 50–cm telescope in April 1989; Fig. 4 shows an example of the dramatic changes occurring over a short time baseline. Hence, multimode pulsation can be acting also in high amplitude pulsators, not only in small amplitude ones (V974 Oph can reach an amplitude of 0.5 mag in light).

3 The small amplitude Sct stars
3.1 The photometric approach
The photometric and spectroscopic campaigns secured by our group (Tab. 1) are proving that the presence of a rich mixture of simultaneously excited radial and nonradial -mode is quite common among Sct stars. Such a characteristic makes them an ideal tool for asteroseismologic studies. Moreover, since these stars cover a wide range of evolutionary stages, ranging from pre-main-sequence to the giant one, they offer the possibility to probe stellar interiors in very different conditions.
In the small amplitude Sct stars we meet the reverse case respect with to the high amplitude ones: multiperiodicity is quite common and monoperiodicity is rare. Figure 5 shows the light curve of AZ CMi, a remarkable example of small amplitude, monoperiodic Sct star. In the case of a monoperiodic star, also single–site measurements can provide a very useful check of the constancy of the period (see Riboni et al. 1994 for the case of Cas), but also the amplitude needs to be monitored (Poretti et al. 1996). As a matter of fact, the amplitudes of the excited modes are often variable in time, as can be verified by comparing different observing seasons on the same star.
Star Site Observing period N Survey Reference [hours] HD 37819 Merate Jan. 1986 462 32 A&A 1987, 181, 273 HR 1225 ESO Nov. 1987 705 38 A&A 1989, 220, 144 Eri ESO Nov. 1987 710 38 A&A 1989, 220, 144 HR 547 ESO Nov. 1987 462 22 A&A 1989, 220, 144 HD 16439 Merate Dec. 1988–Jan. 1989 1020 54 A&A 1990, 230, 91 HD 16439 Merate Dec. 1994–Jan. 1995 854 63 A&A 1996, 312, 912 HD 101158 ESO Apr. 1989 (phot.) 1234 62 A&A 1991, 245, 136 HD 101158 ESO Apr. 1994 (spectr.) 74 24 A&A 1997, 323, 844 X Cae ESO Nov. 1989 1013 54 A&A 1992, 255, 153 X Cae ESO Nov. 1992 1634 100 A&A 1996, 312, 855 X Cae ESO Nov. 1992 (spectr.) 101 27 A&A 1996, 312, 855 X Cae ESO Nov. 1996 916 99 work in progress X Cae ESO Nov. 1996 (spectr.) work in progress 44 Tau Merate Dec. 1989–Feb. 1990 2434 117 A&A 1992, 256, 113 BI CMi ESO Jan.–Feb. 1991 1390 100 A&A 1994, 281, 66 BI CMi Merate Jan.–Feb. 1991 642 43 A&A 1994, 281, 66 HD 224639 ESO Sept.–Oct. 1991 2567 120 A&A 1995, 299, 427 HD 224639 ESO Oct.–Nov. 1994 1917 71 A&A 1996, 308, 847 HD 224639 Multisite Sept.-Oct. 1995 1252 125 work in progress HD 18878 Merate Nov. 1991–Jan. 1992 2915 150 A&A 1993, 274, 811 HD 19279 Merate Nov. 1991–Jan. 1992 2679 150 A&A 1993, 274, 811 Cas Merate Oct. 1986; Oct. 1992 925 30 A&AS 1994, 108, 55 Cas Asiago Dec. 1993 (spectr.) work in progress FG Vir ESO Apr.–May 1992 792 53 A&A 1994, 287, 95 FG Vir ESO Apr.–May 1992 (spectr.) 22 8 A&A 1994, 287, 95 FG Vir Multisite Apr.–May 1995 435 315 A&A 1998, 331, 271 BF Phe ESO Sept. 1993 832 79 A&A 1996, 312, 912 AZ CMi Merate Jan.–Feb. 1994 307 28 A&A 1996, 312, 912 HD 2724 ESO Sept.-Oct. 1993 884 90 A&A 1998, 336, 518 HD 2724 ESO Sept.-Oct. 1993 (spectr.) 154 34 A&A 1998, 336, 518 HD 2724 ESO Oct. 1997 (spectr.) 189 52 work in progress BV Cir ESO June 1996 work in progress BV Cir ESO June 1996 (spectr.) 118 38 work in progress BV Cir ESO June 1998 (spectr.) 156 48 work in progress
When the star is multiperiodic, it is very complicated to make out the power spectrum owing to the interaction between the excited modes and the spectral window. If measurements are performed from a single site, not only the excited frequency will be detected, but also its aliases (where is an integer number of c d-1). When several frequencies are simultaneously excited, it is not an easy task to correctly separate the true frequencies from the aliases owing to the large number of peaks visible in the power spectra. To simplify the analysis and to proceed to an identification of a large number of excited modes (i.e. to do asteroseismology), it is necessary to deal with a better spectral window and this can be ensured by multisite observations, i.e. carried out at different longitudes; we see above the case of FG Vir.
The key problem is to typify the modes, i.e. to assign the two numbers to each detected frequency. From a photometric point of view, this can be done by calculating the phase shifts between light curves in different colours ( and ). However, the detection of these shifts is a very delicate procedure and observational errors can hamper a reliable determination.
3.2 The spectroscopic approach
An independent promising approach to mode identifications is offered by the study of line profile variations in high resolution spectrograms. Actually, such variability has been detected in Sct stars and powerful techniques for their analysis have been developed. On the basis of spectroscopic data, it is possible to calculate the line moments (Balona 1987; Aerts at al. 1992) and, from the amplitudes and phases of their variations during a pulsation cycle, to estimate
-
•
the degree and the azimuthal number of each pulsation mode;
-
•
the amplitudes and the phases of the velocity fields and temperature variations;
-
•
the inclination of the rotational axis and the equatorial rotational velocity.
This technique is very suitable for low–degree modes and it has been already applied by us to some Sct stars (FG Vir and X Cae), but its full exploitation has been hampered by the lack of an adequate frequency resolution of the moment curves, caused by the too short baseline of observations. Independent constraints on mode typifying and detection of higher degree modes can be obtained from the analysis of the time series of the individual pixels defining the line profiles (Telting & Schrijvers 1997, Mantegazza 1997).
3.3 The synergic approach
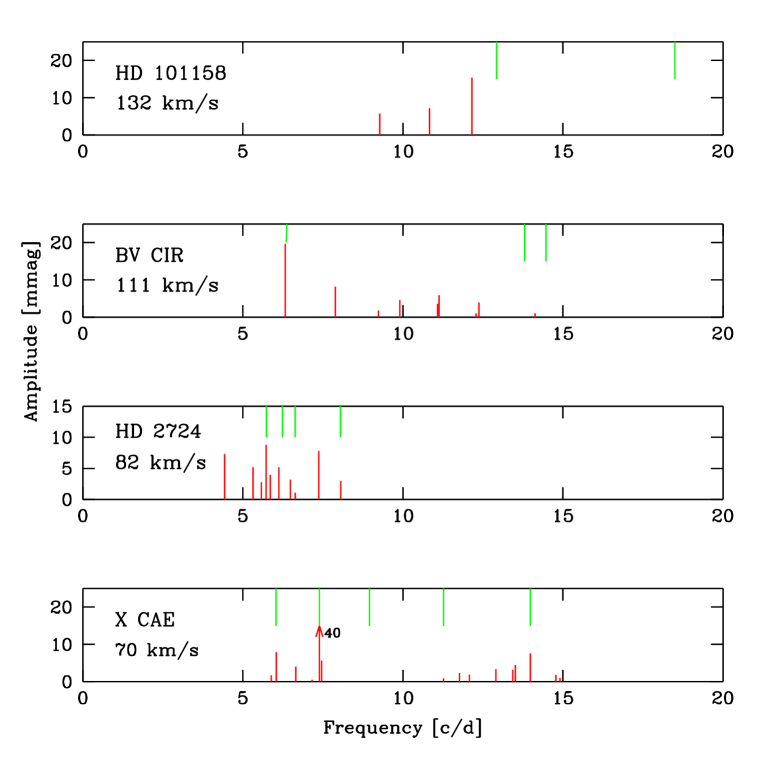
Trying to fill the gap between the outputs of the observations and the inputs necessary for a reliable pulsational model, Bossi et al. (1998) discriminated between different modes through a direct fit of pulsational model to spectroscopic and photometric data, i.e. by applying the synergic approach (see also Zerbi, this volume, for a more detailed discussion). Its importance is stressed by Fig. 6: the two techniques are able to detect different modes excited in the stellar atmosphere of Sct variables and only by combining them we can have a full description of the pulsational content.

We are trying to increase the reliability of the mode identification by improving this technique (these works are marked “in progress” in Tab. 1). As a matter of fact, in the case of HD 2724 (Bossi et al. 1998; Mantegazza & Poretti 1999, in preparation) it was demonstrated as it is possible to obtain constraints on the inclination angle; in such a case a much more reliable mode typifying of the observed modes can be proposed.
3.4 FG Vir
The recent results indicates that, due the very complex phenomenology of Sct stars (Fig. 6 is again an excellent example), a good way to proceed is to focalize on the few already well–promising candidates for asteroseismologic studies. The rapidly growth in the knowledge of the pulsational content of FG Vir is an evident example: Mantegazza et al. (1994) discovered 7 pulsation modes by means of 792 measurements in 8 nights; Breger et al. (1995) pushed this boundary to 10 frequencies (the first 7 being confirmed) by means of a multisite campaign covering 170 hours; more recently, Breger et al. (1998) secured 435 hours at 6 observatories during a time span of 40 days, extracting up to 32 frequencies in its light curve (Fig. 7 shows their spacings and amplitudes). From a spectroscopic point of view, Viksum et al. (1998) determinated the ratios between equivalent widths and photometric amplitudes, assigning values to the 8 strongest modes, but no value could be proposed. This identification was confirmed by Breger et al. (1999), who compared the observed photometric phase lags between and light curves with the theoretical values for different . Theoretical models of FG Vir were also proposed by Guzik et al. (1998); results are satisfactory, but the authors stressed how important it is to propose more secure mode identifications. This is another confirmation of the necessity of the synergic approach.
4 The Dor stars
4.1 The multiperiodic content of the light curves
In recent years few early F–type stars showing small amplitude light variations (a few hundredths of a mag) have been discovered, mainly because these stars were used as comparison stars to measure Sct variables. The periods are much longer than those observed in Sct stars; since multiperiodicity is currently observed, – mode pulsations are the most plausible cause of the variability. The existence of a such a class of pulsating variable stars of spectral type F0 is now accepted and Dor has been designated as its prototype. Zerbi & Kaye (this volume) and Kaye et al. (1999) provide an exhaustive discussion of their phenomenology and a rigorous classification of their kind of variability. The reader can find in Kaye et al. (1999) the reference papers on all the bona fide members of the class, included the stars quoted below.
Star Case [Km s-1] [d-1] =2 Observed HD 224945 1 55.00 1.43 4.77 2.39 3.98 0.17-1.84 2 0.53 0.27 0.44 Dor 1 62.00 1.70 4.53 2.26 3.77 0.04-0.15 2 0.50 0.25 0.42 9 Aur 1 18.00 1.62 1.38 0.69 1.15 0.03-0.45 2 0.15 0.08 0.13 BS 2740 1 40.00 1.64 3.03 1.51 2.52 0.04-0.14 2 0.34 0.17 0.28 HD 62454 1 53.00 2.02 3.26 1.63 2.71 0.14-0.30 2 0.36 0.18 0.30 HD 108100 1 68.00 2.01 4.20 2.10 3.50 0.08 2 0.47 0.23 0.39 HR 8799 1 45.00 1.46 3.83 1.91 3.19 0.08-0.33 2 0.43 0.21 0.35
There are two other differences between – and –mode pulsations, which can be considered as fingerprints for the latter:
-
•
when considering the – diagrams the Sct stars (i.e. the –mode pulsators) describe ellipses, while Dor loops are only a little deviating from a straight line;
-
•
Mantegazza et al. (1995) stressed the phase correlation between light and radial velocity curves, i.e. the opposite behaviour showed by radial and nonradial –mode pulsation;
Let me discuss here the characteristics of the multiperiodicity observed in Dor stars. In HR 2740, HD 108100 and HD 62454 the periods are very close each other, while in HD 224945 they are spread in a larger interval. In Dor two periods very stable in amplitude and in phase were observed for a long time, but a third one appeared in the last decade. This is not an isolated case, since in the 9 Aur light curve the 1.375 d period appeared, while the 1.302 d disappeared. In HD 224945 the amplitudes of the excited modes are continuously changing, not only as absolute value, but also modifying the internal ranking between them; moreover, some periods are not always observed.
These characteristics and in general such a large variety of behaviours remind us the phenomenology of Sct stars. On the other hand, the change of the shape of some light curve around maxima (HD 164615 and HR 8330 are the two stars where this fact is more evident) is a peculiarity of Dor stars and it should be related straightly to the –modes excitation mechanism.
4.2 Can the rotational splitting explain the observed multiperiodicity ?
At present, the fact that the variability of the 50% of the Dor stars can be explained by a single period (even if modulated in amplitude, as in the case of HD 164615) is another difference respect with the Sct stars, where monoperiodicity is uncommon in small amplitude ( 0.10 mag) objects. The question if it is possible to explain the rich power spectra as an effect of a rotational splitting, i.e. modes with same but different , raises in a natural way. In this case, a predictable relation between observed frequencies should exist. For the purposes of this discussion, we will use the approach described by Aerts and Krisciunas (1996) for first order rotational splitting:
| (1) |
Equation (1) provides an estimate of the frequency separation as a function of the rotational velocity and the spherical degree, . Using a mean value for the disentangled frequencies in each object and the calculated physical quantities, we determinated the amount of rotational splitting expected in the multiperiodic objects (Tab. 2).
Among them, the splitting is excluded for the 50% of the sample, i.e., Dor, HD 108100, HR 8799 and HR 2740. Therefore, even if rotational splitting cannot be excluded for individual objects and the theoretical approach needs an improvement, it is hard to admit it as a cause of the multiperiodic behaviour observed in the class as a whole.
Also in the case of Dor stars spectroscopy can supply a different approach to the the study of –mode pulsations, but such observations were performed for a few stars (mainly 9 Aur and Dor itself) and more efforts are necessary to obtain a clear picture. However, the proposed typifyings seem to rule out the action of the rotational splitting.
As a final remark, the two Doradus identified in double stars (HD 628632 Puppis B and HD 62454) can be considered a good target to verify the connection between duplicity and pulsation and in what way the tidal effects can act (see Harmanec et al. 1997 for a similar approach in studying stars).
5 Acknowledgements
The author wishes to thank A. Kaye, L. Mantegazza and F.M. Zerbi for useful discussions.
References
- [] Aerts C., De Pauw M., Waelkens C., 1992, A&A 266, 294
- [] Aerts C., Krisciunas K., 1996, MNRAS 278, 877
- [] Antonello E., Broglia P., Conconi P., Mantegazza L., 1986, A&A 169, 122
- [] Antonello E., Poretti E., Stellingwerf R., 1988, in Multimode Stellar Pulsation, G. Kovacs, L. Szabados and B. Szeidl Eds., Konkoly Observatory, p. 27
- [] Balona L., 1987, MNRAS 224, 41
- [] Bossi L., Mantegazza L., Nunez N.S., 1998, A&A 335, 518
- [] Breger M., Handler G., Nather R.E., et al., 1995, A&A 297, 473
- [] Breger M., Pamyatnykh A.A., Pikall H., Garrido R., 1999, A&A 341, 151
- [] Breger M., Zima W., Handler G., et al., 1998, A&A 331, 271
- [] Guzik J.A., 1992, Delta Scuti Newsletter 5, 8
- [] Guzik J.A., Templeton M.R., Bradley P.A., 1998, ASP Conf. Ser. Vol. 135, p. 470
- [] Kaye A., Handler G., Krisciunas K., Poretti E., Zerbi F.M., 1999, PASP, in press
- [] Harmanec P., Hadrava P., Yang S., Holmgren D., North P., Poretti E., 1997, A&A 319, 867
- [] Mantegazza L., 1997, A&A 323, 844
- [] Mantegazza L., Poretti E., Bossi M., 1994, A&A 287, 95
- [] Mantegazza L., Poretti E., Bossi M., Zerbi F.M., 1995, ASP Conf. Ser. Vol. 83, 339
- [] Morgan S., Simet M., Bargenquast S., 1998, Acta Astronomica 48, 509
- [] Musazzi F., Poretti E., Covino S., Arellano Ferro A., 1998, PASP 110, 1156
- [] Poretti E., 1999, A&A in press
- [] Poretti E., Antonello E., 1988, A&A 199, 191
- [] Poretti E., Antonello E., Le Borgne J.F., 1990, A&A 228, 350
- [] Poretti E., Mantegazza L., Bossi M., 1996, A&A, 312 912
- [] Riboni E., Galli G., Poretti E., 1994, A&AS 108, 155
- [] Telting J., Schrijvers C., 1997, A&A 317, 723
- [] Templeton M.R., McNamara B. and the MACHO Team, 1998, Delta Scuti Newsletter 12, 18
- [] Viksum M., Kjeldsen H., Bedding T.R. et al., 1998, A&A 335, 549
6 Question
J. CHRISTENSEN-DALSGAARD – In relation to the problems of data analysis and the use of standard techniques as clean, I wonder whether tests have been made by exchanging data, or by applying the techniques in blind tests using synthetic data ?
E. PORETTI – Exchanges of data are very common between researchers in our field. The same sets of data are often re-analyzed in subsequent works. Our group always performs different data analysis by using different techniques: iterative sine–wave fitting, clean, Fourier transform … An example is constituted by the analysis of HD 224639 (Mantegazza et al. 1995, A&A 299, 437; Mantegazza et al. 1996, A&A 308, 847). Synthetic data are also currently generated to evaluate the effects of noise.