Spectra of planetary nebulae in NGC 5128 (Centaurus-A)
Abstract
Low dispersion spectra have been obtained of five planetary nebulae in the elliptical galaxy NGC 5128 (Centaurus-A) from the catalogue of Hui et al. (1993b ). The planetary nebulae (PN) cover a range of galactocentric radius from 7.9 to 17.7′ (8 to 18Kpc). The spectra display typical emission lines of H I, He I, He II, [O III], [N II] and [S II] and appear very similar to high excitation planetary nebulae in the Galaxy. This implies that, from a stellar evolution viewpoint, there should be no peculiar effects introduced by considering the bright cut-off of the PN luminosity function for distance estimation. In particular the brightest PN detected in NGC 5128 is not spectroscopically unusual. One of the PN shows relatively strong He II and [N II] lines and the derived N/O ratio indicates that it may be a Type I nebula, considered to arise from a high mass progenitor star. Determinations of the oxygen abundance of the five PN shows a mean value 0.5 dex below solar. Given that NGC 5128 is an elliptical galaxy with a presumably metal rich stellar content, the low metallicities of the PN are unexpected, although a similar situation has been observed in the bulge of M 31.
Key Words.:
Planetary Nebulae; Elliptical galaxies:NGC 5128
1 Introduction
The presence of abundance gradients in spiral galaxies is well established from observations of their H II regions (e.g. Pagel & Edmunds pe81 (1981)). From emission line strengths, abundances of He, N, O, Ne & S can be measured, and typically O/H decreases with galactocentric distance (e.g. Shaver et al. shav (1983); Walsh & Roy wr89 (1989)). The situation with regard to early–type galaxies is however more complex. There is little interstellar medium and hence no well–dispersed H II regions; resort must be made to the line of sight integrated properties of the starlight. Both sets of abundance indicators present their own advantages and disadvantages: emission line regions can be subject to local enrichments making them atypical of the general interstellar medium; stellar indicators, whilst providing line of sight abundances, are subject to contributions from stars all over the HR diagram, having a range in metallicity and age. In addition even a contemporaneous stellar population can appear to possess an abundance spread of light elements such as C, N and O as found for globular cluster giants (Kraft kraf (1994)).
Stellar abundances are measured from the strength of absorption lines, such as Mg I and molecular bands such as CN and TiO (Gorgas et al. gorg (1990), Davies et al. dav (1993) or colours (Visvanathan & Sandage visa (1977) and Peletier et al. pel (1990)). Synthesis techniques (Tinsley tins (1968), Faber fab (1973) and O’Connell oco (1976)) are required to provide abundance determinations. Abundances of various elements, such as Fe, Mg, Ca, Na etc can be obtained (see e.g. Vazdekis et al. vaz (1997)). Their accuracy is limited by the fact that only strong lines can be used, because of the considerable velocity broadening in the galaxies. Stellar colour and absorption line variations across the faces of early–type galaxies are generally observed and interpreted by an outwardly–decreasing metallicity (eg. Davies et al. dav (1993), Bica bic (1988)) although significant gradients in age are also sometimes claimed (Worthey et al. wor (1992), Trager et al. trag (1998)). Globular clusters cannot be used to determine the stellar population distribution of ellipticals, since their colours and line strengths are not representative of the main stellar component. For example Bridges et al. (brig (1997)) found that the average metallicity for the globular clusters in M 104 is [Fe/H]=0.7, about a factor 6 - 10 lower than for the stars in the central region (Vazdekis et al. vaz (1997)).
Studies pioneeered by Jacoby, Ciardullo, Ford and co-workers have shown that in early-type systems, planetary nebulae (PN) can be useful both as distance indicators (e.g. Jacoby & Ciardullo jac92 (1992)) and as probes of the galaxy kinematics (e.g. Hui et al. huic (1995)). PN, easily detected from their strong emission line spectra, can also be used as abundance tracers in a way comparable to H II regions, since some elements, O in particular, but also Ne and S, are not generally affected by the nucleosynthetic processing in most PN progenitor central stars. Measuring abundances of PN provides a unique way to determine the abundance spread of the old stellar population in distant ellipticals, as predicted from star formation theories (Arimoto & Yoshii ari (1986)) and population synthesis (Bica bic (1988)). Direct measurement of the stellar abundance spread from the ground is limited to local group galaxies such as M31 and M32 where single stars can feasibly be resolved.
NGC 5128 (Centaurus-A) is the closest giant elliptical (3.5 Mpc, Hui et al. 1993a ; morphological type S0,pec Sandage & Tammann sata (1987)), and has a projected size on the sky of over 1∘, making it ideal for spatial studies. HII regions, star formation and interstellar matter are found in the inner regions, possibly arising from a merger with a more metal poor galaxy (see for example Quillen et al. quil (1993)), so cannot provide reliable abundance diagnostics for the old stellar system. 784 PN have been detected in an area 2010kpc (Hui et al. 1993b ) and the luminosity function within the brightest 1.5 magnitudes was used to determine the distance. The radial velocities of 433 of these PN have been measured (from the brightest line, that of [O III]5007Å) in order to study the dynamics of the halo (Hui et al. huic (1995)). Using the PN as test particles, the gravitational potential of the galaxy can be studied: Cen-A was found to have a tri-axial potential with the galaxy minor axis offset from the rotation axis by 40∘. Measuring the rotation and velocity dispersion of the PN system, it was shown that M/L increases with radius suggesting that dark matter was present in the galaxy halo (Hui et al. huic (1995)). This is also in agreement with globular cluster velocity measurements (Hui et al. huic (1995) for NGC 5128 and Bridges et al. brig (1997) for M 104)
So far no spectroscopy of these PN has been obtained and their relation to the PN population in the Milky Way, which may have a different metallicity and certainly a different star formation history to Cen-A, is not known. In particular it is not known if the brightest PN observed are exceptional (perhaps of Type I) and what is the effect of line of sight extinction on the PN luminosity function. In Cen-A, it is known that there is a jet and extended emission line regions along the jet (e.g. Morganti et al. morg (1991)) as well as H II regions in the vicinity of the dust lane, all of which could be included in the PN census at some level. Spectroscopy can therefore be seen as important both in terms of the PN population and its use as a distance indicator and in terms of probing the chemical history of the host galaxy. The long-term goal is to study abundance gradients and the spread in abundances at a given radius, from large numbers of PN observed with multi-object techniques.
In this paper the results of deep spectroscopic integrations with a 3.6m telescope of a few selected PN in NGC 5128 are presented. Section 2 summarises the observations and Sect. 3 details the data reduction and presents the results. In Sect. 4 we discuss the data and the relevance of these observations for abundance determination, as well as the prospects for future such observations with 8-10m class telescopes.
2 Observations
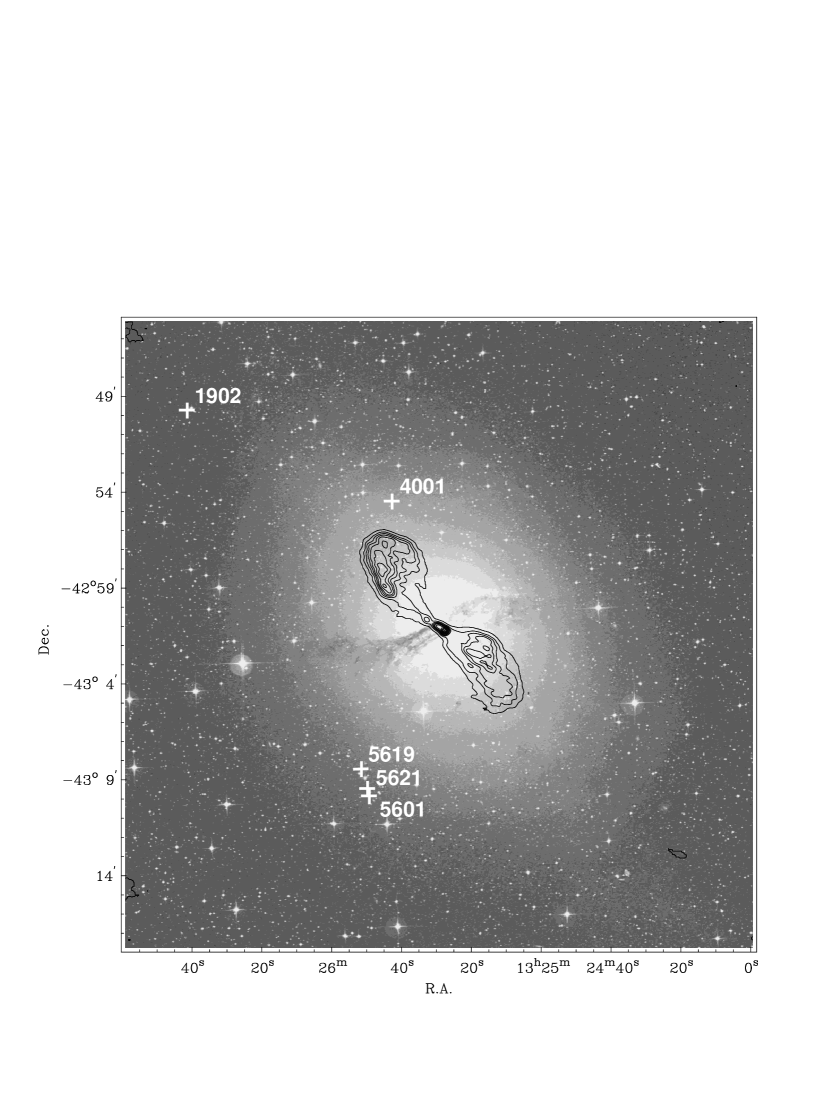
Long-slit spectra centred on three of the brightest PN in the catalogue of Hui et al. (1993b ) were observed with EFOSC1 (Buzzoni et al. buzz (1984)) on the ESO 3.6m telescope. Table 1 lists the three PN with the ID numbers, J2000 coordinates and 5007Å magnitudes (from Hui et al. 1993b ) and Fig. 1 shows the positions of the PN#5601 is the brightest PN observed in NGC 5128 (by 0.1mag.). The targets were chosen to cover a range in galactocentric radius and where possible the slit orientation was chosen so that at least one other PN from the Hui et al. (1993b ) catalogue would lie on the slit. For the slit length centred on PN#5601 two other PN were included in the slit (listed in Table 1); for PN#4001 one of the desired PN (4013) was however missed by the slit. No target very close to the high surface brightness central region of the galaxy was chosen in order to minimize the contribution of galaxy continuum to the PN spectra. In total, spectra of five PN in Cen-A were detected and are all listed in Table 1 together with their radial distance from the galaxy nucleus. Figure 1 shows the positions of these five PN against the POSS image, with the 1.425 radio contours overlayed in black (from Condon et al. cond (1996)).
For each target an [O III] narrow band filter image (ESO#686, 5013Å, 56Å) and an off-emission filter (ESO#714, 5483Å, 182Å, Strömgren ) image were obtained with EFOSC1 in order to acquire the PN on the slit. Exposure times were usually 5min for the [O III] image and 2min for the continuum band. Visual ‘blinking’ of the two images confirmed the PN and the object was then centred in the slit. At least one more [O III] image was obtained during each sequence of exposures on the same target to ensure that the source was well-centred in the slit.
| Central | Target | RA (2000) Dec | Radial† | m5007 |
|---|---|---|---|---|
| PN ID | Name∗ | ∘ ′ ′′ | dist (′′) | (mag.)‡ |
| 5601 | 5601 | 13 25 53.52 43 08 54.7 | 547 | 23.51 |
| 5621 | 13 25 53.81 43 08 37.5 | 535 | 25.64 | |
| 5619 | 13 25 55.31 43 07 12.4 | 474 | 25.70 | |
| 1902 | 1902 | 13 26 40.78 42 49 33.6 | 1061 | 24.01 |
| 4001 | 4001 | 13 25 41.12 42 54 35.0 | 418 | 23.89 |
The slit position centred on PN#1902 also included an emission line filament (approximate J2000 position 13h 26m 49s 42∘ 49′ 25′′). This is part of the system of filaments associated with the jet in NGC 5128 some of which have been spectroscopically studied by Morganti et al. (morg (1991)).
The detector of EFOSC1 was a Tek 512512 thinned CCD (ESO#26, TK512CB) with 27m pixels, which project to 0.61′′. Given the seeing encountered of 1-1.5′′, slit widths of 1.5′′ were employed to ensure a good balance between receiving the majority of the flux from the point-like PN without a severe penalty of sky and galaxy background light, and of ensuring optimal sampling at the detector. The actual slit width employed is listed in Table 2. All the spectra were obtained with the B300 grism, which covers the wavelength range 3640 to 6860Å at a dispersion of 6.3A/pixel; the resulting resolution of the spectra was about 14Å. Bias frames, dome flat fields and spectroscopic sky flats were obtained to correct the CCD pixel response; neon and argon lamps spectra for correction of distortions and wavelength calibration; and broad slit (5′′) spectra of spectrophotometric standard stars EG 54 (Oke oke (1974)), EG 274 (Hamuy et al. ham (1994)) and LTT 3864 (Hamuy et al. ham (1994)) for flux calibration.
| Target | Slit width | Date | Exp. | ZD’s |
|---|---|---|---|---|
| (′′) | (s) | (∘) | ||
| 5601 | 1.5 | 1995 Apr 03 | 2400 | 18.3, 14.8, |
| + 5619 | 15.3, 19.7, | |||
| + 5621 | 26.2, 36.0, | |||
| 43.4 | ||||
| 5.0 | 600 | 30.9 | ||
| 1902 | 1.5 | 1995 Apr 04 | 2400 | 44.3, 36.8, |
| 29.5 | ||||
| 5601 | 1.5 | 1995 Apr 04 | 2400 | 19.7, 15.3, |
| + 5619 | 14.8, 18.5, | |||
| + 5621 | 25.9, 34.1, | |||
| 41.4 | ||||
| 1902 | 1.5 | 1995 Apr 05 | 2400 | 43.0, 35.1, |
| 27.8 | ||||
| 4001 | 1.5 | 1995 Apr 05 | 2400 | 21.4, 17.7, |
| 14.4, 16.0, | ||||
| 21.3, 28.1, | ||||
| 35.9, 42.1 |
Resulting total exposure times per target field are:
PN#5601+5619+5621 - 9.50 hrs
PN#1902 - 4.00 hrs
PN#4001 - 5.33 hrs
The slit orientation was kept fixed for each set of observations of a given target. This was necessary to avoid the delays resulting from many replacements of the slit on the target which would have resulted from the conventional tracking of the parallactic angle by slit rotations. In addition, keeping a fixed slit orientation facilitated the subtraction of the underlying (galaxy) continuum and the detection of several PN along the slit lengths. However imposing a fixed orientation leads to differential loss of light with wavelength, largest at the higher zenith distances, as the parallalactic angle differs from the slit position angle. The requirement of long integration times and only three allocated nights forced us to observe the targets for some (small) fraction of the time at zenith distances exceeding 40∘, where the differential atmospheric refraction between 3700 and 6700Å exceeds the slit width (e.g. Fillipenko fill (1982)). In order to attempt to control the amount of wavelength-dependent slit loss through differential refraction, we adopted an observing strategy of always including a bright stellar source on the slit. The spectrum of this source could then be used to monitor, and correct, the differential refraction losses. Comparison of the extracted spectra of the star, corrected for atmospheric extinction, at high and low zenith distance should allow this correction to be applied to the spectra of the PN. One exposure of PN#5601 with the star on the slit was also made with a broad slit (5′′) in order to test the validity of this technique with a spectrum essentially free from any differential slit losses.
3 Reductions and Results
3.1 Reductions
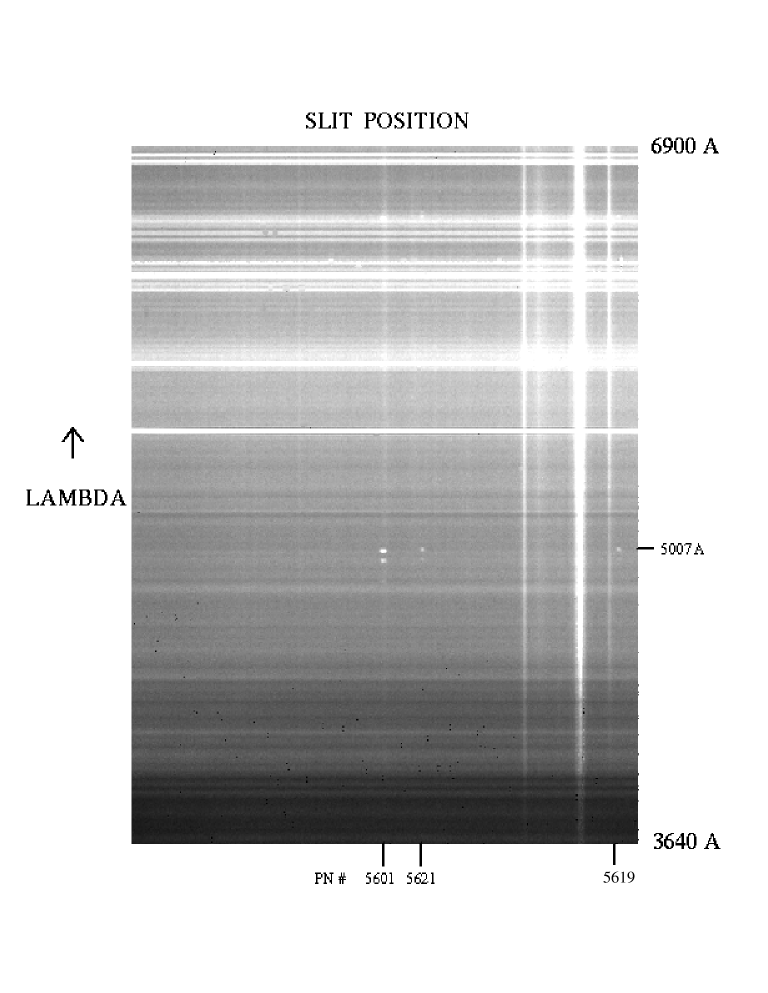
All the spectra were reduced in the usual way, using the spectroscopic packages in IRAF. A super-bias frame was formed by averaging many individual bias frames and this bias image was subtracted from all frames. A mean flat field image was formed from many exposures to a tungsten lamp shining off a reflector in the dome and was used to rectify the pixel-to-pixel variations. The sky flat was employed to map the response of the system in the cross dispersion direction, thus correcting any vignetting in the optical system or variation in slit transmission. The exposures of the Neon and Argon lamps were employed to fit the known wavelengths of the comparison lines and the spectra were rebinned into channels of constant wavelength width by fitting third order polynomials. Figure 2 shows the long slit spectrum centred on PN#5601 formed by averaging (with cosmic ray rejection) the first four exposures on April 03 (Table 2). The other two PN (5619 and 5621) are clearly visible from their [O III] line emission. In addition there are a number of continuum sources detected, some of which are probably stellar clusters in NGC 5128. There is a faint red star displaced less than one seeing disc from the PN#5601 and visible in Fig. 2. The bright continuum source closest to PN#5619 was the one used in attempting to correct for differential refraction slit losses.
Spectra of the PN, and the reference star, were extracted from each image using optimal weighting after subtracting the mean sky from the vicinity of the objects. The atmospheric extinction was corrected for each exposure and absolute flux calibration applied from the observation of the spectrophotometric standard. The background contained a substantial contribution of galaxy light, especially for PN#4001 so it was necessary to restrict the background region to be close to the PN (with typically at least three times as many pixels in the sky as in the extracted PN). After extraction and removal of cosmic rays, the individual spectra were flux calibrated.
The spectra of the reference continuum source from each exposure were compared. The spectra showed a very large difference. Spectra taken before transit of the star indicated an upward correction to the blue fluxes and a downward correction to red fluxes relative to the spectrum taken at the lowest airmass. For the spectra taken after transit of the star a downward correction to the blue fluxes and an upward correction to red fluxes, relative to the spectrum taken at the lowest airmass, was found. However applying such corrections to the extracted PN spectra gave inconsistent line fluxes in the sense that the correction factors were too steep with wavelength and resulted in discordant spectra from before and after meridian passage. The explanation for the derivation of such unrealistically large corrections is unclear. The continuum source could be extended (e.g. be a cluster in NGC 5128 itself) and have different colours in different regions; however this seems unlikely since exactly the same behaviour was exhibited by the reference spectra for the other targets. The most probable explanation is that the slit rotates slightly during the course of the observations so that the flux received in the slit tracks across the image in opposite directions on either side of the meridian, exaggerating the effects of differential atmospheric extinction. It was found that the line ratios of the extracted (and extinction corrected) PN spectra did not vary systematically with airmass beyond the errors of measurement. In addition the line ratios in the extracted spectra did not differ from those of the broad slit exposure of PN#5601 by more than the errors, although flux determination of the H line was hampered by the broadened sky lines. Since emission lines were only detected over the wavelength range 4500 to 6700Å, and the differential atmospheric refraction is 0.70′′ over this range for an airmass of 1.4, then in 1.5′′ seeing with a 1.5′′ slit the differential flux loss was at maximum 30% (see Fig. 1 of Jacoby & Kaler jaka (1993)). Thus overall only small losses in spectrophotometric integrity of the combined spectra should result. The fluxed spectra for each PN were averaged (using weights based on exposure time) on a case by case basis excluding the last exposure at highest airmass to form the final PN spectra. The extracted spectrum of the jet filament was treated similarly.
3.2 Results
Figure 3 shows the mean spectra of the five PN observed in Cen-A. The red star continuum under PN#5601 could not be effectively subtracted. The emission lines were interactively fitted by Gaussians and the flux in the lines are listed in Tables 3 and 4 for each PN and the filament. In Table 3 the line flux data for the three brighter PN are collected. The errors in Table 3 take into account the continuum under the line and the photon noise in the sky-subtracted spectra; the errors on the H flux have been propagated to the other line flux errors. The measured signal-to-noise on the [O III]5007Å line flux for the brightest PN (5601) is 55. The reddening correction was calculated by comparing the observed H/H ratio to the Case B value using the Seaton (seat (1979)) Galactic reddening law and is listed in Table 3. The dereddened line fluxes (the error on the extinction was not propagated to the dereddened line errors) together with the observed H flux are listed in Table 3. In Table 4 the fluxes are presented for the two fainter PN and the filament near PN#1902. The errors are substantially larger than for the data presented in Table 3, since the PN are fainter; for example for PN#5619, the signal-to-noise on the measurement of the [O III]5007Å line is 9.

| PN# | 1902 | 4001 | 5601 | ||||||||||
|---|---|---|---|---|---|---|---|---|---|---|---|---|---|
| Ident. | I | I | IO | ID | IO | ID | |||||||
| (Å) | |||||||||||||
| He II | 4686 | 64 | 23 | 63 | 23 | 12 | 3 | 12 | 3 | 20 | 16 | 20 | 17 |
| H | 4861 | 100 | 0 | 100 | 0 | 100 | 0 | 100 | 0 | 100 | 0 | 100 | 0 |
| [O III] | 4959 | 498 | 93 | 502 | 93 | 330 | 76 | 331 | 76 | 414 | 51 | 416 | 51 |
| [O III] | 5007 | 1185 | 216 | 1197 | 219 | 960 | 218 | 965 | 219 | 1268 | 153 | 1268 | 153 |
| He I | 5876 | 31 | 7 | 33 | 7 | 30 | 16 | 31 | 17 | ||||
| H | 6563 | 261 | 49 | 286 | 54 | 274 | 57 | 286 | 62 | 271 | 39 | 286 | 41 |
| [N II] | 6583 | 135 | 28 | 147 | 30 | 18 | 5 | 17 | 5 | 56 | 11 | 59 | 12 |
| [S II] | 6716+31 | 58 | 27 | 63 | 30 | 24 | 9 | 25 | 10 | ||||
| c | -0.120.23 | -0.060.28 | -0.070.19 | ||||||||||
| Log10F(H)‡ | -16.3 | -16.4 | -16.2 | ||||||||||
∗ Observed flux normalised to I(H)=100
† Dereddened flux normalised to I(H)=100
‡ Absolute observed H flux
| PN# | 5619 | 5621 | Filament | ||||||||||
|---|---|---|---|---|---|---|---|---|---|---|---|---|---|
| Ident. | I | I | IO | ID | IO | ID | |||||||
| (Å) | |||||||||||||
| He II | 4686 | 46 | 38 | 48 | 38 | ||||||||
| H | 4861 | 100 | 0 | 100 | 0 | 100 | 0 | 100 | 0 | 100 | 0 | 100 | 0 |
| [O III] | 4959 | 482 | 190 | 484 | 190 | 365 | 153 | 358 | 150 | 452 | 136 | 441 | 133 |
| [O III] | 5007 | 1484 | 480 | 1489 | 482 | 904 | 360 | 879 | 355 | 1074 | 313 | 1036 | 302 |
| H | 6563 | 278 | 96 | 286 | 99 | 365 | 127 | 286 | 100 | 382 | 113 | 286 | 85 |
| [N II] | 6583 | 252 | 100 | 197 | 80 | 251 | 73 | 186 | 54 | ||||
| [S II] | 6716+31 | 67 | 30 | 51 | 23 | ||||||||
| c | -0.04 | 0.33 | 0.40 | ||||||||||
| Log10F(H)‡ | -17.1 | -16.7 | -16.6 | ||||||||||
∗ Observed flux normalised to I(H)=100
† Dereddened flux normalised to I(H)=100
‡ Absolute observed H flux
4 Discussion
4.1 Planetary Nebula spectra
The five PN observed in NGC 5128 show spectra entirely typical of PN; the spectra are not obviously distinguishable from those of Galactic PN. Although the signal-to-noise is not high, the range of line fluxes, absolute H fluxes and [O III]5007Å/H ratios is similar to that for high excitation Galactic PN. There were no low excitation PN spectra among the five, but this is probably not surprising given that the source detection was performed in [O III] and the emphasis here was on the brightest objects. The range in [O III] brightness covered is 7.5 (from the photometry of Hui et al. 1993b ) and 8 in H flux from the long slit observations (Tables 3 and 4). From the standpoint of the evolution of low mass stars it is not surprising that the spectra are typical, but on the other hand these are among the brightest PN in a whole galaxy. Doubt had been expressed that the PN at the peak of the luminosity function may not have been typical of the general PN population and that distance estimates which relied on the peak of the luminosity function could suffer from systematic bias (Bottinelli et al. bott (1991); Tammann, tam (1992)). These effects have been carefully refuted (Feldmeier et al. feld (1997), McMillan et al. mcmi (1993) and Jacoby jac96 (1996)) and together with the spectra shown in Fig. 3 and tabulated in Tables 3 and 4 amply demonstrate that the brightest PN in a galaxy are typical. That they are the brightest is simply due to the fact that they are observed whilst at their peak luminosity. The 5007Å luminosity is generally higher for higher mass progenitor stars and also peaks in the later stages of evolution of lower mass stars (Schönberner & Tylenda scho (1990)). However for PN with high core masses, above 0.65M⊙, the high nitrogen abundance can decrease the efficacy of cooling by oxygen emission, reducing the 5007Å flux by 0.5mag (Kaler & Jacoby kaja (1990)).
The extinction correction for the three brightest objects indicates a slightly negative value. The Galactic component of reddening to NGC 5128 given by Burstein & Heiles buhe (1984) is EB-V = 0.123 (c=0.18). This value is similar to that (EB-V = 0.10) adopted by van den Bergh (berg (1976)) and that derived most recently from DIRBE dust maps by Schlegel et al. schl (1998) (EB-V = 0.115); however Jablonka et al. (jabl (1996)) measured values of EB-V as low as 0.03 from spectrophotometry of globular clusters in NGC 5128. The extinction values for the PN are consistent with these values within the errors, except perhaps for PN#5601. However it is puzzling that the values are systematically low; any local extinction in NGC 5128, or dust within the nebulae themselves, would increase the value above the baseline for the Galactic line of sight extinction. Slit lossses through atmospheric refraction should not alone account for bias. Errors may have arisen in subtraction of the underlying stellar continuum whereby emission line flux is lost to stellar absorption lines, although the effect would be to produce an increased extinction on account of the generally higher H absorption equivalent width compared with H. However one of the PN (5621) does show an extinction above the Galactic value, although with a substantial error, as does the filament, which is however an extended object. The extinction to the filament is in the range of values for the extinction determined by Morganti et al. (morg (1991)); the filament is in the same vicinity as their Field 2 (see their Fig. 2) although about ten times lower surface brightness (compare their Table 4 for spectra). The [O III]5007Å/H ratio measured here is also similar to the values measured by Morganti et al. (morg (1991)).
The most probable explanation of the depressed reddening values is that the central wavelength of the guiding camera lies at one end of the range H to H; by tracking on the image in the vicinity of the wavelength around H, flux is systematically lost from the slit at H for airmasses much greater than 1.0. Subsequent to this conclusion we were informed that the guiding camera of the ESO 3.6m at the time of the observations was sensitive over the wavelength range 3700 to 5000Å. The dereddened fluxes were formed employing the observed reddening, even if negative; this serves to compensate for the losses of the red part of the spectra. No specific correction for foreground (Galactic) reddening was employed. It is apparent that the three brightest PN show no evidence for intrinsic reddening (within the substantial measurement errors), which is probably not surprising given that they are the the brightest PN observable in the galaxy. Any extinction would move them to lower observed fluxes; PN#5621 is for example as intrinsically bright as PN#4001. The effect of local galactic extinction and dust intrinsic to the PN must play a role in shaping the PN luminosity function (Jacoby jac89 (1989)). With spectroscopy of the brightest PN, the effect of dust on the luminosity function, and hence on the distance estimate through fitting of this function (Ciardullo et al. cia89 (1989); see also Mendez et al. men (1993)), can be directly quantified. However if dust is associated with PN dependent on their luminosity it would be expected to have a strong effect on the PN luminosity function. Jacoby & Ciardullo (jaccia (1999)) in their study of PN in M 31 have found a weak correlation between extinction and 5007Å luminosity, which also exists for PN in the LMC. The surprising net effect on the PN luminosity function is that the apparent peak brightness is nearly independent of absolute peak brightness.
On the basis of the [O III]5007Å/H and He II 4686Å/H ratios the excitation class can be defined (Dopita & Meatheringham dom90 (1990)). A least squares fit of the effective temperature from photoionization models (Dopita & Meatheringham dom91b (1991)) against excitation class for a uniform set of observations and models of Magellanic Cloud PN allows estimation of effective temperature. Use of this data set could be criticized since the LMC and SMC have low metallicities compared to Galactic or more metal rich galaxies, but the modelling of AGB evolution shows no strong dependence of stellar temperature on metallicity (Dopita et al. djv (1992)). Table 5 lists the excitation class and indicative temperature of the PN in Cen-A. PN#5619 could not have a reliably assigned stellar temperature since its excitation class is high (based on its high [O III]/H ratio) yet it was too faint to detect He II4686Å (excitation class above 5.0 requires the He II/H ratio). These temperatures should be seen as upper limits, since if the nebulae are optically thin the high ionization emission is enhanced; given the large line ratio errors the likely errors are at least 10000K.
| Parameter | PN#1902 | PN#4001 | PN#5601 | PN# 5619 | PN# 5621 |
|---|---|---|---|---|---|
| Excit. Class | 7.8 | 5.0 | 5.4 | 6.7 | 7.0 |
| T∗(K) | 180000 | 100000 | 110000 | 140000 | 155000 |
| Log L∗ | 4.0 | 3.9 | 4.2 | - | 3.7 |
| M∗ (M⊙) | 0.68 | 0.64 | 0.83 | - | 0.62 |
| Te(K) | 13000 | 14000 | 13000 | 14000 | 12500 |
| Z(Z⊙) | -0.3 | -0.6 | -0.4 | -0.6 | -0.4 |
| O++/H 105 | 26 | 13 | 21 | 14 | 25 |
| 12Log10(O/H) | 8.5 | 8.2 | 8.5 | 8.4 | 8.3 |
| -0.4 | -0.7 | -0.4 | -0.5 | -0.6 | |
| N/O | 0.4 | 0.3 | 0.4 | - | 0.5 |
4.2 Abundances of the Planetary Nebulae
Even for the three brightest PN observed in NGC 5128, the weak diagnostic forbidden lines were not detected; thus it is not possible to measure accurate electron temperatures (from the [O III]5007/4363Å ratio) or densities (for example from the [S II]6716/6731Å ratio). Nevertheless an attempt was made to estimate the oxygen abundance in order to compare it with other abundance diagnostics (e.g. from stellar absorption lines). Dopita et al. (djv (1992)) presented a diagnostic diagram of PN metallicity v. effective temperature, in which the electron temperture can be determined from the [O III]/H ratio. This plot was derived from photoionization models of a grid of optically thick PN; the effective temperature being determined from the fit to the Magellanic Cloud data (Dopita & Meatheringham dom91b (1991)). In Table 4 the estimated values of the electron temperature are listed; for PN#1902 and 5621 the range of effective temperatures are out of range of the diagnostic plot, but were extrapolated. Row 6 of Table 4 lists the derived metallicities of the PN (all element abundances scaled except Helium), based on the Dopita et al. (djv (1992)) calibration. From the electron temperature estimates (Table 4 row 5), the empirical O++ abundances were determined from the [O III]/H ratios and are listed in row 7. A correction for the presence of O3+ was made using the ionization correction factor derived from the He/He++ ratio (Kingsburgh & Barlow kiba (1994)); the He/H ratio was assumed fixed at 0.15. The He I 5876Å line indicates He+/H+ ratios as high as 0.2 but this line suffers from proximity to the strong Na I telluric lines, and the difficulty in good sky subtraction leads to a large error on the line measurement. Assuming that the N/O ratio for the PN is the same as the mean value for the Galactic PN (0.28; Kingsburgh & Barlow kiba (1994)), the fraction of O+/H+ was estimated and thus the total oxygen abundance. The uncertainties introduced in correcting for the presence of O3+ and O+ are between 20 and 40%. Where the [N II]6583Å line was strong it was assumed that the N/O ratio was higher than the Galactic mean value and the O+ contribution was included as an upper limit. Row 8 lists the derived logarithmic O/H abundances and row 9 the oxygen abundances compared to solar.
In addition to these empirical estimations of the nebular parameters, the photoionization modelling package CLOUDY (Ferland ferl (1998)) was used to model the spectra matching the [O III] luminosity and relative line strengths; the carbon abundance was assumed as 12Log10(C/H)=8.7. The derived parameters were generally in good agreement with those empirically derived; the stellar temperatures were about 10000K lower however. The fair agreement between the empirical O/H abundance estimates and those from photoionization models in Table 5 provides assurance that the use of empirical relations calibrated from lower metallicity Magallanic Cloud planetary nebulae does not seriously affect (within 0.15dex) the resulting abundance estimates. In rows 3 and 4 of Table 3, the derived stellar luminosity and core mass (from Schönberner sch81 (1981), sch83 (1983) tracks) are also listed. From the models, the diagnostically useful N/O ratio was calculated and is listed in row 10. Due to the limited spectroscopic constraints on the models, the nitrogen abundances are uncertain; the N/O ratios could be a factor of 2 – 3 higher, but are not likely to be much lower if the PN are optically thick (which appears probable both from the photoionization models and their high luminosity). Whilst the values of N/O are moderately high (the mean value for non-Type I Galactic PN is 0.28 - Kingsburgh & Barlow kiba (1994)), only PN#5621 satisfies the criterion of N/O 0.5 for classification as a Type I PN, considered to arise from higher mass progenitor stars (Peimbert & Torres Peimbert pepe (1983)). This object in addition displays He II emission strong relative to H, so may be a bona fide Type I nebula (He/H0.125). A direct measurement of the N/O ratio (such as from [N II]6583/[O II]3727Å line ratio) would be required to confirm this classification. However the two brightest PN (5601 is the brightest PN in the galaxy detected by Hui et al. 1993a ) are not obviously Type I PN; this is consistent with observations of PN in the Magellanic Clouds (Dopita & Meatheringham, dom91b (1991)) that Type I PN are not the most luminous in a population on account of their fast evolution to high effective temperatures and hence lower luminosities. Type I PN could be more optically thin than their lower mass counterparts as suggested by Mendez et al. (men (1993)), thereby leading to lower observed [O III] luminosities than expected from the luminosities of the central stars. Type I PN may also be more copious producers of dust, hence further lowering their observed luminosities.
The quality of the oxygen abundance determinations is not high enough to investigate any evidence of a metallicity gradient; the O/H abundance v. projected radius shows no trend, perhaps even a suggestion of increasing with increased galactocentric radius. The sample is too small and the quality of the O/H determinations too low to draw any conclusions. The mean [O/H] abundance appears to be -0.5 for the PN in Cen-A; this can be compared with the mean value for 42 non-Type I Galactic PN of -0.24 (Kingsburgh & Barlow kiba (1994)). It is surprising that the oxygen abundance is lower than characteristic for Galactic PN, given that the metallicity is expected to be higher in this high luminosity elliptical galaxy. The range of galactocentric radii probed by the five PN is however 7.1 to 18.0 Kpc (Table 1), which, by analogy with the Milky Way would show a lower metallicity than the core (by [O/H] -0.3 at 7Kpc e.g. Shaver et al. shav (1983)).
There does not appear to be a direct metallicity determination for the large scale stellar content of this galaxy. However the metallicity of NGC 5128 can be estimated using the tight relations between velocity dispersion, luminosity, and Mg2 index for giant ellipticals (Faber & Jackson faja (1976); Terlevich et al. terl (1981)). The Mg2 index can then be converted to metallicity using stellar population models. NGC 5128 has a central velocity dispersion between 150 and 200 km s-1 (Wilkinson et al. wilk (1986)). This might however be a lower limit, since the inner regions are obscured by the large central dust lane. Wilkinson et al. (wilk (1986)) conclude that M20.5 mag.; this then corresponds to an Mg2 index of 0.31. To convert this value into a metallicity, a value for the age of NGC 5128 must be assumed. For an age of 17 Gyr Vazdekis et al. (vaz (1997)) give a metallicity slightly higher than solar, or [Fe/H]=0.4 for an age of 6 Gyr. These numbers again depend slightly on the IMF chosen, but it is fairly certain that the stellar indicators show an abundance which is about solar or higher. In addition the globular clusters have a higher mean metallicity than for the Milky Way. In NGC 5128 Harris et al. (har92 (1992)) determined a mean metallicity Fe/H of -0.8 for 62 globulars from Washington photometry whilst the mean for all globulars in the Milky Way is -1.35. Clearly a determination of the stellar metallicity variation with radius is required for NGC 5128 to contrast with the measurements from the planetary nebulae. It should also be a priority for future observations to study PN near the galaxy core (but avoiding the dust lane) in order to search for high abundance PN.
A detailed investigation of the discrepancy between the stellar and PN abundances is beyond the scope of this paper involving as it does stellar evolution, chemical enrichment processes, mergers and elliptical galaxy formation. However a similar discrepancy between the stellar and PN metallicity is seen with abundance data from PN in the bulge of M 31, where a mean [O/H]-0.5 is found (Jacoby & Ciardullo jaccia (1999)) in strong contrast to the apparently super-solar stellar abundances. One obvious reason for such discrepancies could be that the PN and stellar abundances do not refer to the same stars; for example the absorption line spectra would be weighted by the most luminous stars. In the optical the more metal rich stars are generally fainter than lower metallicity ones so that the stellar indicators (e.g. Mg2 index) are weighted to older stars, except in young populations (less than a few Gyr). However if the chemical enrichment proceeds monotonically with time, then the younger stars are more metal rich; although enrichments of 0.5 dex in a few Gyr might require epochs of star formation rather than steady evolution. If mergers with lower luminosity (and metallicity) galaxies contributed substantially to the stellar population this would decrease or even reverse the trend of increasing metallicity with time. NGC 5128 appears to have suffered a recent merger. Unlike most other ellipticals it has a prominent twisted disk of gas containing numerous HII regions, and lying approximately along the galaxy minor axis. The velocities of the PN (Hui et al. huic (1995)) indicate that the inner disk, containing the HII regions, is rapidly rotating or is the remnant of a precessing, nearly polar, gas disk in an axisymmetric potential (Sparke spark (1996)). The five PN observed could have originated from the smaller, lower metallicity, infalling galaxy; however only a fraction of the total number of PN in NGC 5128 could have been so produced since the luminosity specific PN density for NGC 5128 is similar to that for other early-type galaxies (Hui et al. 1993a ).
A second reason for the low O abundance from the PN in comparison with the expected high stellar (Fe peak) abundance is suggested by the known anti-correlation between (Galactic) stellar Fe/H and O/Fe (King king (1994)). If the stellar population is super metal rich when considered from the viewpoint of Fe abundances it is not from the perspective of O abundances, which the PN reflect, independent of any stellar O/Fe calibration. However such a relation may be rather specific to the chemical evolution history of the Galaxy which must be very different from that of NGC 5128. But ellipticals tend to show Mg/Fe larger than solar (e.g. Worthey et al. wor (1992)) and the stellar Mg abundance should follow O (Faber et al. fab92 (1992)) which brings back the discrepancy between the PN and the stellar abundances. The extensive data on PN in different galaxies collected by Stasinska et al. (stas (1998)) show that O/H deduced from the PN is dependent on their luminosity (viz. stellar core mass), being larger for high luminosity PN. In addition the more luminous PN may be younger and should then probe the interstellar medium at later epochs. Although their sample does not encompass massive early-type galaxies, it implies that the low mean O/H of the five PN in NGC 5128 is difficult to understand. The luminosity specific PN number density is also high for NGC 5128, consistent with the bluer colour of NGC 5128 (Peimbert peim (1990); Hui et al. 1993a ) suggesting a lower metallicity than the giant ellipticals in Virgo, such as NGC 4472. Population age may also be a consideration for PN number density, since it appears from the relatively few number of PN in Galactic globular clusters that old stars produce relatively few PN (Jacoby et al. jac97 (1997)).
Contamination of the PN sample by halo objects, which, by comparison with the Galactic PN sample (e.g. Howard et al. how (1997)) have notably low metallicity, could be reduced by considering the kinematics. From the NGC 5128 PN kinematic survey (Hui et al. huic (1995)), PN#5601 and 1902 could be halo objects but their O abundances are on the high side of the mean (Table 5). The effect of high metallicity on PN formation is also not known - for example an enhanced mass loss rate on the AGB could result in dispersal of the envelope before the central star has had time to heat up enough to ionize the nebula (the AGB manqué channel Greggio & Renzini gren (1990); see also Ferguson & Davidson feda (1993)) This phenomenon would give rise to fewer PN at higher metallicity explaining the lower average metallicity of the PN. It is expected that the brightest PN come from a slightly metal poor population (Ciardullo & Jacoby cija (1992)) as predicted by the models of Dopita et al (djv (1992)). In this context it would be useful to search for Galactic bulge PN with super-solar metallicity in order to reach a clearer understanding of the role of metallicty on PN evolution. In addition more and better data on the PN and the stellar populations in metal rich systems, not confined to the bulges of spirals, are required for an understanding of what controls PN evolution in such environments before detailed evolutionary scenerios in particular galaxies can be developed.
4.3 Exploring Abundance Gradients with PN
In order for the PN to be reliable tracers, their abundances must reflect those of the gas from which the stars were formed and not solely be a consequence of nuclear reprocessing. From studies of Galactic PN, the O, Ne, S and Ar gradient (Maciel & Köppen mac (1994)) matches that of the H II regions (Shaver et al. shav (1983)) as does the He gradient (Peimbert & Serrano pei (1980)). This applies to the (common) Type II nebulae, not to the minority Type I PN, originating from higher mass progenitors and having enhanced He, N and Ne. The Type II PN and H II regions in the lower metallicity environment of the Magellanic Clouds also indicate similar abundances (see Clegg cleg (1993)). Richer (rich (1993)) has arrived at the important conclusion that the brightest PN in ellipticals have the same status as abundance indicators as H II regions in spirals. Spectra comparable to or better than the ones presented here for PN#1902, 4001 and 5601 are required to distinguish the Type II from Type I nebulae and to determine improved oxygen abundances. For the brighest PN it will be feasible to detect the [O III]4363Å line and thus determine O abundances to 0.2dex or better; for lower luminosity PN, or galaxies more distant than NGC 5128, empirical abundance determination and photoionization modelling, as performed here, is required and the derived abundances are of lower individual weight. However average oxygen abundances at least comparable in accuracy to those for the integrated stellar population as a function of radius, and for individual globular clusters, are achievable.
A rather large sample of PN is required to distinguish a trend in the abundance, since a PN at a given effective radius may reside at a large distance from the galaxy, due to projection. The radial velocity data could be used to give a partial answer to distinguish halo PN from body PN. Multi-object spectroscopy techniques are required to obtain spectra of the requisite numbers of PN to distinguish a trend and to sample the line of sight abundance spread, excluding halo objects. However given that most of the PN are projected against a strong stellar continuum, then multi-slit rather than multi-fibre instruments are required to provide accurate background subtraction of the spectra. Coherent fibre bundles, one for each PN, could alternatively be employed to allow effective 2-D background subtraction. However single fibres are adequate for radial velocity work based on the brightest line of 5007Å. Since the orientation of a slit must be kept fixed to provide a good background subtraction and to allow several PN to be observed per slit, then the use of an Atmospheric Dispersion Corrector is highly advantageous to ensure spectrophotometry over the requisite large wavelength range (3700 - 6800Å for He, N, O, Ne and S abundance determinations). When considering observation of PN in galaxies more distant than NGC 5128, the issue of background subtraction will become more crucial as larger variations in galaxy continuum will be included in the slit or aperture. Spectrophotometry of extra-galactic PN is a field where multi-object techniques on 8-10m telescopes will bring a rich harvest of data to bear on the history of chemical enrichment in galaxies of all types.
5 Conclusions
The first spectra of planetary nebulae in the nearby early-type galaxy NGC 5128 have been presented. The spectra of five PN from the catalogue of Hui et al. (1993b ) have been observed over an observed emission line brightness range of a factor 8 and galactocentric radius range from 7 to 18 kpc. The spectra show characteristic high ionization emission lines similar to Galactic PN and confirming that the brightest PN in a galaxy are entirely typical. The mean [O/H] of the five PN, determined by empirical methods and modelling, is 0.5 with a spread of 0.3dex. This low metallicity contrasts with that of the assumed metal rich stellar population of NGC 5128.
Acknowledgements.
We would like to thank M. Richer for stimulating comments on the subject of probing galactic abundances from the PN population.Note added in proof
Harris et al. (AJ 116, 2866, 1998 and AJ 117, 855, 1999)
have obtained HST photometry of a globular cluster and the
field halo stars in NGC 5128, situated at a distance of 21 kpc
from the galaxy centre. For the halo stars they estimate a mean
metallicity of = 0.4, but with a broad range.
Although the PN observed in this paper were at smaller
galactocentric distances, there is interesting agreement
between the metallicity of the PN from the [O/H] determinations
presented here and those for
the Red Giant Branch stars observed by Harris et al.
References
- (1) Arimoto N., Yoshii Y., 1986, A&A 164, 260
- (2) van den Bergh S., 1976, ApJ 208, 673
- (3) Bica E., 1988, A&A 164, 260
- (4) Bottinelli L., Gouguenheim L., Paturel G., Teerikorpi P., 1991, A&A 252, 550
- (5) Bridges T. J., Ashman K. M., Zepf S. E., et al., 1997, MNRAS 284, 376
- (6) Buzzoni R., Delabre B., Dekker H., et al., 1984, The Messanger 38, 9
- (7) Burstein D., Heiles C., 1984, ApJS 54, 33
- (8) Ciardullo R., Jacoby G. H., 1992, ApJ 388, 268
- (9) Ciardullo R., Jacoby G. H., Ford H. C., Neill J. D., 1989, ApJ 339, 53
- (10) Clegg R. E. S., 1993, in IAU Symp. No. 155 on Planetary Nebulae, Reidel, p. 549
- (11) Condon J. J., Helou G., Sanders D. B., Soifer B. T., 1996, ApJS 103, 81
- (12) Davies R. L., Sadler E. M., Peletier R. F., 1993, MNRAS 262, 250
- (13) Dopita M. A., Meatheringham S. J., 1990, ApJ 357, 140
- (14) Dopita M. A., Meatheringham S. J., 1991, ApJ 377, 480
- (15) Dopita M. A., Jacoby G. H., Vassiliadis E., 1992, ApJ 389, 27
- (16) Faber S. M., 1973, ApJ 179, 731
- (17) Faber S. M., Jackson R. E., 1976, ApJ 204, 668
- (18) Faber S. M., Worthey G., Gonzalez J.J., 1992, in The Stellar Populations of Galaxies (IAU Sump. 149), eds. B. Barbuy & A. Renzini, Kluwer, p. 255
- (19) Feldmeier J. H., Ciardullo R., Jacoby G. H., 1997, ApJ 479, 231
- (20) Ferguson H. C., Davidson A. F., 1993, ApJ 408, 92
- (21) Ferland G. J., Korista K. T., Verner D. A., et al., 1998, PASP 110, 761
- (22) Fillipenko A. V., 1982, PASP 94, 715
- (23) Gorgas J., Efstathiou G., Salamanca A. A., 1990, MNRAS 245, 217
- (24) Greggio L., Renzini A., 1990, ApJ 364, 35
- (25) Hamuy M., Walker A. R., Suntzeff N. B., et al., 1994, PASP 106, 566
- (26) Harris G. L. H., Geisler D., Harris H. C., Hesser J. E., 1992, AJ 104, 613
- (27) Howard J. W., Henry R. B. C., McCartney S., 1997, MNRAS 284, 465
- (28) Hui X., Ford H. C., Ciardullo R., Jacoby G. H., 1993a, ApJ 414, 463
- (29) Hui X., Ford H. C., Ciardullo R., Jacoby G. H., 1993b, ApJS 88, 423
- (30) Hui X., Ford H. C., Freeman K. C., Dopita M. A., 1995, ApJ 449, 592
- (31) Jablonka P., Bica E., Pelat D., Alloin D., 1996, A&A 307, 385
- (32) Jacoby G. H., 1996, in The Extragalactic Distance Scale, Proceedings of the ST ScI May Symposium. Eds. M. Livio, M. Donahue, and N. Panagia, CUP, 197
- (33) Jacoby G. H., 1989, ApJ 339, 39
- (34) Jacoby G. H., Ciardullo R., 1992, in IAU Symp. No. 155 on Planetary Nebulae, Reidel, p. 503
- (35) Jacoby G. H, Ciardullo R., 1999, ApJ, in press
- (36) Jacoby G. H., Kaler J. B., 1993, ApJ 417, 209
- (37) Jacoby G. H., Morse J. A., Fullton L. K., et al., 1997, AJ 114, 2611
- (38) Kaler J. B., Jacoby G. H., 1990, ApJ 362, 491
- (39) King J. R., 1994, AJ 107, 350
- (40) Kingsburgh R. L., Barlow M. J., 1994, MNRAS 271, 257
- (41) Kraft R. P., 1994, PASP 106, 553
- (42) Maciel W. J., Köppen J., 1994, A&A 282, 436
- (43) McMillan R., Ciardullo R., Jacoby G. H., 1993, ApJ 416, 62
- (44) Mendez R. H., Kudritzki R. P., Ciardullo R., Jacoby G. H., 1993, A&A 275, 534
- (45) Morganti R., Robinson A., Fosbury R. A. E., et al., 1991, MNRAS 249, 91
- (46) O’Connell R. W., 1976, ApJ 206, 370
- (47) Oke J. B., 1974, ApJS 27, 21
- (48) Pagel B. E. J., Edmunds M. G., 1981, ARA&A 19, 77
- (49) Peimbert M., 1990, Rev. Mex. A&A 20, 119
- (50) Peimbert M., Torres-Peimbert S., 1983, in IAU Symp. No. 103 on Planetary Nebulae, Reidel, p. 233
- (51) Peimbert M., Serrano A., 1980, Rev Mex A&A 5, 9
- (52) Peletier R. P., Davies R. L., Davis, L. E., et al., 1990, AJ 100, 1794
- (53) Quillen A. C., Graham J. R., Frogel J. A., 1993, ApJ 412, 550
- (54) Richer M. G., 1993, ApJ 415, 240
- (55) Richer M. G., McCall M. L., 1995, ApJ, 445, 642
- (56) Sandage A., Tammann G. A., 1987, A Revised Shapley-Ames Catalog of Galaxies, Carnegie Institution, Washington
- (57) Savaglio S., Benetti S., Pasquini L., 1997, EFOSC1 Operating Manual, Version 3
- (58) Schlegel D. J., Finkbeiner D. P., Davis M., 1998, ApJ 499,
- (59) Schönboener D., 1981, A&A 103, 119
- (60) Schönboener D., 1983, ApJ 272, 708
- (61) Schönberner D., Tylenda R., 1990, A&A 234, 439
- (62) Seaton M. J., 1979, MNRAS 187, 75P
- (63) Shaver P. A., McGee R. X., Newton L. M., et al., 1983, MNRAS 204, 53, 1983
- (64) Sparke L., 1996, ApJ 473, 810
- (65) Stasinska G., Richer M. G., McCall M. L., 1999, A&A, in press
- (66) Tamman G. H., 1992, in IAU Symp. No. 155 on Planetary Nebulae, Reidel, p. 515
- (67) Terlevich R., Davies R. L., Faber S. M., Burstein D., 1981, MNRAS 196, 381
- (68) Tinsley B., 1968, ApJ 151, 547
- (69) Trager S. C., Worthey G., Faber S. M., et al., 1998, ApJS 116, 1
- (70) Visvanathan N., Sandage A., 1977, ApJ 216, 214
- (71) Vazdekis A., Peletier R. F., Beckman J. E., Casuso E., 1997, ApJS 111, 203
- (72) Wade C. M., Hjellming R. M., Kellerman K. I., Wardle J. F. C., 1971, ApJ 170, L11
- (73) Walsh J. R., Roy J.-R., 1989, ApJ 341, 722
- (74) Wilkinson A., Sharples R. M., Fosbury R. A. E., Wallace P. T., 1986, MNRAS 218, 297
- (75) Worthey G., Faber S. M., Gonzalez J. J., 1992, ApJ 398, 69