Abundance Ratios in Early-Type Galaxies
Abstract
Although evidence is accumulating that abundance ratios in galaxies are often non-solar, they are far from understood. I resume the current evidence for non-solar abundance ratios, supplementing the recent review by Worthey (1998) with some new results. It appears that the Mg/Fe abundance ratio only depends on the mass of the galaxy, not on the formation time-scale. For massive galaxies [Mg/Fe] 0, while small galaxies show solar abundance ratios. Information about abundances of other element is scarce, but new evidence is given that [Ca/Fe] is solar, or slightly lower than solar, contrary to what is expected for an -element.
Dept. of Physics, University of Durham, South Road, Durham, DH1 3LE, UK
1. Introduction
The distribution of element abundances in galaxies is an important fossil record of their formation and evolution. Of primary importance is the metallicity (the mass fraction of all elements heavier than He), which contains important information about the past star formation history, which could well be strongly influenced by mergers and interactions. For early-type galaxies, the metallicity is an excellent estimator of the luminosity, or even the mass. Also very important are metallicity gradients, which are among the few parameters that can tell us something about the orbital structure in galaxies.
In recent years the quality of observational data has become so good, that one can also start thinking of measuring abundances of individual elements in external galaxies. Individual abundances will greatly help to understand their chemical evolution. In particular, one will be able to understand better the way in which the ISM of galaxies is enriched by metals, and what the relevant time-scales are. In the last 2 decades it has become clear that the abundance distribution in stars is not always the same as in the Sun. This was discovered first in individual stars in our galaxy (see Wheeler, Sneden & Truran 1989) and later in integrated spectra of elliptical galaxies (Peletier 1989, Worthey, Faber & González 1992). In this review I will discuss what we currently know about abundance ratios in galaxies, and what we can learn from this about the formation and evolution of galaxies. This paper is in part based on the excellent paper by Worthey (1998), but also includes some new high-quality data, which might shed new light on some issues in this rapidly evolving field.
The paper starts in Section 2 discussing some global relations for galaxies as a function of luminosity or velocity dispersion. In Section 3 the central abundances and abundance ratios are discussed, and in Section 4 their gradients. In Section 5 it is briefly discussed how we can understand non-solar abundance ratios. The need for stellar models with non-solar abundance ratios is mentioned in Section 6, after which some conclusions are given.
2. Global Relations
It has been known for some time that the stellar populations of early-type galaxies are strongly linked to their other properties. Two examples are the colour-magnitude relation (see e.g. Sandage & Visvanathan 1978) and the relation between Mg2 and velocity dispersion () (Terlevich et al. 1981). Both relations can be understood well if the average metallicity of a galaxy is larger when the galaxy is brighter. The usefulness of these relations in understanding galaxies strongly increased when Schweizer & Seitzer (1992) showed that the residuals of the colour/Mg2 – relation correlate with a parameter indicating recent mergers. This correlation implies that the scatter for undisturbed early-type galaxies is smaller than the amount due to observational uncertainties, while colours of disturbed galaxies are somewhat bluer for a given , due to increased star formation during the merger. This interpretation was confirmed by the work of Bower, Lucey & Ellis (1992), who found a very low scatter in the colour-magnitude relation (CMR) in the Coma cluster, showing no sign of any recent star formation in the early-type galaxies in this cluster. Later, using the more sensitive H absorption line index, Caldwell et al. (1993) showed that many early-type galaxies in the SW part of the cluster show signs of small amounts of young stars.
Recently, A. Terlevich (1998) redid the study of Bower et al. (1992) with a significantly larger sample in the Coma cluster. He finds that the intrinsic scatter in the elliptical galaxies in is 0.036 mag (consistent with Bower et al.). No difference was found in the slope of the CMR between ellipticals and S0 galaxies. The slope of the CMR was also the same in different areas of the cluster. Most galaxies blue-ward of the CMR are either late-type galaxies (Andreon et al. 1996) or seem to have late-type morphologies. In the outer parts of the cluster the residuals about the CMR become somewhat bluer, in agreement with the the results of Caldwell et al. (1993). These detailed colour studies indicate that the colour of an early-type galaxy is determined by its luminosity to a high accuracy. The same can be said of the Mg2 absorption line (Bender, Burstein & Faber 1993, Schweizer & Seitzer 1992). Although a colour of a galaxy, and also an absorption line, depends on many parameters, like metallicity, age and Initial Mass Function (IMF) slope, the fact that the CMR has the same slope across various factors of 10 in luminosity implies that the relations described above are almost certainly driven by metallicity: fainter galaxies have lower metallicities, and because of that bluer colours. This behaviour has been successfully reproduces in Galactic enrichment models (e.g. Arimoto & Yoshii 1987). Starting with a proto-galactic cloud, several generations of stars are formed, until the rate of Supernovae is so large that all the gas is expulsed from the galaxy, and the star formation stops. Being able to model the CMR has been very important for our understanding of galaxy formation. We are now however in a position that we can go one step further, and ask ourselves how the abundances of individual elements varies as a function of or luminosity.
We know that the strength of the Mg2 feature depends strongly on the Mg abundance (Worthey 1998), so the fact that there is a good correlation between Mg2 and or luminosity tells us that the Mg-abundance increases with that parameter. Colours don’t contain much information about individual element-abundances, except that blue colours, through line blanketing, depend very much on the abundance of Fe-peak elements, which would imply that the Fe-elements would be a strong function as well of . Do we know whether the abundances of other elements also correlate strongly with ?
High-quality measurements of elements other than Mg are scarce, because of the high signal-to-noise required, and the difficulty associated with calibrating indices like Fe and H onto the Lick system (Faber et al. 1985, Gorgas et al. 1993, Worthey et al. 1994). Recently Fisher, Franx & Illingworth (1996) and Jørgensen (1997) published Fe and data for a reasonably large number of galaxies. Although in both cases the scatter in the Fe – relation is large, it is smaller in the data of Jørgensen (1997). In Fig. 1a we show her Figure 2, displaying Mg2, Fe and H as a function of . If, as she claims, the scatter is larger than the instrumental scatter, it would mean that Fe cannot be a simple function of metallicity, like Mg2, but that there has to be a second parameter, most likely the Mg/Fe abundance ratio. This parameter cannot be the age, because the galaxies in Jørgensen (1997) are early-type galaxies in clusters, which fall well onto their CMR. Her interpretation however might not be correct. Recently, Kuntschner (1998) published some high-quality data of the Fornax cluster (see also Kuntschner & Davies 1998). As a comparison we have plotted them in Fig. 1b. He showed that for 1.9 the scatter in Fe3’, an index very similar to Fe, and in H is smaller or comparable to the scatter in Mg2. This is a very important result, implying that in Fornax Fe, just like Mg2, depends only on , not on a second parameter. Since Kuntschner’s signal-to-noise is much larger than Jørgensen’s, it looks as if the observational scatter in Jørgensen (1997) has been underestimated. If this is not the case, it would mean that in some galaxy clusters the stellar populations are affected by a second parameter, while in others (Fornax) this would not be the case.

3. Abundance Ratios in the Centres of Galaxies
3.1. Mg and Fe
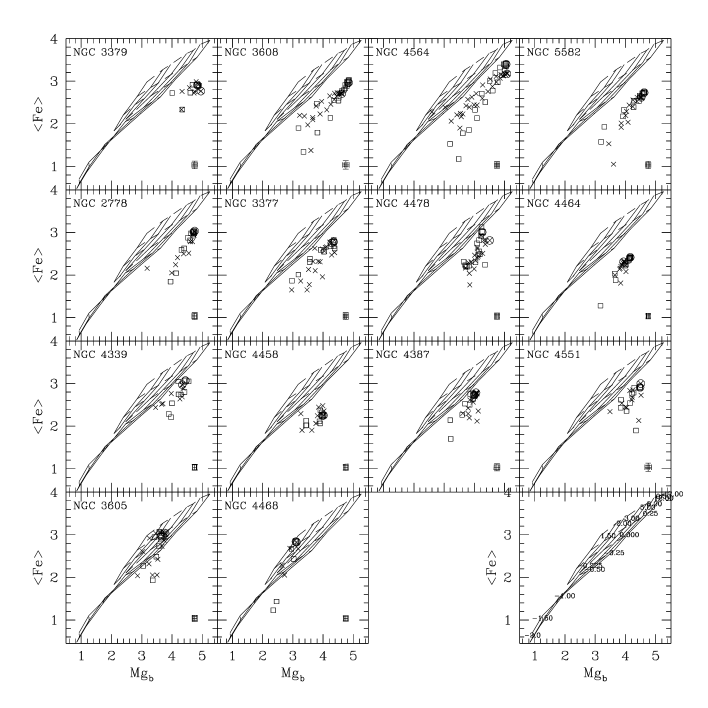
The largest dataset of nuclear line strengths in ellipticals and bulges has been the Lick sample, which was finally published by Trager et al. in 1998. It consists of measurements of almost 400 galaxies. The observations were performed with the Lick IDS, the same instrument with which the stars defining the Lick system have been observed. Worthey (1998) shows Fe vs. Mg2 for a subset of this sample in his Figure 1. In this Figure no difference can be seen between bulges of S0s and ellipticals. Generally, objects with central velocity dispersion below about 200 km/s seem to have solar Mg/Fe ratios, while the others are over-abundant in Mg. Since the Lick IDS detector suffered from several instrumental problems, the errors in the individual measurements are larger than one would like. For that reason I have made a different compilation, with data from more recent papers with high quality line strength measurements, and shown that in Fig. 2. It includes a sample of spiral bulges (Jablonka, Martin & Arimoto 1996) subdivided in a group of early-type bulges (type 0-2) and later type objects (type 3-5), a sample of bulges of S0 galaxies (Fisher et al. 1996), a mixed sample of ellipticals and S0 galaxies (Kuntschner 1998), a sample of mainly faint elliptical galaxies (Halliday 1998) and two samples of bright ellipticals. The models plotted here are from Vazdekis et al. (1996). The conclusion from Fig. 2 is again that bulges and ellipticals are indistinguishable. The models of Vazdekis et al. (1996) are compatible with those of Worthey (1994), and also for these models galaxies start deviating from their locus at Mg2 0.25. Bulges of Sa-Sc spirals, which were not included in the Lick sample, seem to have solar Mg/Fe ratios. Although there might be some small systematic offsets between the individual samples, they generally agree well with each other.. There might be a few objects, which do not follow the general trend. NGC 4458 and NGC 4464 (large filled dots, from Halliday 1998) have a very low Mg/Fe ratio, compared to other galaxies with the same Mg2. Both galaxies are faint ellipticals; NGC 4458 rotates very slowly, and has a small kinematically decoupled core (Simien & Prugniel 1998), while NGC 4464 has a v/ of about 0.5 for an ellipticity of 0.3, so (v/)∗ is close to 1 (Davies et al. 1983), so that it is probably an oblate, rotating elliptical.

The situation for our own Galactic Bulge is in agreement with external galaxies. It is estimated from high-resolution spectra that the mean [Fe/H] in Baade’s window is somewhat lower than solar (–0.25, McWilliam & Rich 1994), but that [Mg/Fe] there is 0.3 – 0.4. For such a Mg-abundance, one would expect the Mg2 index to be about 0.29, assuming an age of 17 Gyr, if one uses the Vazdekis et al. (1996) models, or less, if the bulge would be younger. Assuming that the bulge is indeed old, it will lie in Fig. 2 in the region where galaxies are over-abundant in Mg w.r.t. Fe.
3.2. Other elements
Worthey (1998) extensively summarises our knowledge about the relative abundance of metals other than Mg in giant ellipticals and in the Galactic Bulge. Although it appears that the situation concerning the elements Sc, V and Ti is very complicated and confusing, there are about half a dozen other elements for which we know something about their behaviour in giant elliptical galaxies. In Table 1 I have schematically summarised our knowledge about them. All the information has been obtained from various Lick indices, by comparing measured line strengths with the values that one expects based on stellar population models. As Worthey (1998) mentions, there are several differences in element abundances between giant ellipticals and our Bulge, which implies that there must have been differences in their formation processes. Especially in the case of N this is striking: while in the Bulge the abundance of CN is generally lower than solar, in giant ellipticals this is the opposite. It seems that [C/Fe] 0 in ellipticals (from the C24668 line) and in our Bulge (Worthey 1998), so that it is thought that N is depleted in our Galaxy and overabundant in giant ellipticals. Peculiar is also that [O/Fe] 0 (McWilliam & Rich 1994), since one would expect that O, an -element, would follow Mg. McWilliam & Rich (1994) however warn us that the only stars for which they could measure O are at the tip of the RGB, where their abundances might not be representative of the Bulge because of metal-enrichment in the star itself. More measurements of O-abundances would be very welcome.
| [X/Fe] in | |||
|---|---|---|---|
| Element X | Giant Ell. | Gal. Bulge | Gal. Halo |
| C | Solar | Solar ? | Solar |
| N | 0 | 0 | 0 |
| O | Unknown | Solar ? | 0 |
| Mg | 0 | 0 | 0 |
| Na | 0 | 0 | 0 |
| Ca | 0 ? | Solar | 0 |
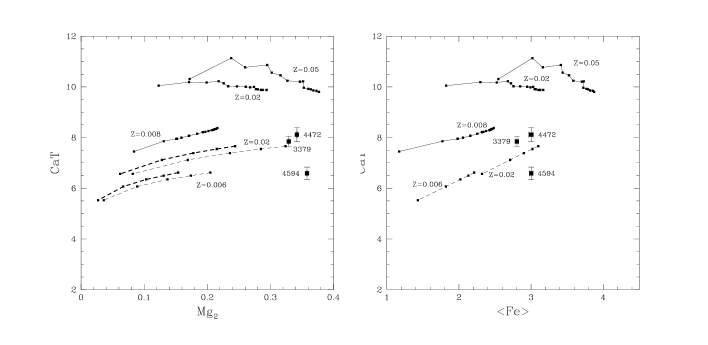
Here I would like to revisit our ideas about the [Ca/Fe] abundance ratio in giant ellipticals. The Lick system has two indices which can be used to measure the Ca abundances in galaxies: Ca 4227 and possibly Ca 4455. Both are faint, narrow features that are difficult to measure in giant ellipticals, because of the large correction for velocity broadening that one has to apply to measure them. Vazdekis et al. (1997), using high signal to noise spectra of three giant early-type galaxies, found that the measured Ca 4227 in all of them was much lower than expected from their and also Worthey (1994)’s stellar population model. Their Fig. 13 nicely illustrates how enormous the velocity dispersion correction is here. An independent confirmation of this result comes from observations of the NIR Ca II triplet (CaT) of the same 3 galaxies. We observed them using 2d-FIS, an Integral Field Spectrograph on the 4.2m WHT at La Palma, using a fibre bundle to feed the light from the Cassegrain focus to the slit of the ISIS double spectrograph (Peletier et al. 1999). Details about the instrument are given in Arribas, Mediavilla, & Rasilla (1991). In Fig. 3 our central measurements are plotted. Using the system of Díaz, Terlevich & Terlevich (1989) to define the band-passes, it was found that the CaT equivalent width is less strong than predicted by the models of Vazdekis et al. (1996) with solar Ca/Fe ratios (see also Fig. 3). Although those models were based on the stellar library of Díaz et al. (1989), which doesn’t fully cover the range of metallicities of giant ellipticals, the main conclusions will not change. Also, the same result is obtained if the models of García-Vargas, Mollá & Bressan (1998) are used. Our observations of the CaT however are in good agreement with Terlevich, Díaz & Terlevich (1990).
How to explain this apparent under-abundance of Ca? It is possibly that the effect is entirely caused by a problem in calculating the models. Idiart, Thevenin & de Freitas Pacheco (1997) and also Borges et al. (1995) point out that most models calculate integrated spectra by summing linear combinations of observed spectra of standard stars, assuming that [Ca/Fe] = 0 for those standard stars. Idiart et al. however obtained a separate library of standard stars, determined Ca, Mg and Fe abundances for each star, and calculated integrated indices using those individual abundances. Applying their models (Fig. 3) they find that [Ca/Fe] in the three galaxies is solar. This is however still peculiar, since Ca is an -element, which properties should follow closely those of Mg. Since the library of Idiart et al. (1997) also is rather limited, it is very important to obtain a stellar library of the size of the Lick library in the region of the CaT, to be able to interpret this important line index, which can also be used to constrain the IMF in galaxies. Together with the group at the Universidad Complutense in Madrid we are currently working on providing such a library (Cenarro et al. 1999, in preparation).
4. Line Strength Gradients in Galaxies
Line strength gradients have been presented by various authors (e.g. González 1993, Davies, Sadler & Peletier 1993, Carollo, Danziger & Buson 1993, Fisher, Franx & Illingworth 1995, 1996, Vazdekis et al. 1997), but only for the Mg2 and Mgb indices reasonably high quality measurements are available in the literature for a sufficiently large sample, and possibly also for Fe and H. Gradients in elliptical galaxies in Fe and Mg indices are generally following tracks with constant [Mg/Fe], which means that for many galaxies the gradients are steeper than the line linking galaxy nuclei (e.g. Worthey et al. 1992, Davies et al. 1993). New, excellent quality data by Halliday (1998, Figure 4) confirm this also for low luminosity ellipticals. Current data seems to imply that Mg/Fe within all galaxies is constant. The behavior of Mg vs. Fe seems to be the same in bulges and disks. Fisher et al. (1996) find that in S0 galaxies the radial gradients in Mg2 and Fe are smaller along the major axis than on the minor axis, implying that the gradients in the disk are smaller than those in the bulge. However, in the Mg2 vs. Fe diagram the galaxies have the same slope, on both major and minor axis.
Information about abundance gradients in other elements is limited. Vazdekis et al. (1997) present gradients in about 20 lines for the three above mentioned galaxies. They find that the radial gradients can be explained well by gradients in the overall metallicity. Much more work however has to be done to investigate gradients in, e.g., bulges and smaller elliptical galaxies.
Recently it has become possible to make reliable line strength maps in two dimensions, using Integral Field Spectrography. This offers an exciting range of new possibilities. For example, in galaxies with kinematically decoupled cores it can be investigated whether for example Mg/Fe in the decoupled core is different from the ratio in the rest of the galaxy, giving clues to the origin of the decoupled core. In Peletier et al. (1999) one galaxy with a decoupled core is included, the Sombrero galaxy, which has a rapidly rotating inner disk (e.g. Wagner, Bender & Dettmar 1988). In Fig. 5 we show the Mg2 and Fe maps in an inner field of 8.2′′ 11′′. The continuum intensity is shown as well. The figure shows that Mg is enhanced in the inner disk, compared to the bulge, and that Fe is almost not enhanced (see also Emsellem et al. 1996). The noise however in the Fe image is still so large that it cannot be established whether the Mg/Fe ratio itself in the inner disk has gone up. This galaxy shows, together with other cases in the literature (e.g. NGC 4365, Surma & Bender 1995, NGC 7626, Davies et al. 1993) that the central Mg abundance in galaxies with kinematically decoupled cores increases sharply, but up to now Mg/Fe seems to remain constant.
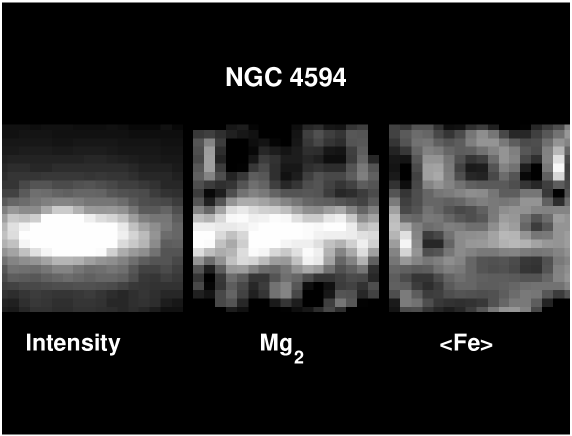
The inner disk also shows an increased H line strength, while the CaT has a similar behaviour as Fe (Peletier et al. 1999). Although these data are still rather noisy for this purpose, it is expected that much better data will become available soon from the new, wide-field (33′′ 41′′) integral field spectrograph SAURON (PIs R. Bacon, P.T. de Zeeuw and R.L. Davies) on the WHT.
5. What determines the Abundance Ratios in Galaxies?
From the previous sections we can draw the following conclusions:
-
•
Small galaxies (Mg2,c 0.22, 150 km/s) have solar Mg/Fe ratios, large galaxies (Mg2,c 0.28, 225 km/s are overabundant in Mg.
-
•
There is no difference in the Mg/Fe ratio between ellipticals and bulges of the same velocity dispersion (or Mg2,c value).
-
•
Within a galaxy Mg/Fe appears to remain constant.
It is thought that the reason the Mg/Fe ratio from galaxy to galaxy varies, is that the ratio of the number of supernovae Type II vs. Type Ia can vary. SNe Type II occur in massive stars, and produce large amounts of light elements. SNe Type Ia come from binary accretion onto white dwarfs, and produce relatively much more Fe-peak elements (see e.g. Pagel 1998). Since the lifetime of the progenitors of SNe Type II is very short, there is a period of a few times 108 years from initial star formation in which enrichment through SNe Type II dominates (Worthey 1998). The most popular scenarios to vary this ratio of the two SNe types as a function of galaxy size (or velocity dispersion) are
-
•
the formation time-scale, that should be shorter in large galaxies
-
•
a variation in the IMF, such that large galaxies have a relatively larger fraction of massive stars.
Although it is difficult to reject the first scenario, there are various reasons why I would prefer the second. If the Mg/Fe ratio would be determined by the formation time-scale, then bulges and ellipticals would have had to form the majority of their stars on the same time-scale. Clearly this would predict that disks, in which the star formation is slow, would have lower Mg/Fe ratios. Although no good measurements of disks are available at present, the measurements by Fisher et al. (1996), which show no difference in Mg/Fe between major and minor axis in S0 galaxies, do not favour this scenario. Central disks (e.g. in the Sombrero) have high, rather than low Mg/Fe ratios. Secondly, it would be very difficult to form the brightest galaxies (with high Mg/Fe ratios) in an hierarchical way, on time-scales of Gyrs, since SNe Type Ia would lower the Mg/Fe of the gas, and make it very difficult to reach large Mg/Fe ratios. For example, the central disk of the Sombrero should have formed very fast from gas that was not very metal rich before the last merger event.
The second option seems more favourable, although it also has its difficulties. If Mg/Fe would be a function just of one variable, e.g., velocity dispersion (or escape velocity, as suggested by Franx & Illingworth 1990), then this scenario would not be able to explain the line strength gradients in galaxies, since it seems that for the same Mg abundance Mg/Fe in the outer parts of bright galaxies is generally lower than Mg/Fe in the centres of faint galaxies (gradients are steeper than the line connecting nuclei). To also be able to explain the gradients we will modify this scenario: the IMF, which mainly determines the enrichment of the elements, has to be dependent only on the mass of the galaxy as a whole. How realistic is this scenario? Although Elmegreen (these proceedings) claims that the IMF is generally universal, there are indications in some starburst galaxies that the IMF there is skewed towards high mass stars (Kennicutt 1998, p. 71). At present we can’t confirm, nor rule out this second scenario. It is however capable of explaining the current observations rather easily, much better than the first scenario.
The hot gas fraction, both in clusters of galaxies and in individual objects, might further constrain chemical enrichment models of galaxies. The measurements in the ISM of elliptical galaxies however indicate very low Fe-abundances (0.1 – 0.4 times solar, Arimoto et al. 1997), which seems inconsistent with the measurements from stellar spectra. For that reason we have to wait until the abundances from X-ray emssion lines are better understood (see also Barnes, these proceedings).
6. The Need for Better Stellar Models
Since abundance ratios in galaxies can only be obtained through detailed comparisons with stellar models, it is crucial that the models are up to date. At present, there are several stellar population models that predict integrated line strength indices on the Lick system. The models do not differ too much from each other (Worthey 1994, Bruzual & Charlot (see Leitherer et al. 1996), Vazdekis et al. 1996, Tantalo et al. 1996, Borges et al. 1995). Most of them use the stellar tracks of the Padova group (Bressan, Chiosi & Fagotto 1994). None of them however takes into account the fact that if the abundance ratios in the stars are non-solar, the stellar parameters, like effective temperature and gravity, might be different. There have been some papers studying how stellar isochrones change as a function of the Mg/Fe ratio for solar or larger metallicities (Weiss, Peletier & Matteucci 1995, Barbuy 1994). The conclusion of Weiss et al. is that the isochrones basically do not change, if the total metallicity (i.e. the mass fraction of elements heavier than He) remains constant. This is consistent with Barbuy (1994). If this result is reliable, isochrones with non-solar abundance ratios are not necessary, as long as the abundance ratios are taken into account in the fitting functions, which are used to calculate the line indices. This result is in agreement with Salaris, Chieffi & Straniero (1993) for lower metallicities. However, in a new paper Salaris & Weiss (1998), using new opacities, find that for Z=0.01 (their largest metallicity) -enhancement, even while keeping the total metallicity constant, does change properties like the Main Sequence Turnoff and the RGB colour significantly. It is important to find out why this result is in contradiction with previous work.
The results of Idiart et al. (1997), who showed that very different Ca-abundances are obtained for models of integrated stellar populations if the Ca-abundance of individual stars is taking into account in the fitting functions, indicate that accurate fitting functions are crucial. It is not expected that the models for Fe and Mg2 will change much, since in Weiss et al. (1995) it is shown that if one takes solar neighbourhood stars to calculate the fitting functions for Mg2 and Fe, the integrated indices are very similar to the ones that one obtains when determining the fitting functions from Galactic Bulge stars. It is clear however, that the next generation of stellar population model will have to include fitting functions determined from as many stars as possible, using abundance ratios calculated for each star individually. Using 8m telescopes, it should be possible to obtain spectra of stars covering the parameter space of temperature, gravity, metallicity and some abundance ratios, that would be required to do this.
7. Summary
I discuss the evidence for abundance ratios in galaxies, supplementing the recent review by Worthey (1998). My main conclusions are:
-
•
The scatter for early-type galaxies in the relations between Fe and H vs. velocity dispersion is small, comparable to the scatter in the Mg2 and colour vs. relation.
-
•
Small galaxies (Mg2,c 0.22, 150 km/s) have solar Mg/Fe ratios, large galaxies (Mg2,c 0.28, 225 km/s are overabundant in Mg. There is no difference in the Mg/Fe ratio between ellipticals and bulges of the same velocity dispersion (or Mg2,c value). Within a galaxy Mg/Fe appears to remain constant.
-
•
We know very little known about the behaviour of other elements (see Worthey 1998), although [Ca/Fe] in giant ellipticals appears to be solar, contrary to what one would expect from an -element.
-
•
Improved stellar population models, using stellar evolutionary tracks with non-solar abundance ratios and fitting functions using abundance ratios determined for each standard star separately, would be very welcome to calculate accurate abundance ratios.
Acknowledgments.
I like to thank Claire Halliday, Alejandro Terlevich and Harald Kuntschner for communicating results in advance of publication, and John Beckman for organising an interesting meeting.
References
Andreon, S., Davoust, E., Michard, R., Nieto, J.L. & Poulain, P., 1996, A&AS, 116, 429
Arimoto, N., & Yoshii, Y. 1987, A&A, 173, 23
Arimoto, N., Matsushita, K., Ishimaru, Y., Ohashi, T. & Renzini, A., 1997, ApJ, 477, 128
Arribas, S., Mediavilla, E. & Rasilla, J.L., 1991, ApJ, 369, 260
Barbuy, B., 1994, ApJ, 430, 218
Bender, R., Burstein, D., & Faber, S. M. 1993 ApJ, 411, 153
Bower, R.G., Lucey, J.R. & Ellis, R.S., 1992, MNRAS, 254, 601
Borges, A.C. Idiart, T.P., de Freitas Pacheco, J.A. & Thevenin, F., 1995, AJ, 110, 2408
Bressan, A., Chiosi, C & Fagotto, F., 1994, ApJS, 94, 63
Caldwell, N., Rose, J.A., Sharples, R.M., Ellis, R.S. & Bower, R.G., 1993, AJ, 106, 473
Carollo, C.M., Danziger, I.J. & Buson, L., 1993, MNRAS, 265, 553
Davies, R.L., Efstathiou, G., Fall, S.M., Illingworth, G. & Schecter, P.L., 1983, ApJ, 266, 41
Davies, R.L., Sadler, E.M. & Peletier, R.F., 1993, MNRAS, 262, 650
Díaz, A.I., Terlevich, E. & Terlevich, R., 1989, MNRAS, 239, 325
Emsellem, E., Bacon, R., Monnet, G. & Poulain, P., 1996, A&A, 312, 777
Faber, S.M., Friel, E.D., Burstein, D. & Gaskell, C.M., 1985, ApJS, 57, 711
Fisher, D., Franx, M., & Illingworth, G. D. 1995, ApJ, 438, 539
Fisher, D., Franx, M., & Illingworth, G. D. 1996, ApJ, 459, 110
Franx, M. & Illingworth, G.D., 1990, ApJ, 359, L41
García-Vargas, M.L., Mollá, M. & Bressan, A., 1998, A&A, 130, 513
González, J.J., 1993, Ph.D. Thesis, University of California, Santa Cruz
Gorgas, J., Faber, S.M., Burstein, D., González, J.J, Courteau, S. & Prosser, C., 1993, ApJS, 86, 153
Halliday, C., 1998, Ph.D. Thesis, University of Durham
Idiart, T.P., Thevenin, F., de Freitas Pacheco, J.A., 1997, AJ, 113, 1066
Jablonka, P., Martin, P. & Arimoto, N, 1996, AJ, 112, 1415
Jørgensen, I., 1997, MNRAS, 288, 161
Kennicutt, R., 1998, in Galaxies: Interactions and Induced Star Formation, eds. D. Friedli, L. Martinet & D. Pfenniger (Springer, Berlin), p. 1
Kuntschner, H., 1998, Ph.D. Thesis, University of Durham
Kuntschner, H. & Davies, R.L., 1998, MNRAS, 295, L29
Leitherer, C., et al., 1996, PASP, 108, 996
McWilliam, A., & Rich, R.M., 1994, ApJS, 91, 749
Pagel, B.E.J., 1998, Nucleosynthesis and Chemical Evolution of Galaxies, Cambridge Univ. Press
Peletier, R.F., 1989, Ph.D. Thesis, University of Groningen
Peletier, R.F., Vazdekis, A., Arribas, S., del Burgo, C., García-Lorenzo, B., Gutiérrez, C., Mediavilla, E. & Prada, F., 1999, submitted to MNRAS
Salaris, M., Chieffi, A. & Straniero, O., 1993, ApJ, 414, 580
Salaris, M. & Weiss, A., 1998, A&A, 335, 943
Sandage, A.R. & Visvanathan, N., 1978, ApJ, 225, 742
Schweizer, F. & Seitzer, P., 1992, SJ, 104, 1039
Simien, F. & Prugniel, Ph., 1998, A&AS, 131, 287
Surma, P. & Bender, R., 1995, A&A, 298, 405
Tantalo, R., Chiosi, C., Bressan, A. & Fagotto, F., 1996, A&A, 311, 361
Terlevich, A., 1998, Ph.D. Thesis, University of Durham
Terlevich, E., Díaz, A.I. & Terlevich, R., 1990, MNRAS, 242, 271
Terlevich, R., Davies, R.L., Faber, S.M. & Burstein, D., 1981, MNRAS, 196, 381
Trager, S.C., Worthey, G., Faber, S.M., Burstein, D. & González, J.J., 1998, ApJS, 116, 1
Vazdekis, A., Casuso, E., Peletier, R.F. & Beckman, J.E., 1996, ApJS, 106, 307
Vazdekis, A., Peletier, R.F., Beckman, J. & Casuso, E., 1997, ApJS, 111, 203
Wagner, S.J., Bender, R. & Dettmar, R.-J., 1989, A&A, 215, 243
Weiss, A., Peletier, R. F., & Matteucci, F. 1995, A&A, 296, 73
Wheeler, J.C., Sneden, C., & Truran, J.W. 1989, ARA&A, 27, 279
Worthey, G., 1994, ApJS, 95, 107
Worthey, G. 1998, PASP, 110, 888
Worthey, G., Faber, S. M., González, J. J., & Burstein, D. 1994, ApJS, 94, 687
Worthey, G., Faber, S. M., González, J. J. 1992, ApJ, 398, 69