The X-ray afterglow of GRB980519
Abstract
Over a total of 20 gamma-ray bursts localized with arcmin accuracies, GRB980519 represents the 13th detected by the BeppoSAX Wide Field Cameras (WFCs). An X-ray TOO observation performed by the BeppoSAX Narrow Field Instruments (NFIs), starting about 9.5 hours after the high energy event, revealed X-ray afterglow emission in the 0.1–10 keV energy range. The flux decay was particularly fast with a power-law index of . This is the fastest decay so far measured. Signs of bursting activity are evident. The power-law spectral index of is quite soft but not unique among GRB afterglows.
optical emission was detected as soon as 8 hours after the GRB and the power-law flux decay in all these bands were all consistent with . As for the X-ray, this is the fastest of all the 9 optically identified afterglows but GRB980326. A candidate host galaxy with magnitude has been reported and variable radio emission detected.
Key Words.:
Gamma-rays: bursts; Gamma-rays: observation; X-rays: observation1 Introduction
GRB980519 was detected on 1998 May 19, 12:20:13 UT by CGRO–BATSE and BeppoSAX–GRBM. It was in the field of view of the BeppoSAX–WFC 2, allowing an estimate of its position with a 3 arcmin error circle at R.A. = 23h22m15s Dec. = (J2000). The GRBM light curve (lasting s) together with the spectral evolution in the 40–700 keV range is shown in Fig. 1. The soft–hard–soft evolution is evident in the plot. In the 2–27 keV WFC band a similar behaviour is observed but the light curve is much more structured than the high energy one and it lasts for s; the emission starts s before the GRB trigger and stops s later (in ’t Zand et al. 1998).
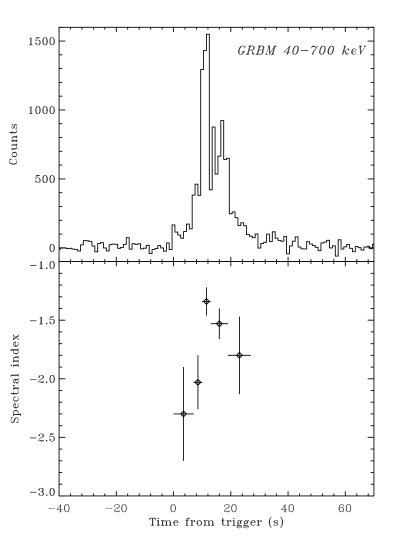
The average spectrum of the GRBM data can be well fitted with a single power-law with a photon spectral index () with . The 40–700 keV fluence (over 27 s) is erg cm-2 and the hardness ratio . Description of the method adopted for GRBM spectra deconvolution is reported by Amati et al. (this workshop).
2 BeppoSAX NFIs observation and discussion
A follow-up observation performed with the BeppoSAX NFIs started less than 10 hrs after the trigger and a weak, rapidly decaying X-ray source was detected (Nicastro et al. 1998a). The decay was not monotonic, but the low counting rate did not allow us to reconstruct a detailed light curve.
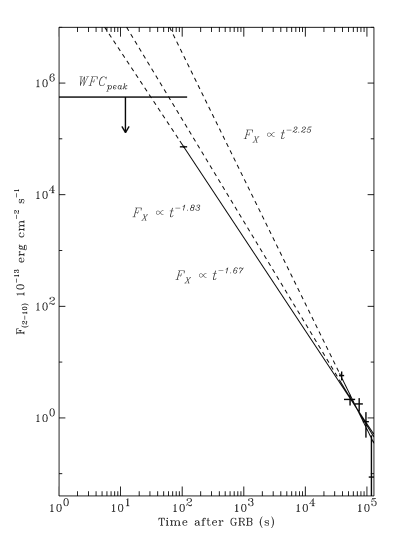
Figure 2 shows the 2–10 keV (MECS) flux decay and three possible power-law decay fits . It can be seen that constraining the fit to connect with the last part of the WFC detected flux, gives a minimum decay slope . On the other hand, if the first point of the NFIs observation is not a peak superimposed to the monotonic decay, then we have . This can be considered a maximum decay slope. It is realistic to suppose that the real slope is close to obtained excluding the first NFIs point from the fit. In any case, this is the most rapid decay for all the 13 GRB afterglows detected so far, typical values ranging between .
Spectral fitting of the 0.1–10 keV LECS+MECS data using an absorbed power-law gave a quite soft photon index of and in the range cm-2 (see Fig. 3). The 0.1–2 keV flux is erg cm-2 s-1 while the 2–10 keV flux is erg cm-2 s-1. Further details are given in Nicastro et al. (1998b).

Optical observations, started as early as 8 hours after the GRB, resulted in the detection of the afterglow (OT) in bands. The power-law decays in all these bands were all consistent with . Deep observations performed days after the burst with the 6-m telescope of the SAO–RAS revealed that at the position of the OT there is a faint object, possibly a galaxy, of magnitude (Sokolov et al. 1998b). It is worth to note that for all 9 optically identified GRBs, there are indications of the presence of an underlying host galaxy (Hogg & Fruchter 1998; Sokolov et al. 1998a).
The afterglow was also detected in the radio band by the VLA (Frail et al. 1998) at R.A. = 23h22m Dec. = (J2000, ).
Acknowledgements.
This research is supported by the Italian Space Agency (ASI) and Consiglio Nazionale delle Ricerche (CNR). BeppoSAX is a major program of ASI with participation of the Netherlands Agency for Aerospace Programs (NIVR). All authors warmly thank the extraordinary teams of the BeppoSAX Scientific Operation Center and Operation Control Center for their enthusiastic support to the GRB program. K. H. is grateful to the US SAX Guest Investigator program for support.References
- (1) Frail D.A., et al. 1998, GCN circ. #89
- (2) Hogg D.W., Fruchter A.S. 1998, astro-ph/9807262
- (3) Nicastro L., et al. 1998a, IAUC 6912
- (4) Nicastro L., et al. 1998b, in preparation
- (5) Sokolov V.V., et al. 1998a, GCN circ. #147
- (6) Sokolov V.V., et al. 1998b, GCN circ. #148
- (7) in ’t Zand J.J.M., et al. 1998, in preparation