A measurement of from Ryle Telescope, ASCA and ROSAT observations of Abell 773
Abstract
We present new Ryle Telescope (RT) observations of the Sunyaev-Zel’dovich (SZ) decrement from the cluster Abell 773. The field contains a number of faint radio sources that required careful subtraction. We use ASCA observations to measure the gas temperature and a ROSAT HRI image to model the gas density distribution. Normalizing the gas distribution to fit the RT visibilities returns a value of of (1- errors) for an Einstein-de-Sitter universe, or for a flat model with . The errors quoted include estimates of the effects of the principal errors: noise in the SZ measurement, gas temperature uncertainty, and line-of-sight depth uncertainty.
keywords:
cosmic microwave background – cosmology:observations – X-rays – distance scale – galaxies:clusters:individual (A773)1 Introduction
We have previously reported the detection of a Sunyaev-Zel’dovich (SZ) decrement [Sunyaev & Zel’dovich 1972] towards the cluster Abell 773 using the Ryle Telescope (RT) [Grainge et al 1993]. (The SZ effect in this cluster has also been mapped by the millimeter array of the Owens Valley Radio Observatory [Carlstrom, Joy & Grego 1996].) The RT observations of Abell 773 form part of a continuing programme to observe an X-ray luminosity-limited sample of rich, intermediate-redshift clusters in order to measure by combining SZ and X-ray observations [Jones et al.2001]. Such programmes (e.g. Reese et al., 2002; Mason, Myers and Readhead, 2001; see also Birkinshaw, 1999 for a review) are direct measurements of free from distance-ladder arguments.
In Grainge et al. 1993 we did not calculate an estimate of because no suitable X-ray image of A773 and no estimate of its gas temperature existed. A ROSAT HRI image and ASCA spectroscopic data have since become available, and we have also made additional RT observations. These now enable us to make an estimate of the Hubble constant from this cluster, which, when combined with other clusters from the sample, will give an estimate of unbiased by the individual shapes and orientations of the clusters.
2 Ryle Telescope observations and source subtraction
The RT [Jones 1991] is an east–west synthesis telescope of 13-m antennas with a bandwidth of 350 MHz and an average system temperature for these observations of 65 K at an observing frequency of 15.4 GHz. We used five antennas in a compact configuration, giving two baselines of 18 m, three of 36 m, and five more out to 108 m. The short baselines alone are sensitive to the SZ signal; the longer ones are used to recognize and subtract the radio sources in the field that would otherwise mask the SZ decrement. We have made a total of 30 12-h observations of A773, each with the pointing centre (J2000). Phase calibration using 0859+470 and flux calibration using 3C 48 and 3C 286 were carried at as described in Grainge et al [Grainge et al 1993]. Similarly, we used the Postmortem package [Titterington 1991] to flag the data for interference and antenna pointing errors, and to weight them in accord with the continuously monitored system temperature of each antenna. As a standard check, we used the Aips package to make a map of each 12-h run and then combined the data.
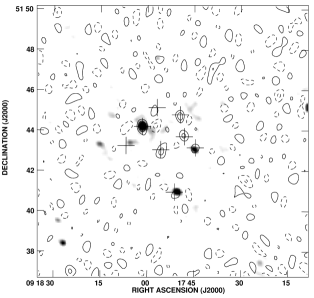
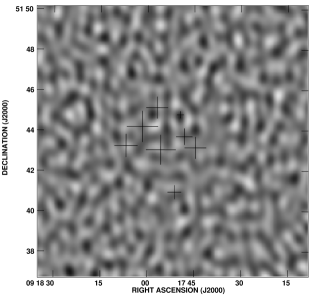
We removed radio sources from the data by a simultaneous maximum-likelihood fit to several point sources and the SZ effect using a technique described by Grainger et al [Grainger et al 2002]. We use a model for the SZ signal as a function of baseline that is based on the -model fit to the X-ray image described below (Section 3). We simultaneously fit flux densities for trial sources whose initial positions are determinied both from a map made from just the long-baseline data (), and from a VLA 1.4-GHz image of the cluster field (Figure 1). This allows us to fit the optimum flux densities of sources whose existence we know of from the VLA image but which would not give a significant detection from the RT data alone. The postitions and fitted flux densities are given in Table 1. The image made from the long () source-subtracted baselines is consistent with noise (Figure 2).
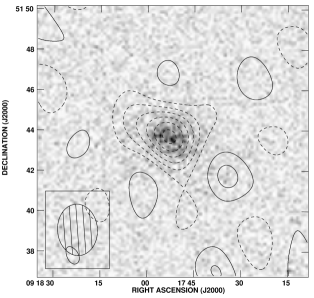
To image the decrement, we removed the sources in Table 1 from all the visibilities and made a short-baseline map from baselines shorter than 1 k, and CLEANed this. The resulting image is shown in Figure 3. The decrement is of with a noise (1-) of ; the beam is arcsec FWHM. Also shown is the X-ray image of the cluster; it can be seen that the alignment with the X-ray image is very good. The extension of the SZ image to the north-east is of marginal significance. The magnitude of the decrement is consistent with that of Jy, in the same beam, reported in Grainge et al [Grainge et al 1993].
An alternative way of looking at the data is shown in Figure 4, which shows the real part of the source-subtracted visibilities binned radially, along with the best-fitting model based on the X-ray data. These data have the advantage, unlike the image pixels, of having independent gaussian noise on each point; it is these that are used in the fitting for .
3 X-ray observations and fitting
We measure the gas temperature from ASCA observations on 1994 April 29 of 46240 s (GIS) and 39904 s (SIS), using standard XSPEC tools. Times of high background flux were excluded and both GIS and SIS data were used. We took the Galactic absorbing column density predicted by Dickey and Lockman [Dickey & Lockman 1990] in the direction of A773 of H atoms m-2. Using a Raymond-Smith model, we find a temperature of keV (-confidence error bounds) and a metallicity of 0.25 solar. The 2–10 keV flux from A773 is x W m-2. Our temperature estimate is consistent with that of Allen and Fabian [Allen & Fabian 1998] who find a temperature of keV (-confidence error bounds).
For the X-ray surface-brightness fitting we used a ROSAT HRI image of A773 with an effective exposure of 16518 s obtained on 13–15 April 1994 and analysed using standard ASTERIX routines. We calculate the ROSAT HRI count rate, given our estimates of metallicity and Galactic column and with the K-correction appropriate to the redshift of A773, to be counts s-1 from a cube of gas of electron density at the temperature of A773 and at a luminosity distance of 1 Mpc.
We then fitted an ellipsoidal King profile to the X-ray image. Since the high spatial resolution of the HRI leads to a low count rate per pixel, we use Poisson rather than Gaussian statistics to fit for the measured count in each pixel. For counts measured at position , and for a mean number of counts predicted by the model given parameters (such as core radius), the probability of obtaining counts is
and the most likely value of can be obtained in a computationally efficient way by maximizing
We fitted an ellipsoidal King profile to the HRI data with and as the perpendicular angular sizes in the plane of the image, assuming that the length along the line of sight is the geometric mean of the other two. We find and , with the major axis at position angle , , and central electron density where km s-1 Mpc-1. Fig 5 shows the HRI image, the model, and the residual image with the best model subtracted. To assess the goodness of fit, we made 50 realisations of the image with the appropriate Poisson noise added, and calculated the mean and standard deviation of their Poisson likelihoods. The likelihood of the observed HRI image is 0.32 standard deviations from the mean; we therefore conclude that the fit is good and the cluster is well represented by a model.
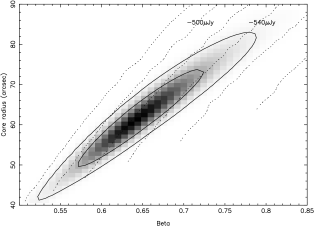
There is a strong degeneracy in the fit between and ; however this has little effect on the comparison with the SZ data and the derived value of . Figure 6 shows the likelihood contours for the fit in the – plane, marginalised over and using the best-fit value of the axial ratio (which is very well constrained). Overlaid are the contours of predicted mean observed SZ flux density on the shortest RT baseline. It can be seen that despite the degeneracy between and , the range of SZ flux densities corresponding to the 1- limits of the model fit is only . Since the SZ flux density varies as , this corresponds to a error in due to the model fitting. This lack of sensitivity to the – degeneracy is characteristic of observations that are sensitive to spatial frequencies around the cluster core size (see eg Reese et al [Reese et al 2000]) and contrasts with the sensitivity to the model fitting of measurements that measure only lower spatial frequencies (eg Birkinshaw & Hughes[Birkinshaw & Hughes 1994]).
4 estimation
To measure , we compared the real SZ data with a simulation of the SZ effect from the X-ray gas model. We use the expression of Challinor & Lasenby [Challinor & Lasenby 1998] to provide a relativistic correction to the standard non-relativistic SZ expression; in the case of A773, the effect is to increase our estimate of the -parameter by . We then simulated RT observations of the SZ effect due to the model gas distribution and to compared these with the real source-subtracted RT visibilities on the same baselines, and adjusted to get the best fit. Using our temperature of keV we find km s-1 Mpc-1, assuming an Einstein-de-Sitter universe. The - error quoted is that due solely to noise in the SZ data. For the best fit model, the corresponding central density is m-3 and the central decrement K.
Grainge et al [Grainge et al 2002] consider at some length the contributions to error in the determination from A1413. The situation in A773 is very similar. The dominant contributions to the error in in A773 are from noise in the SZ measurement, from our estimation of the gas temperature and a likely error of from the uncertain line-of-sight depth. This is obtained by considering the range of axial ratios of simulated clusters that is needed to reproduce the projected axial ratio distribution observed in clusters with redshift similat to that of A773 [Grainger 2001]. Clearly this estimate is rather uncertain for a single object, but can be significantly reduced by averaging a sample of clusters with random orientations. Table 2 shows the complete error budget, and the final 1- error limits of if and if .
5 Conclusions
Using ASCA, ROSAT HRI, and RT observations of A773, we find:
-
1.
there are eight radio sources detectable in the field of the cluster that we have removed from the data, which would otherwise contaminate the measurement of the SZ effect;
-
2.
the correlated fitting errors on the shape parameters and have negligable effect on the derived value of , a feature characteristic of observations on the scale of the cluster core size;
-
3.
the estimated value of is if or if , where the 1- error bars include estimates from the main sources of error—noise in the SZ data, X-ray temperature uncertainty, and uncertain line-of-sight depth.
ACKNOWLEDGMENTS
We thank the staff of the Cavendish Astrophysics group who maintain and operate the Ryle Telescope, which is funded by PPARC. AE acknowledges support from the Royal Society; WFG acknowledges the support of a PPARC studentship; RK acknowledges support from an EU Marie Curie Fellowship.
References
- [Allen & Fabian 1998] Allen S.W., Fabian A.C., 1998, MNRAS, 297, L57
- [Birkinshaw & Hughes 1994] Birkinshaw M., Hughes J.P., ApJ, 1994, 420, 33
- [Birkinshaw 1999] Birkinshaw M., Phys.Rept. 310, 97
- [Carlstrom, Joy & Grego 1996] Carlstrom, J.E., Joy, M., Grego, L., ApJ, 456, L75 and ApJ, 461, L59
- [Challinor & Lasenby 1998] Challinor A., Lasenby A., ApJ, 1998, 499, 1
- [Dickey & Lockman 1990] Dickey J.M., Lockman F.J., 1990, Ann. Rev. Astron. Astrophys., 28, 215
- [Grainge et al 1993] Grainge, K., Jones, M., Pooley, G.G., Saunders, R., Edge, A.C., 1993, MNRAS, 265, L57
- [Grainge et al 2002] Grainge, K., Jones, M.E., Pooley, G.G., Saunders, R., Edge, A.C., Kneissl, R., 2002, MNRAS 333, 318
- [Grainger et al 2002] Grainger, W. F., Das, R., Grainge, K., Jones, M.E., Kneissl, R., Pooley, G.G., Saunders, R., 2002, MNRAS, 337, 1207
- [Grainger 2001] Grainger, W.F., PhD thesis, University of Cambridge, 2001
- [Jones 1991] Jones M.E., 1991, in Cornwell T.J., Perley R., eds, Proc. IAU Colloq. 131, ASP Conf. Ser. 19, Radio Interferometry: Theory, Techniques and Applications. Astron. Soc. Pac., San Francisco, p. 395
- [Jones et al.2001] Jones M.E. et al., 2001, submitted to MNRAS
- [Mason, Myers & Readhead 2001] Mason, B.S., Myers, S.T., Readhead, A.C.S., 2001, ApJ, 555, L11
- [Reese et al 2000] Reese E.D, Mohr J.J., Carlstrom J.E., Joy M., Grego L., Holder G.P., Holzapfel W.L., Hughes J.P., Patel S.K., Donahue M., 2000, ApJ, 533, 38
- [Reese et al 2002] Reese E.D, Carlstrom, J.E., Joy, M., Mohr, J.J., Grego, L., Holzapfel W.L., 2002, submitted to ApJ
- [Sunyaev & Zel’dovich 1972] Sunyaev, R. A., Zel’dovich, Ya B., 1972, Comm. Astrophys. Sp. Phys., 4, 173
- [Titterington 1991] Titterington D.J., 1991, in Cornwell T.J., Perley R., eds, Proc. IAU Colloq. 131, ASP Conf. Ser. 19, Radio Interferometry: Theory, Techniques and Applications. Astron. Soc. Pac., San Francisco, p. 128
This paper has been produced using the Blackwell Scientific Publications LaTeX style file.
| Flux density /Jy | RA offset /′′ | dec offset /′′ |
| 163 | ||
| 123 | ||
| 55 | ||
| 103 | ||
| 228 | ||
| 162 | ||
| 238 | ||
| 177 |
| Source of error | Error contribution to |
|---|---|
| SZ measurement | |
| Line-of-sight depth | |
| Gas temperature | |
| Error in calculated X-ray emission constant | |
| Primary flux calibration | |
| Total (in quadrature) |