COMPTEL detection of pulsed -ray emission from PSR B1509-58 up to at least 10 MeV
Abstract
We report on the first firm detection of pulsed -ray emission from PSR B1509-58 in the 0.75-30 MeV energy range in CGRO COMPTEL data collected over more than 6 years. The modulation significance in the 0.75-30 MeV pulse-phase distribution is and the lightcurve is similar to the lightcurves found earlier between 0.7 and 700 keV: a single broad asymmetric pulse reaching its maximum 0.38 0.03 in phase after the radio peak, compared to the offset of 0.30 found in the CGRO BATSE soft gamma-ray data, and 0.27 0.01 for RXTE (2-16 keV), compatible with ASCA (0.7-2.2 keV).
Analysis in narrower energy windows shows that the single broad pulse is significantly detected up to MeV. Above 10 MeV we do detect marginally significant () modulation with an indication for the broad pulse. However, imaging analysis shows the presence of a strong 5.6 source at the position of the pulsar. To investigate this further, we have also analysed contemporaneous CGRO EGRET data ( MeV) collected over a nearly 4 year period. In the 30-100 MeV energy window, adjacent to the COMPTEL 10-30 MeV range, a source can be attributed to PSR B1509-58. Timing analysis in this energy window yields an insignificant signal of , but with a shape somewhat similar to that of the COMPTEL 10-30 MeV lightcurve. Combining the two pulse-phase distributions results in a suggestive double-peaked pulsed signal above the background level estimated in the spatial analyses, with one broad peak near phase 0.38 (aligned with the pulse observed at lower energies) and a second narrower peak near phase 0.85, which is absent for energies below 10 MeV. The modulation significance is, however, only and needs confirmation.
Spectral analysis based on the excess counts in the broad pulse of the lightcurve shows that extrapolation of the OSSE power-law spectral fit with index -1.68 describes our data well up to 10 MeV. Above 10 MeV the spectrum breaks abruptly. The precise location of the break/bend between 10 and 30 MeV depends on the interpretation of the structure in the lightcurve measured by COMPTEL and EGRET above 10 MeV.
Such a break in the spectrum of PSR B1509-58 has recently been interpreted in the framework of polar cap models for the explanation of gamma-ray pulsars, as a signature of the exotic photon splitting process in the strong magnetic field of PSR B1509-58. For that interpretation our new spectrum constrains the co-latitude to , close to the “classical” radius of the polar cap. In the case of an outer-gap scenario, our spectrum requires a dominant synchrotron component.
Key Words.:
gamma rays: observations – pulsars: individual: PSR B1509-581 Introduction
PSR B1509-58 was discovered as a 150 ms X-ray pulsar in the Einstein HRI and IPC (0.2-4 keV) data from observations performed in 1979 and 1980 of supernova remnant (SNR) MSH 15-52 (Seward & Harnden (1982)). The pulsations and the large period derivative indicated in the X-ray data were soon confirmed at radio-wavelengths (Manchester et al. (1982)), while the derived dispersion measure supports its association with the SNR. The inferred characteristic age is 1570 year and the component of the surface magnetic field perpendicular to the spin axis at the magnetic pole is Gauß, one of the highest among the steadily growing sample of radio-pulsars. Radio-data collected during an 11 yr time span showed that the pulsar did not glitch and made a detailed study of its slow-down possible (Kaspi et al. (1994)). The measured braking index was , close to expected for a dipole.
Extensive X-ray studies of PSR B1509-58 and its environment have been performed in the early eighties at soft- and medium X-ray energies using the Einstein HRI, IPC and SSS (Seward et al. (1983),1984) and MPC (Weisskopf et al. (1983)) instruments and in the late eighties using the EXOSAT ME and LE instruments (Trussoni et al. (1990)). The morphology of MSH 15-52 at X-rays is complex with at the north western rim of the SNR an excess near the H nebula RCW 89 and close to the middle of the SNR a clump containing the pulsar surrounded by a diffuse synchrotron nebula. The spectrum of the pulsar is hard with a photon power-law index of (Trussoni et al. (1990)). The pulse is broad with a duty cycle of and rather asymmetric: a sharp rise followed by a gradual decline. At soft X-ray energies ( keV) there is some indication that the broad pulse is composed of two smaller narrowly separated pulses (EXOSAT LE, Trussoni et al. (1990); ROSAT PSPC, Becker (1994)).
More recently, the results from ROSAT PSPC/HRI (Greiveldinger et al. 1995, Trussoni et al. 1996, and Brazier & Becker 1997) and ASCA (Nagase et al. 1994, Tamura et al. (1996) and Saito et al. (1997)) observations were presented. Using the high-spectral resolution of ASCA in combination with imaging (Tamura et al. (1996)) and the high-spatial resolution of the ROSAT HRI (Brazier & Becker 1997) the morphology of the remnant can be explained by the presence of several components: the pulsar itself, a non-thermal nebula powered by the pulsar with collimated outflow structures (jets) and a hot thermal plasma at RCW 89 near the end of the jet. Assuming that the synchrotron nebula surrounding the pulsar can be described in terms of a torus and jets similar to the Crab pulsar, the morphology suggests a large angle between pulsar spin axis and line of sight.
The detection of pulsed emission at hard X-rays was first reported by Kawai et al. (1991) using Ginga LAC 2-60 keV data. They found that the X-ray pulse lags the radio pulse by in phase. The spectrum of the pulsed emission could be represented by a power-law with photon index confirming its hard nature (Kawai et al. (1993)). Wilson et al. (1993a,1993b) showed that pulsed emission was even detectable in the soft -ray regime using CGRO BATSE data (20-740 keV), confirmed later by Ulmer et al. (1993) and Matz et al. (1994) using CGRO OSSE data. The OSSE/BATSE pulse phase distribution (lightcurve) showed a phase offset with respect to the radio-pulse of , slightly larger than the value obtained from the Ginga data. The OSSE spectrum above 50 keV of the pulsed emission could be described by a power-law with photon index , consistent with the spectral findings, , from the balloon-borne Welcome instrument (94-240 keV) as reported by Gunji et al. (1994). The spectral measurements by EXOSAT, Ginga, Welcome, OSSE/BATSE suggest a spectral steepening (softening) towards higher energies.
Recently, Rossi XTE absolute timing results on PSR B1509-58 were presented by Rots et al. (1998) showing high resolution pulse profiles for energies between 2 and 128 keV. A comparison of the profiles measured by RXTE (2-16 keV) and BATSE ( 32 keV) was made and a 0.03 phase shift of the BATSE lightcurve w.r.t. the RXTE lightcurve, peaking at , was found by the authors. Rots et al. (1998) also performed a pulse-phase resolved spectral analysis using PCA and HEXTE data. The photon indices of the power-law fits to the 2 - 200 keV data in various 0.05 wide phase slices within the pulse are all consistent with one single value of . This value is in line with the value of found by Kawai et al. (1991). RXTE spectral results for both the pulsed and unpulsed component are described in detail by Marsden et al. (1998): the spectrum of the pulsed component (radio phase range 0.17 and 0.53) could be represented by a power-law with index with no evidence for a spectral break seen up to keV, while the index of the unpulsed component was .
At high-energy gamma-rays ( MeV) Brazier et al. 1994 reported only upper-limits for pulsed emission using CGRO EGRET data from 3 viewing periods (VP 12, 23 and 27; see e.g. Table 1) during the all-sky survey of CGRO. A study by Fierro (1995) analysing EGRET data from Cycle I-III yielded an interesting source feature for energies above 100 MeV consistent in position with the pulsar. Timing analyses resulted in non-detections for pulsed emission in the 30-100 MeV, 100 MeV and GeV energy windows.
| VP # | Start Date | End Date | Pointing direction | Off-axis angle | Eff.Exposure | EGRET spark- | |
|---|---|---|---|---|---|---|---|
| TJD† | TJD | l() | b() | () | (3-10 MeV; ) | chamber status | |
| Cycle I | 18.70 | ||||||
| 12.0 | 8546.620 | 8560.622 | 310.7 | 22.2 | 25.2 | 8.30 | ON |
| 23.0 | 8700.598 | 8714.534 | 322.2 | 3.0 | 4.6 | 3.74 | ON |
| 27.0 | 8740.573 | 8749.589 | 332.2 | 2.5 | 12.4 | 4.55 | ON |
| 35.0 | 8840.658 | 8845.038 | 335.1 | -25.6 | 28.3 | 0.83 | ON |
| 38.0 | 8861.745 | 8866.192 | 335.1 | -25.6 | 28.3 | 1.28 | ON |
| Cycle II | 11.71 | ||||||
| 208.0 | 9020.627 | 9027.675 | 307.4 | 20.7 | 25.3 | 2.32 | ON |
| 215.0 | 9078.693 | 9083.810 | 311.7 | 22.9 | 25.5 | 4.32 | ON |
| 217.0 | 9089.577 | 9097.596 | 311.7 | 22.9 | 25.5 | ON | |
| 232.0 | 9223.612 | 9225.197 | 347.5 | 0.0 | 27.2 | 5.07 | ON |
| 232.5 | 9225.219 | 9237.590 | 347.5 | 0.0 | 27.2 | ON | |
| Cycle III | 23.97 | ||||||
| 314.0 | 9355.682 | 9368.637 | 304.2 | -1.0 | 16.1 | 9.21 | ON |
| 315.0 | 9368.656 | 9375.646 | 304.2 | -1.0 | 16.1 | 5.32 | ON |
| 316.0 | 9375.671 | 9384.606 | 309.5 | 19.4 | 23.1 | 5.39 | ON |
| 336.5 | 9568.601 | 9573.884 | 340.4 | 2.9 | 20.5 | 3.11 | ON |
| 338.0 | 9593.637 | 9595.602 | 345.0 | 2.5 | 24.9 | 0.94 | OFF |
| Cycle IV | 27.01 | ||||||
| 402.0 | 9643.633 | 9650.588 | 310.3 | -5.0 | 10.7 | 12.71 | ON |
| 402.5 | 9650.614 | 9657.588 | 306.7 | -3.8 | 13.9 | ON | |
| 414.3 | 9805.592 | 9811.587 | 347.3 | 0.6 | 27.0 | 2.70 | OFF |
| 423.5 | 9898.619 | 9908.569 | 345.8 | 13.4 | 29.2 | 3.86 | ON |
| 424.0 | 9908.592 | 9923.596 | 312.7 | 19.0 | 21.5 | 7.74 | ON |
| Cycle V | 13.49 | ||||||
| 516.1 | 10160.640 | 10163.650 | 341.1 | 5.5 | 21.8 | 1.71 | ON♠ |
| 524.0 | 10273.592 | 10287.601 | 343.1 | -3.6 | 22.9 | 7.22 | OFF |
| 529.5 | 10322.664 | 10332.579 | 345.0 | 2.4 | 24.9 | 4.56 | ON♠ |
| Cycle VI | 42.95 | ||||||
| 619.0 | 10574.621 | 10582.557 | 319.6 | -1.6 | 0.9 | 6.86 | OFF |
| 619.4 | 10588.601 | 10596.510 | 319.6 | -1.6 | 0.9 | 6.36 | OFF |
| 619.7 | 10603.617 | 10609.567 | 319.6 | -1.6 | 0.9 | 5.21 | OFF |
| 632.1 | 10728.603 | 10755.605 | 307.9 | -7.5 | 13.9 | 24.52 | OFF |
| † TJD = JD - 2440000.5 = MJD - 40000 | |||||||
| ♠ EGRET in narrow field mode; opening angle FoV is | |||||||
The detection of hard pulsed emission below keV and the non-detection above 30 MeV makes PSR B1509-58 a very interesting candidate for COMPTEL, the Compton Telescope aboard CGRO and sensitive to photons with energies between and 30 MeV. COMPTEL analysis using viewing period 23 (see Table 1) data only yielded an interesting detection of pulsed emission in the 0.75-1 MeV energy window with a pulse aligned with the pulse observed by BATSE/OSSE (Hermsen et al. (1994), Carramiñana et al. (1995)). However, a timing analysis of COMPTEL 0.75-30 MeV data from observations spread over more than 4 years yielded only a marginal detection of pulsed emission at energies below 3 MeV (Carramiñana et al. (1997)). Here, we will report on the COMPTEL timing- and spatial analyses using all available data up to and including CGRO Cycle-6 data. Prompted by our results in the highest standard energy interval (10-30 MeV) in the COMPTEL analysis, we also (re)analysed all publicly available EGRET data on this source.
2 Instrument description and observations
COMPTEL is the imaging Compton Telescope aboard CGRO and is sensitive for -ray photons with energies in the 0.75-30 MeV range. Its detection principle relies on a two layer interaction: a Compton scatter in one of the 7 upper-detector (D1) modules followed by a second interaction in one of the 14 lower-detector (D2) modules. Main measured quantities are the angles () specifying the direction of the scattered photon (from the interaction loci in D1 and D2) and the energy deposits in the D1/D2 modules where the interactions took place. From the last two quantities we can calculate the scatter angle and the total energy deposit (see for a full description Schönfelder et al. (1993)).
Its energy resolution is 5-10% FWHM and due to its large field of view of typically 1 steradian it is possible to monitor a large part of the sky simultaneously with a position determination accuracy of . The events are time tagged with an accuracy of 0.125 ms.
| Pulsar position | Validity range | |||||||
| [MJD] | [MJD/TDB] | [Hz] | [Hz/s] | [Hz/s2] | ||||
| †15 13 55.627 | -59 08 9.54 | 48522 | 49956 | 49239 | ||||
| ‡15 13 55.620 | -59 08 9.00 | 50114 | 50722 | 50418 | ||||
| † Ephemeris has been provided by V. Kaspi (private communication). | ||||||||
| ‡ Ephemeris has been been derived from radio timing data using the ATNF Parkes radio telescope. | ||||||||
| (see also http://www.atnf.csiro.au/research/pulsar/psr/archive/) | ||||||||
| The dispersion measure used in the calculation of absolute phases was . | ||||||||
In this study we selected those CGRO Cycle I-VI viewing periods for which the angle between the pointing axis (co-aligned with the COMPTEL/EGRET z-axis) and PSR B1509-58 is less than . Details for each individual observation can be found in Table 1. The last but one column specifies the effective exposure in the 3-10 MeV energy window assuming a dependency of the photon flux. The calculation took into account Earth blocking effects and utilizes the timeline information. The last column indicates the status of the sparkchamber of the EGRET high-energy (30 MeV - 30 GeV) instrument aboard CGRO. EGRET data (with the sparkchamber ON) from the first 4 CGRO observation Cycli have been retrieved from the COMPTON Science Support Center and have subsequently been used in spatial- and timing analyses.
3 COMPTEL timing analysis
3.1 Event selections
Prior to the actual timing analysis we have to specify the event selection criteria to which the events are subjected. The selection criteria applied here are the same as those in the timing analysis of PSR B1951+32 (see Kuiper 1998a) except for one selection parameter, namely , the difference angle between the calculated scatter angle and the geometrical scatter angle . The last quantity can be determined from the known source position ( (l,b)=(320321,-1162)) and the scatter direction angles . For a point-source the distribution of (i.e. the ARM-distribution) is a narrowly peaked distribution with a maximum near and a wing for positive values due to incompletely absorbed events. The imaging capabilities of COMPTEL rely on this sharp asymmetric distribution of . The relative contributions of the peak and wing, and the width of the peak are a function of input photon energy. This means that instead of fixing to a value in the range to irrespective of the selected energies, as turned out to be the optimum range from COMPTEL studies on the Crab (Much et al. (1995)) and Vela (Kuiper et al. 1998b ) pulsars, an energy window dependent ARM selection is more appropriate. In this study we have determined a priori the optimal value of for each energy window by estimating the maximum in the Signal-to-Noise vs. relation. The latter relation can be derived from a 3 dimensional () point source model for the energy window involved and the total measured 3d-event distribution in the same energy window, heavily dominated by instrumental background events (90-95%). The following energy dependent criteria on appeared to be appropriate: for the energy window 0.75-1 MeV and for the energy windows 1-3, 3-10 and 10-30 MeV. The fraction of counts from a point-source within the ARM-cut is typically . It is also worth mentioning that the ARM cut applied in the timing analysis reduces the number of events handled in the timing analysis to typically 10% of the number of events available for the imaging or spatial analysis, in which the full 3d-dataspace is employed.
For the 10-30 MeV interval we have departed from the “standard” Time of Flight (TOF) and Pulse Shape Discrimination (PSD) windows (see for a description of these event parameters Schönfelder et al. (1993)) of 113-130 and 0-110 respectively, normally applied in the timing analysis (see e.g. Kuiper 1998a) and have used the optimum TOF and PSD windows derived by Collmar et al. (1997) in their study on optimum parameter cuts using the Crab pulsar/nebula signature in the COMPTEL event space.
3.2 Pulse phase folding
Once the event selection criteria were settled we proceeded as follows: the arrival times (recorded with an intrinsic resolution of 0.125 ms) of the events passing through our selection filters are converted to arrival times at the Solar System Barycentre (SSB) using the known instantaneous spacecraft position, the source position and the solar system ephemeris (JPL DE200 Solar System Ephemeris). The pulse phase is calculated from the following timing model:
| (1) |
In this formula is given by with the event SSB arrival time and the reference epoch. The values employed here for are given in Table 2. The RMS error of the timing models listed in Table 2 is typically 10 milli-periods or 1.5 ms, sufficiently accurate to keep coherency and allowing pulse phase folding over long time spans indicated by the validity range.
3.3 Pulse profiles in the 0.75-30 MeV energy range
The pulse phase distribution resulting from phase-folding COMPTEL Cycle I-VI 0.75-30 MeV data is shown in Fig. 1. The modulation significance of the unbinned sample of pulse-phases is employing a -test (Buccheri et al. (1983)) with 2 harmonics. This is the first firm detection of pulsed emission above 0.75 MeV from PSR B1509-58. The pulse is roughly aligned with the pulse observed by OSSE/BATSE (Ulmer et al. 1993) and peaks at phase (obtained from a Gaussian + background fit).

We have split the integral energy window of 0.75-30 MeV up into 3 smaller energy windows, 0.75-3 MeV, 3-10 MeV and 10-30 MeV and performed similar timing analyses. The modulation significances (-test) found for the 3 energy windows are and respectively, proving the detection of pulsed emission up to at least 10 MeV. The lightcurves are shown in Fig.2. The 10-30 MeV lightcurve, having at face value a non-significant modulation, shows an indication for an enhancement in the phase range containing the pulse at lower energies. However, a narrower pulse might be visible near phase 0.85, which is absent at lower energies. A more detailed discussion on the 10-30 MeV lightcurve will be given once the spatial analysis, enabling the measurement of the total flux from a source, has been introduced.

3.4 Pulse profiles from soft X-rays to medium energy -rays
Rots et al. (1998) studied the pulse shape of PSR B1509-58 as a function of energy at medium and hard X-ray energies. He found that the RXTE 2-16 keV pulse peak lags the radio peak by in phase. This value is consistent with the lag of found in Ginga 2-60 keV data by Kawai et al. (1991). Ulmer et al. (1993) found at soft -ray energies a phase lag of in CGRO BATSE and OSSE data. The difference of ( effect) between these values was considered troublesome by Rots et al. (1998). It could not be attributed to a CGRO clock absolute timing uncertainty and this triggered Rots et al. (1998) to reprocess 5 years of BATSE data yielding now a slightly smaller phase lag of 0.30 consistent both with Ulmer’s previous estimate and also with the RXTE estimate.

The remaining (insignificant) difference of ( ms) still seems to be too large to be explained by CGRO/RXTE clock uncertainties and could be due to intrinsic pulsar emission properties. Rots et al. (1998) also investigated the effect of the pulsar dispersion measure on the phase offset of the radio- and RXTE X-ray pulse. Using the most recent value of the dispersion measure of PSR B1509-58 of instead of the widely used value of results in an offset of , indicating that uncertainties in the dispersion measure can result in uncertainties in the radio/X-ray pulse phase lag of .
The RXTE 2-16 keV profile consists of a broad asymmetric pulse: a rapidly rising pulse reaching its maximum near phase 0.27 followed by a more gradual decline with a “shoulder” near phase 0.40. This profile is shown in Fig.3b along with the X-ray/soft -ray profiles measured by different instruments in different energy windows. It is clear from this collage that the ASCA 0.7-2.2 keV soft X-ray profile is in detail very similar to the RXTE 2-16 keV hard X-ray profile. The BATSE 32 keV soft -ray profile also resembles the RXTE profile except for an apparent overall offset of with respect to the RXTE profile. The COMPTEL 0.75-10 MeV lightcurve on the other hand reaches its maximum near 0.38 which coincides in phase with the shoulder clearly visible in the RXTE lightcurve. Whether this apparent offset has a statistical origin (cf. the typical error bar in the COMPTEL 0.75-10 MeV lightcurve which has a mean level of counts in this 15 bin lightcurve) or is due to an intrinsic property of the pulsar’s high-energy emission is difficult to decide. The intrinsic timing-resolution of 0.125 ms of CGRO/COMPTEL is sufficiently accurate to allow the lightcurve to be binned in several hundreds of bins and can not be responsible for the offset. Also, BATSE and COMPTEL use the same CGRO clock.
In order to study the difference in morphology between the COMPTEL 0.75-10 MeV and RXTE 2-16 keV lightcurves we have fitted the RXTE 2-16 keV profile in terms of a background and two Gaussians (7 free parameters). This resulted in a narrow component peaking at phase with width and a broader component at and width . The first narrow pulse accounts for of the total pulsed emission. A similar fit has been performed on COMPTEL 0.75-10 MeV data, but now with positions and widths fixed to the values found in the RXTE 2-16 keV fit (3 free parameters). In this case the first narrow pulse can account for only of the total pulsed emission, consistent with being absent, and the profile can satisfactorily be described by just the broad second pulse near 0.39. This strongly suggests that the pulse shape changes from soft X-rays to medium energy -rays.
3.5 Pulsed 0.75-30 MeV fluxes from the excess counts in the lightcurves
Based on the RXTE 2-16 keV lightcurve we have defined a “pulsed” and an “unpulsed” phase interval in the pulse phase distribution: the pulsed interval extends from phase 0.15 to 0.65 and the unpulsed (background) interval from 0.65 to 1.15. This break-down is such that for a pulse shape as measured by RXTE of the pulse is located in the “pulsed” interval.
Applying this definition to the COMPTEL data we can determine the pulsed excess counts in various energy slices by estimating the underlying background as the averaged level in the unpulsed part of the lightcurve. We derived these pulsed excess counts for the 0.75-3, 3-10 and 10-30 MeV energy windows and converted these to pulsed flux values taking into account efficiency correction factors due to the applied ARM cuts in the timing-analysis (see Table 3).
| -window | Flux |
|---|---|
| MeV | |
| MeV | |
| MeV |
The weak 10-30 MeV flux value should be treated with care because we do not detect significant modulation (). Moreover, the lightcurve shows indications for a second pulse in the “unpulsed”(background) phase interval. If this pulse is genuine, then the true flux is underestimated (see next section).
4 COMPTEL spatial analysis
4.1 Analysis method
The measured event parameters () constitute a 4-dimensional data space, in which we have to search for a ”source signature”. In practice the dimension of the data space is lowered by integrating along the direction between user selected boundaries. The event distribution of a point source (the Point Spread Function, PSF) in this reduced 3-d data space is concentrated in a cone-shaped structure with its apex at the source position (). In the spatial or imaging analysis we proceed as follows: We generate a background model from the sparsely filled event dataspace (3d) through sophisticated smoothing techniques (see e.g. Bloemen et al. (1994)). Because the measured events in the 3d-dataspace are primarily internally generated background events () this background model represents a good approximation of the genuine instrumental background. The search for point sources in the measured 3d-dataspace is accomplished by a maximum likelihood ratio (MLR) test at scan positions in the selected sky field. In the null hypothesis the measured events are described in terms of a background model alone, while in the alternative hypothesis the data are described in terms of a background model and a point source at a given scan position. From the parameter optimizations under we can derive the source flux. From the optimized likelihoods under and we can determine the maximum likelihood ratio at each scan position, giving us information on the detection significance of a source. For more detailed information see Kuiper et al. (1998a).
4.1.1 Imaging results for energies 10 MeV
For consistency purposes we have produced MLR maps for the same energy windows (0.75-3 and 3-10 MeV) as used in the timing analysis, and also made selections on pulse phase, the “pulsed” and “unpulsed” windows introduced in Sect. 3.5, while we also considered the total emission, the sum of both. In Fig. 4 the MLR images are shown for the “pulsed” and “unpulsed” phase intervals in the energy windows 0.75-3 and 3-10 MeV. The contours start at an equivalent of in steps of for 1 degree of freedom (i.e. at etc.), representative if the source position is a priori known.

From these maps it is evident that significant emission at the pulsar position (indicated by a “” mark) is only observed in the “pulsed” maps: in the 0.75-3 MeV energy window and in the 3-10 MeV window. From the maximum likelihood fits we can also obtain estimates for the source flux. However, in the maps shown in Fig. 4 the structured galactic diffuse emission is not included in the background model, and may contribute to the source flux. In addition, any pulsar/nebula DC-emission will contribute equally to the “pulsed” and “unpulsed” maps. Since is not zero at the source position in the “unpulsed” maps, we subtracted the measured fluxes (counts) in the “unpulsed” maps from those in the “pulsed” maps in order to obtain independent estimates of the “pulsed” fluxes. For the 0.75-3 MeV interval we found counts correlating with a point source at the pulsar position in the “pulsed” interval and in the “unpulsed” interval. The difference of is consistent with the pulsed excess counts in the timing analysis. The number of counts found in the “unpulsed” window can be fully attributed to contributions of galactic diffuse origin, as has been verified in a simulation of the galactic diffuse emission using the model components and scale factors found by Bloemen et al. (1999). This means that there is no room for any significant pulsar or nebula DC-component in this energy window.
For the 3-10 MeV energy interval we obtained a similar picture. In this case we find counts correlating with a point source at the pulsar position in the “pulsed” map and in the “unpulsed” map. This leaves counts for the genuinely pulsed emission, consistent with the timing analysis results. The “unpulsed” value can again be explained with being of galactic diffuse origin.
In conclusion, the fluxes derived from the spatial analysis for energies below 10 MeV are consistent with those derived from the timing analysis and there is no evidence for the detection of DC-emission from the pulsar or its nebula.
4.1.2 Imaging results for energies 10 MeV
In the 10-30 MeV energy window we did not detect a significant () modulation in the light curve, but an enhancement is visible in the pulse phase interval in which the pulse is concentrated at lower energies, and in the “unpulsed” interval a high bin shows up near phase 0.85. A MLR image (total) in this energy window yielded somewhat surprisingly a strong source feature () consistent in position with the pulsar, by simply fitting the source contribution above the instrumental background model.
It should be noted here that the 10-30 MeV energy window is COMPTEL’s “cleanest” window not polluted by time-varying instrumental background lines contrary to the energy intervals below 10 MeV. Estimates for the galactic diffuse emission in this energy window can be considered reliable (e.g. Strong et al. (1994), Bloemen et al. 1999) and are consistent with extrapolations towards lower energies of EGRET MeV measurements.

When we now include also the total galactic diffuse background model in the total background, the source remains (see Fig. 5). At the pulsar position a detection significance of is reached. A break-down into “pulsed” and “unpulsed” maps yields sources at the pulsar position with statistically equal fluxes in both maps. This can mean that we either detected DC-emission from the pulsar and/or its surrounding synchrotron nebula or emission from a nearby unrelated source. But, in these cases we would expect to see emission below 10 MeV where COMPTEL is more sensitive. Another possibility is that we actually detected pulsed emission but with a different pulse profile.
We investigated the latter possibility further. In this respect it is instructive to go back to the 10-30 MeV lightcurve and superpose the background level as determined in the spatial analysis from the total number of counts correlating with a source at the pulsar position above the instrumental and galactic diffuse background. The lightcurve with this spatially determined background level (and its -errors) is shown in Fig. 8a. The existence of the main pulse, definitely detected below 10 MeV, is again very suggestive for energies above 10 MeV. The number of excess counts in the “pulsed” interval (0.15-0.65) above of this spatially determined background level is counts, resulting in a flux of . In the “unpulsed” region we find then a flux of , predominantly due to the excess near phase 0.85. This feature above the spatially determined background, only shows up above 10 MeV and, if genuine, would indicate a new pulse component with a completely different spectral behaviour from that of the main pulse. This peculiar behaviour of the pulsed emission above 10 MeV in the COMPTEL energy range motivated us to analyze also the contemporaneous MeV EGRET data.
5 Analysis of EGRET data
No significant (pulsed) emission above 30 MeV has been reported from EGRET data, but, two papers (Brazier et al. (1994); Fierro (1995)) report on weak (irregular) source features () near PSR B1509-58 for energies above 100 MeV. It is worth mentioning that in the first paper the analysis was constrained to data from CGRO Cycle I, namely VP’s 12, 23 and 27 (cf. Table 1), while in the second paper data from Cycles I to III were analyzed. Here, we reanalyzed all available Cycle I-IV EGRET data, the maximal exposure on the source. The observations used are those in Table 1 in which the spark chamber high-voltage was enabled (see last column Table 1; the data of Cycle V do not contribute since EGRET operated in its narrow field mode with an effective FoV opening angle of ). Standard event selections were applied, however, the requirement of a minimum energy deposit of 6.5 MeV in the TASC was abandoned (for a description of EGRET see Thompson et al. (1993)). This selection criterion is mainly effective for background suppression for measured total energies above 100 MeV. We verified using the Crab pulsar that for energies below 100 MeV the detection of the pulsed signal significantly increases when the TASC threshold of 6.5 MeV is ignored. In order to suppress Earth albedo -rays, standard Earth horizon angle cuts were applied for the differential energy ranges 30-50 MeV, 50-70 MeV and 70-100 MeV, which are roughly equivalent to a 3 cut. For consistency, the same selections were applied in the spatial and timing analyses.
5.1 Spatial analysis
The imaging analysis of EGRET data is similar to that of COMPTEL data with the main difference that the EGRET analysis is performed in a 2-d dataspace. After reformatting the EGRET data and response for import in the COMPTEL Analysis and Software System COMPASS (de Vries (1994)) we can use the same analysis programmes. One important difference is that the EGRET data are almost free of instrumental background. This means that the point source emission is searched for above of the dominating galactic and extragalactic -ray backgrounds only. The spatial structure of the first component, predominantly due to the interaction of cosmic rays and interstellar Hydrogen, is approximated by the measured total column density of atomic Hydrogen H i and molecular Hydrogen as traced by the CO-molecule, identical to our analysis of COMPTEL data. The latter component can simply be described by an isotropic model.
The MLR map for the 30-100 MeV energy window, adjacent to the COMPTEL 10-30 MeV window, combining all available Cycle I-IV data is presented in Fig. 6. A strong excess shows up near PSR B1509-58. Apart from the pulsar a few other identified and unidentified EGRET sources seem to be visible in the map (see figure caption).

The most likely sources responsible for the excess near are PSR B1509-58 and 2EG J1443-6040 at . Fitting both sources simultaneously above of the galactic and extragalactic backgrounds, together with emissions from Cen-A and 2EGS J1429-4224 yields a excess at the position of PSR B1509-58 with a flux of . This is shown in the MLR map of Fig. 7 in which the other three fitted sources and background emissions are “subtracted”. The detection significance of the source correlating with 2EG J1443-6040 is and has a flux of . It should be noted that this unidentified EGRET source was only detectable in VP’s 12 and 27 and not during observations performed later on, indicating its likely transient behaviour. In fact, it does not appear anymore in the third EGRET source catalog (Hartman et al. (1999)). (Note: After submission of this paper, the EGRET group, using analysis based on the third EGRET catalog, confirmed the finding of a significance source in the 30-100 MeV band, consistent in position with PSR B1509-58; D.J. Thompson, private communication).

We performed a similar imaging study in the 100-300 MeV energy window and found also a source feature near PSR B1509-58 above of the galactic and extra-galactic background, as well as the previously reported EGRET sources, consistent with the findings of Brazier et al. (1994) and Fierro (1995). The 100-300 MeV flux estimate for PSR B1509-58 is . Even in the 300-1000 MeV window a marginal excess is visible consistent in position with PSR B1509-58 (flux ). Above 1000 MeV no excess is found. These low flux values can also be converted in upper-limits.

5.2 Timing analysis
Given the detection of a significant source in the spatial analysis for energies between 30 and 100 MeV, we first selected events in this energy range to search for the modulation. The event selection procedures in the EGRET timing analysis are equivalent to those applied in the COMPTEL timing analysis except that we are now dealing with a 2-dimensional dataspace. We applied an energy dependent cone selection (Thompson et al. 1996b ) roughly selecting of the source counts. In this 30-100 MeV energy interval we do not find significant modulation (), although the shape of the pulse phase distribution bears some resemblance to the COMPTEL 10-30 MeV lightcurve. Both are shown in Fig. 8. Estimates of the underlying backgrounds as determined from the spatial analysis fitting PSR B1509-58 and 2EG J1443-6040 simultaneously are indicated. Also shown in the figure is the combined 10-100 MeV lightcurve, which has a modulation significance of for 2 harmonics in the -test. Again, the summed background level determined in the spatial analyses is indicated, as well as the Kernel Density Estimator (KDE, de Jager et al. (1986)) of the unbinned pulse-phase distribution with the error bounds. The KDE provides an (asymptotically) unbiased view on the genuine pulse shape. This lightcurve suggests a double-peaked profile: an enhancement in the previously defined “pulsed” interval, and a pulse near phase 0.85, which has become more pronounced in this summed lightcurve.
Even though the modulation significance of this 10-100 MeV lightcurve is still marginally significant, the apparent double-peaked structure above the background level estimated in the spatial analysis, makes it very suggestive that the source detected in the spatial analysis is PSR B1509-58 with pulsed emission upto the EGRET energies. At least, the spatial and timing analyses are consistent with this interpretation. If correct, the lightcurve morphology changed from one broad single pulse to a profile with an additional pulse near phase 0.85.

6 Spectral analysis
Energy spectra can be derived from the spatial analysis as well as from the timing analysis. Given that there is some ambiguity in the interpretation of the results on PSR B1509-58 for energies above 10 MeV, we consider three cases:
i) The COMPTEL “pulsed” spectrum of PSR B1509-58 (0.75-30 MeV) determined by the excess counts in the phase window 0.15-0.65 above the average level in the complementary phase interval. This represents the spectrum of the broad single pulse, which was already determined in section 3.5 (Table 3). In Fig. 9 this spectrum is shown together with the spectra (power-law fits) derived by other instruments from 1 keV upto 700 keV. Above 30 MeV are included the EGRET upper-limits (D.Thompson-private communication) derived from spatial analyses using a subset of the observations listed in Table 1. The new COMPTEL flux values are consistent with an extrapolation of the OSSE power-law fit (PL-index of -1.68) upto 10 MeV, followed by a drastic break, which will be discussed in section 7.
ii) If the source detected by COMPTEL between 10 and 30 MeV is PSR B1509-58, then we have underestimated the flux of the single broad pulse in the 10 - 30 MeV interval. Determining then the flux (phases 0.15-0.65) above the spatially determined background (see Fig. 8) between 10 and 30 MeV, and inserting that in Fig. 9 gives a spectrum for the single broad pulse with a break energy between 10 and 30 MeV. In this case this spectrum does not represent the total pulsed spectrum for energies above 10 MeV.
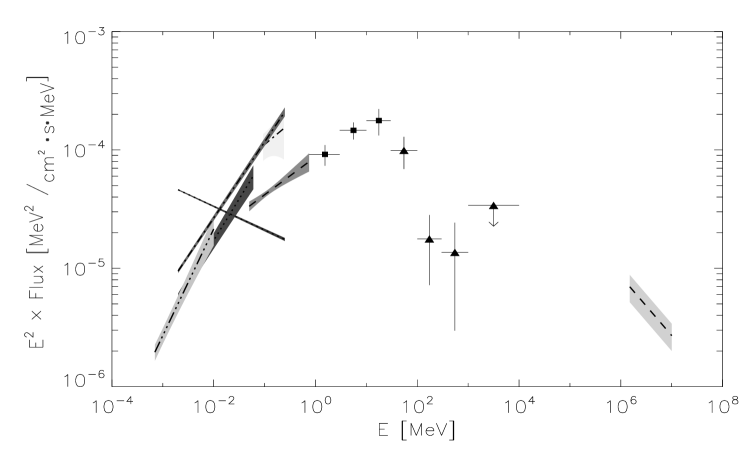
iii) If the sources detected at the position of the pulsar by COMPTEL and EGRET in the spatial analyses above 10 MeV and 30 MeV, respectively, can be identified with the pulsar, then the total spectrum of PSR B1509-58 above 0.75 MeV can be derived by combining the COMPTEL flux values from the timing analysis below 10 MeV (consistent with 100% pulsed) with the flux values from the spatial analysis of COMPTEL 10-30 MeV data (section 4.1.2) and EGRET data above 30 MeV (section 5.1). This is shown in Fig. 10 together with the “pulsed” spectra measured at lower energies by other instruments as well as the flux estimate from the detection () by the CANGAROO collaboration in their spatial analysis for energies above 1.5 TeV (Sako (1998)). The increased flux level above 10 MeV in comparison with the spectrum shown in Fig. 9 is then mainly due to an additional pulse component near phase 0.85, having a completely different spectrum than the main pulse. For comparison is also shown the “unpulsed” spectrum of PSR B1509-58 measured by RXTE upto 240 keV (Marsden et al. 1998). It is evident that, if the “unpulsed” emission extrapolates according to the RXTE spectrum towards the -ray regime, the 10-30 MeV flux measured at the PSR B1509-58 position can not be the (nebula) DC emission, supporting the pulsar interpretation. Furthermore, the EGRET flux values above 100 MeV are consistent with the extrapolation of the fit to this “unpulsed” spectrum, which is even consistent with an extrapolation up to the claimed detection of the nebula by the CANGAROO collaboration at TeV energies. Therefore, the spectral compilation in Fig. 10 suggests that the combined COMPTEL / EGRET spectrum of PSR B1509-58 represents the transition from dominantly pulsed emission below MeV to dominantly DC-emission above MeV.
7 Summary and discussion
The major findings based on primarily COMPTEL and to a lesser extent EGRET -ray data presented in this paper can be summarized as follows:
-
I
Pulsed -ray emission from PSR B1509-58 has been detected with high significance up to 10 MeV as a broad asymmetric single pulse located in the phase interval where also the pulse occurs for X-ray and soft -ray energies up to 700 keV. The pulse measured by COMPTEL between 0.75 and 10 MeV reaches its maximum near radio phase 0.38, shifted w.r.t. the value 0.30 measured by Rots et al. (1998) in the BATSE data above 32 keV. The COMPTEL maximum appears to coincide in phase wih the “shoulder” clearly visible in the RXTE 2-16 keV data. The pulsed spectrum is consistent with a power-law extrapolation up to 10 MeV of the OSSE spectrum (PL-index of -1.68) measured at lower -ray energies.
-
II
In the 10-30 MeV energy range we do detect a significant () source positionally consistent with PSR B1509-58, however, the timing analysis yields a modulation significance of only. Based on just the COMPTEL data we cannot discriminate with certainty between the following interpretations: i) DC emission from the pulsar or its nebula, ii) emission from a nearby source, or iii) pulsed emission: the light curve exhibits an excess in phase with the pulse measured below 10 MeV and there is an indication for a second narrow component near phase 0.85.
-
III
In the adjacent 30-100 MeV EGRET energy band we detect a source positionally consistent with PSR B1509-58 which can be explained with contributions from PSR B1509-58 () and the nearby unidentified EGRET source 2EG J1443-6040 (). Timing analysis of the 30-100 MeV events yields a modulation significance of only. The combined COMPTEL/EGRET 10-100 MeV lightcurve (modulation significance ) shows also the double-peaked shape: again a main pulse coinciding with the pulse observed at lower energies and a weak narrower pulse near phase 0.85. The results of the spatial and timing analyses are consistent with PSR B1509-58 being detected between 10 and 100 MeV, with a new pulse which is only visible between 10 and 100 MeV.
-
IV
The pulsed spectrum of PSR B1509-58 shows a sharp break between 10 and 30 MeV. The break energy is close to 10 MeV for the broad main pulse, and shifts to MeV for the total spectrum if the second narrow component is genuine.
The implications of these new findings at medium and high-energy -ray energies will now be discussed. Theoretical models explaining the high-energy electro-magnetic radiation from highly magnetized rotating neutron stars can be distinguished in two different catagories:
-
a
Polar Cap models (PC) in which the acceleration of charged particles along the open magnetic field lines in the vicinity of the magnetic pole(s) and subsequent cascades through high-energy radiation processes gives rise to the emerging -ray spectrum.
-
b
Outer Gap models (OG) in which the acceleration of charged particles and the production of -rays takes place in vacuum gaps between the null-charge surface defined by , with the local magnetic field and the pulsar spin vector, and the light cylinder () along the last closed field lines.
Both models rely on charge replenishment of the magnetosphere mainly through pairs. The polar cap models can be subdivided further primarily based on the energy reached by the particles (primaries) in the acceleration process. For primary particle energies , with the Lorentz factor or equivalently the dimensionless energy, energy loss in the form of high-energy -rays through curvature radiation is the most important radiation mechanism (CRPC models). For energies energy loss through inverse Compton scattering with either thermal X-ray photons from the polar cap or from non-thermal cascade processes in the magnetosphere will be more important (ICPC-models). Finally, for energies resonant Compton scattering will be the dominant energy loss mechanism. Irrespective of the underlying energy loss mechanism of the primary particles it is assumed that the emergent -ray spectrum is softened by magnetic pair production (; Sturrock process) in the strong magnetic fields present in the vicinity of the magnetic poles. These pairs (secondaries) are produced in excited Landau states, which decay by the emission of synchrotron photons which in turn can produce pairs and a cascade can develop softening the initial -ray spectrum at each generation.
Daugherty & Harding (1996) assume in a recent version of their CRPC model that a distant observer sees the emission from just one polar cap. They also assume that the acceleration of the primaries occurs over an extended distance above the polar cap surface and that the magnetic inclination (angle between and magnetic moment ) is comparable to the -ray beam opening angle . The last two assumptions relax the requirement of both and a small , i.e. a nearly aligned rotator, in earlier versions of their model (Daugherty & Harding (1994)) to explain the -ray emission properties of pulsars.
Because the curvature radii of the open field lines, assuming a dipole configuration, originating from the polar cap rim near are smaller than those originating at smaller polar angles (at the magnetic pole and no curvature emission can be produced) the initial CR -ray emission spectrum () is most pronounced and hardest (maximum of CR-spectrum is reached at ) near the polar rim resulting in a hollow cone emission pattern. The mostly developed cascades originate near the polar rim which in turn soften the input CR-spectrum most efficiently.
This means that a distant observer not only sees a double peaked profile when the hollow -ray emission cone passes his line of sight, but also a soft-hard-soft variation of the emission is expected, because the CR-emission emanating nearer the magnetic pole is less softened by cascading. Grazing through the -ray emission cone will result in a single pulse profile highly softened by cascade processes. The last situation may be applicable for PSR B1509-58 requiring clear constraints on the geometrical aspects of both the system and the observer. In particular, it demands that the pulsar spin axis / line-of-sight angle should approximately be equal to the sum of the magnetic inclination angle and the -ray cone semi-angle (beam radius). However, the large duty cycle of the single pulse of poses an additional constraint, namely should then be smaller than . This can be estimated using the following equation:
| (2) |
which can be derived in the rotating vector model (e.g. Rankin 1993). is the duty cycle of the pulse, while is the impact parameter defined as . Radio-polarization data yield in the context of this rotating vector model (Crawford et al. 1997; private communication 1999) degree and degree. If we use the best fit parameters, then . Eventhough the uncertainties are large, the emitting rim must be very broad to explain the broad single pulse.
The CRPC model also predicts a spectral cutoff in the -ray spectrum at several GeV. Another interesting feature is that a lower cutoff energy is expected for those pulsars with a higher magnetic field, because the softening by cascade processes is more efficient in these cases. Some of these general trends are indeed observed in some -ray pulsars (Thompson et al. (1997)). The current implementation of geometrical and physical aspects, however, predicts lightcurves with a high degree of symmetry. This symmetry is a problem for e.g. the Vela pulsar high-energy lightcurve (Grenier et al. (1988); Kanbach et al. (1994)) which shows rather asymmetric bridge emission.
For PSR B1509-58 this CRPC model can not explain the observed low spectral cutoff energy occuring between 10 and 30 MeV. However, the (very) strong polar surface magnetic field strength of Gauß likely triggers another more exotic attenuation process to be active in the vicinity of the magnetic pole, namely photon splitting , besides attenuation by magnetic pair production. Harding et al. (1997) showed that the photon splitting attenuation lengths can be shorter than the attenuation lengths for pair production for magnetic field strenghts with G. This means that photon splitting acts as the dominant attenuation process for such strong magnetic fields and can suppress the emission of high-energy photons. Contrary to the attenuation by magnetic pair production, photon splitting has no energy threshold and can degrade the photon energy also below the magnetic pair production threshold (, is the angle between photon propagation direction and local magnetic field). Depending on the splitting mode, partial and full splitting cascades are addressed, Harding et al. (1997) calculate the high-energy spectrum of PSR B1509-58 for various values of the model parameters and , the magnetic co-latitude angle, assuming that the initial high-energy photon emission originates from the neutron star surface in a polar rim at co-latitude . Our new medium-energy -ray data and in particular the spectrum of the main pulse severely constrain the magnetic co-latitude of the emission rim, irrespective of the splitting mode. A co-latitude of , close to the “classical” radius of the polar cap , appears to be required in the model calculations to be consistent with the evident spectral break between 10 and 30 MeV in the combined COMPTEL-EGRET spectrum.
No detailed model calculations have been performed for PSR B1509-58 in the inverse Compton induced Polar Cap cascade scenario (Sturner & Dermer (1994); Sturner et al. (1995) and Sturner (1995)), although some interesting qualitative statements have been made. In particular, if G and the neutron star surface temperature K the Lorentz factors of the electrons are limited to , which might explain the low cutoff energy in the spectrum of PSR B1509-58 (Sturner (1995)). However, this type of PC-model also suffers from predicting too symmetric lightcurves. The model requirement of a nearly aligned rotator () can formally not be excluded for the estimates of the magnetic inclination degree (Crawford et al. 1997) and degree.
In outer gap scenarios (see e.g. Cheng et al. 1986a , Cheng et al. 1986b and Ho (1989)) it is believed that stable vacuum gaps (Holloway (1973)) can be formed in the outer magnetosphere along the boundary of the last closed field lines which extend from the null-charge surface to the light cylinder. Voltage drops of typically V can be obtained across the gaps and accelerate , created either in the gap or flowing in from beyond the light cylinder and from across the null-charge surface, to energies limited by curvature radiation and to a lesser extent inverse Compton scattering (off the ambient bath of lower energy photons). A geometrical calculation of the high-energy emission (beamed along the local magnetic field in the outer gap resulting in a “fan” beam) from an outer gap region was successfull in reproducing qualitatively the observed -ray lightcurves of the known -ray pulsars (Chiang & Romani (1994)). In a recent paper Romani (1996) modelled the emergent high-energy emission based on curvature radiation reaction limited accelerated charges in the outer magnetosphere. In his model the primary particles () emit curvature radiation with spectral cutoffs in the 1-10 GeV range. In order to tap the potential drop a small fraction (proportional to the optical depth and of the order of -) of these curvature photons interact with low-energy photons, provided by thermal surface emission from the neutron star or produced in the gap itself by synchrotron emission processes, to produce pairs. The perpendicular momentum of the produced pairs with respect to the local magnetic field is emitted in the form of synchrotron radiation peaking in the 1-10 MeV range. Part of the produced synchrotron radiation can inverse Compton scatter (ICS) off the primary particles to produce a TeV pulsed emission component (typically of the pulsed GeV flux). The composite of the various emission components constitute the high-energy pulsed spectrum. Although no quantitative estimates are presented, Romani (1996) argued that for short-period high-magnetic field pulsars like PSR B1509-58 the synchrotron flux produced in the gap itself will dominate the thermal surface emission increasing towards and thus significantly suppressing the GeV curvature component. This results in a synchrotron type spectrum peaking at MeV energies. From a geometrical point of view, the derived large values for the magnetic inclination and line-of-sight / pulsar spin axis angles seem to be naturally explained with an outer magnetospheric origin for the high-energy emission.
The above considerations for both the polar cap and outer gap scenarios show that further model calculations are required to make decisive statements on the production site and mechanisms of the high-energy pulsed radiation. In the small sample of detected high-energy pulsars PSR B1509-58 represents clearly a special case. This might now even be more so, given that in the above discussions we did not yet introduce the possible detection of an additional pulse in the lightcurve for energies above 10 MeV. This component must have a significantly harder spectrum than that of the broad main pulse. Such an additional narrow component may at first sight be more easily incorporated in an outer-gap scenario. In this respect it may be of interest to refer to earlier claims of detection of multiple and variable components in the lightcurve of PSR B1509-58 at TeV energies ( TeV), which have been interpreted in the frame work of the outer gap scenario (de Jager et al. (1988), Nel et al. (1990)). However, the earlier mentioned TeV observations by the CANGAROO collaboration do not confirm these claims, and provide a significantly lower upper-limit to the pulsed emission.
A long exposure of the source in the transition region of COMPTEL and EGRET is required to better study the change in morphology of the lightcurve. Additional COMPTEL observations of this source have been scheduled (CGRO Cycle 8) and are aimed to provide better insights in the source characteristics especially above 10 MeV.
Acknowledgements.
The COMPTEL project is supported by NASA under contract NAS5-26645, by the Deutsche Agentur für Raumfahrtangelenheiten (DARA) under grant 50 QV90968 and by the Netherlands Organisation for Scientific Research (NWO). AC research is sponsored by the CONACYT grant 4142-E. We thank Arnold Rots for providing the RXTE and BATSE lightcurves, Yoshitaka Saito for providing the ASCA spectral and timing results prior to publication and Froney Crawford & Vicky Kaspi for corresponding radio polarization results. Finally, we thank Dave Thompson for discussions on the EGRET findings.References
- Becker (1994) Becker W., 1994, Ph.D. thesis, Ludwig-Maximilians-Universität München
- Bloemen et al. (1994) Bloemen H., Hermsen W., Swanenburg B., et al., 1994, ApJS 92, 419
- Bloemen et al. (1999) Bloemen H., Collmar W., Diehl R., et al., 1999, Proceedings third Integral Workshop “The Extreme Universe”, Overseas Publishers Association, Astrophysical Letters & Communications, in press
- Brazier & Becker (1997) Brazier K.T.S, Becker W., 1997, MNRAS 284, 335
- Brazier et al. (1994) Brazier K.T.S, Bertsch D.L., Fichtel C.E., et al., 1994, MNRAS 268, 517
- Buccheri et al. (1983) Buccheri R., Bennett K., Bignami G.F., et al. 1983, A&A 128, 245
- Carramiñana et al. (1995) Carramiñana A., Bennett K., Buccheri R., et al., 1995, A&A 304, 258
- Carramiñana et al. (1997) Carramiñana A., Bennett K., Hermsen W., et al., 1997, AIP Conf. Proc. 410, p. 583, Eds. Dermer, C.D., Strickman, M.S. and Kurfess, J.D.
- (9) Cheng K.S., Ho C., Ruderman M., 1986a, ApJ 300, 500
- (10) Cheng K.S., Ho C., Ruderman M., 1986b, ApJ 300, 522
- Chiang & Romani (1994) Chiang J., Romani R.W., 1994, ApJ 436, 754
- Collmar et al. (1997) Collmar W., Wessolowski U., Schönfelder V., et al., 1997, AIP Conf. Proc. 410, p. 1587, Eds. Dermer C.D., Strickman M.S. and Kurfess J.D.
- (13) Crawford F., Kaspi V.M., Manchester R.N., Lyne A.G. 1997, BAAS, 191, 1120
- Daugherty & Harding (1994) Daugherty J.K., Harding A.K, 1994, ApJ 429, 325
- Daugherty & Harding (1996) Daugherty J.K., Harding A.K, 1996, ApJ 458, 278
- de Jager et al. (1986) de Jager O.C., Swanepoel J.W.H., Raubenheimer B.C., 1986, A&A 170, 187
- de Jager et al. (1988) de Jager O.C., Raubenheimer B.C., North A.R., et al. 1988, ApJ 329, 831
- de Vries (1994) de Vries C.P, 1994, A.S.P. Conf. Series 61, 399, eds. Crabtree D.R., Hanisch R.J. and Barnes J.
- Fierro (1995) Fierro J.M., 1995, Ph. D. thesis, Stanford University
- Greiveldinger et al. (1995) Greiveldinger C., Caucino S., Massaglia S., et al., 1995, ApJ 454, 855
- Grenier et al. (1988) Grenier I.A., Hermsen W., Clear J., et al., 1988, A&A 204, 117
- Gunji et al. (1994) Gunji S., Hirayama M., Kamae T., et al., 1994, ApJ 428, 284
- Harding et al. (1997) Harding A., Baring M., Gonthier P., 1997, ApJ 476, 246
- Hartman et al. (1999) Hartman R.C., Bertsch D.L., Bloom S.D., 1999, ApJS, in press
- Hermsen et al. (1994) Hermsen W., Kuiper L., Diehl R., et al., 1994, ApJS 92, 559
- Ho (1989) Ho C., 1989, ApJ 342, 396
- Holloway (1973) Holloway N.J., 1973, Nat. Phys. Sci. 246, 6
- Kanbach et al. (1994) Kanbach G., Arzoumanian Z., Bertsch D.L., et al., 1994, A&A 289, 855
- Kaspi et al. (1994) Kaspi V.M., Manchester R.N., Siegman B., et al., 1994, ApJ 422, L83
- Kawai et al. (1991) Kawai N., Okayasu R., Brinkmann W., et al., 1991, ApJ 383, L65
- Kawai et al. (1993) Kawai N., Okayasu R., Sekimoto Y., 1993, AIP Conf. Proc. 280, p. 213, Eds. Friedlander M., Gehrels N. and Macomb D.
- Kuiper et al. (1998a) Kuiper L., Hermsen W., Bennett K., et al., 1998a, A&A 337, 421
- (33) Kuiper L., Hermsen W., Schönfelder V., et al. 1998b, in: “The many faces of neutron stars”, Buccheri et al. (eds), NATO ASI Series C, Vol. 515, 211
- Manchester et al. (1982) Manchester R.N., Tuohy I.R., D’Amico N.,1982, ApJ 262, L31
- Marsden et al. (1998) Marsden D., Blanco P.R., Gruber D.E., et al. 1998, ApJ 491, L39
- Matz et al. (1994) Matz S.M., Ulmer M.P., Grabelsky D.A., et al. 1994, ApJ 434, 288
- Much et al. (1995) Much R., Bennett K., Buccheri R., et al. 1995, A&A 299, 435
- (38) Nagase F., Zylstra G., Mihara T., 1994, p. 57, in “New horizon of X-ray astronomy”, Universal Academy Press, Inc. - Tokyo, Japan
- Nel et al. (1990) Nel H.I., de Jager O.C., Raubenheimer B.C., et al. 1990, ApJ 361, 181
- Rankin (1993) Rankin J.M., 1993, ApJ 405, 285
- Romani (1996) Romani R.W., 1996, ApJ 470, 469
- Rots et al. (1998) Rots A.H., Jahoda K., Macomb D.J., et al., 1998, ApJ 501, 749
- Saito et al. (1997) Saito Y., Kawai N., Kamae T., et al., 1997, AIP Conf. Proc. 410, p. 628, Eds. Dermer C.D., Strickman M.S. and Kurfess J.D.
- Sako (1998) Sako, T., 1998, in Neutron Stars and Pulsars - 30 years after the discovery, Eds. Shibazaki N., Kawai N., Shibata S. and Kifune T., Universal Academy Press, Tokyo, Japan, 1998
- Schönfelder et al. (1993) Schönfelder V., Aarts H., Bennett K., et al., 1993, ApJS 86, 657
- Seward & Harnden (1982) Seward F.D., Harnden Jr. F.R., 1982, ApJ 256, L45
- Seward et al. (1983) Seward F.D., Harnden Jr. F.R., Murdin P., 1983, ApJ 267, 698
- Seward et al. (1984) Seward F.D., Harnden Jr. F.R., Szymkowiak A., et al., 1984, ApJ 281, 650
- Strong et al. (1994) Strong A., Bennett K., Bloemen H., et al., 1994, A&A 292, 82
- Sturner (1995) Sturner S.J., 1995, ApJ 446, 292
- Sturner & Dermer (1994) Sturner S.J., Dermer C.D., 1994, ApJ 420, L79
- Sturner et al. (1995) Sturner S.J., Dermer C.D., Michel F.C., 1995, ApJ 445, 736
- Tamura et al. (1996) Tamura K., Kawai N., Yoshida A., et al., 1996, PASJ 48, L33
- Thompson et al. (1993) Thompson D.J., Bertsch D.L., Fichtel C.E., et al., 1993, ApJS 86, 629
- Thompson et al. (1995) Thompson D.J., Bertsch D.L., Dingus B.L., et al., 1995, ApJS 101, 259
- (56) Thompson D.J., Bertsch D.L., Dingus B.L., et al., 1996a, ApJS 107, 227
- (57) Thompson D.J., Bailes M., Bertsch D.L., et al., 1996b, ApJ 465, 385
- Thompson et al. (1997) Thompson D.J., Harding A.K., Hermsen W., et al., 1997, AIP Conf. Proc. 410, p. 39, Eds. Dermer C., Strickman M., and Kurfess J.
- Trussoni et al. (1990) Trussoni E., Brinkmann W., Ögelman H., et al., 1990, A&A 234, 403
- Trussoni et al. (1996) Trussoni E., Massaglia S., Caucino S., et al., 1996, A&A 306, 581
- (61) Ulmer M.P., Matz S.M., Wilson R.B., et al., 1993, ApJ 417, 738
- Weisskopf et al. (1983) Weisskopf M.C., Elsner R.F., Darbro W., et al., 1983, ApJ 267, 711
- (63) Wilson R.B., Finger M.H., Pendleton G.N., et al., 1993a, p. 257, in “Isolated Pulsars”, Taos, New Mexico, Eds. Van Riper K.A. and Ho C., Cambridge Univ. Press
- (64) Wilson R.B., Fishman G.J., Finger M.H., et al., 1993b, AIP Conf. Proc. 280, p. 291, Eds. Friedlander M., Gehrels N. and Macomb D.