On the third dredge-up phenomenon in asymptotic giant branch stars
Abstract
The third dredge-up phenomenon in asymptotic giant branch (AGB) stars is analyzed through evolutionary model calculations of a , solar metallicity star. The Schwarzschild criterion is used to test the stability of a given layer against convection, and the calculations are performed either with or without extra-mixing below the convective envelope. Based on these calculations, several questions are addressed regarding the occurrence of the third dredge-up in AGB star models, the laws governing that phenomenon, and some of its implications on the structural and chemical evolution of those stars.
The use of the Schwarzschild criterion without extra-mixing of any sort is shown to lead to unphysical afterpulse models which prevent the occurrence of third dredge-up. Model calculations of a star using no extra-mixing confirm the failure to obtain dredge-up in those conditions. That conclusion is found to be independent of the mixing length parameter, stellar mass, or numerical accuracy of the models.
Model calculations performed on selected afterpulses of the star, but with extra-mixing (using a decreasing bubble velocity field in the radiative layers and a diffusion algorithm for the mixing of the chemical elements), lead to efficient dredge-ups at a rate of /yr. Test calculations using different extra-mixing extents and efficiencies reveal that the dredge-up predictions are rather insensitive to those extra-mixing parameters. This important conclusion is understood by analyzing the physics involved in the dredge-up process. It is shown that the dredge-up rate is determined by the thermal relaxation time-scale of the envelope as C-rich matter is added from the core into the envelope. The dredge-up predictions are, however, expected to depend on the convection prescription in the envelope.
Linear relations both between the dredge-up rate and the core mass and between the dredge-up efficiency and are predicted by the model calculations. Those linear relations are expected to still hold when the feedback of the dredge-ups on the AGB evolution is taken into account. They predict the dredge-up efficiency to level off at unity during the AGB evolution, at which point the core mass remains constant from one pulse to the next. The core mass is concomitantly predicted to evolve towards an asymptotic value. The existence of such an asymptotic core mass naturally provides an upper limit to the mass of the white dwarf remnant, and helps to constrain the initial-final mass of white dwarfs.
Synthetic calculations taking into account the dredge-up laws obtained from the full AGB model calculations predict a continuous increase of the stellar luminosity with time, contrary to the predicted behavior of and . This results from an adopted dependence of on both and the radius of the H-depleted core of the form . As a result of this increase of with time, the initial-final mass relation can further be constrained if mass loss is taken into account. If, for example, a superwind is assumed to eject all the remaining envelope of the star at , then the mass of the white dwarf remnant is predicted to be , instead of predicted by models without dredge-up.
Finally, the synthetic calculations predict the formation of a carbon star after about 20 pulses experiencing dredge-up. Taking into account the fact that the luminosity decreases by a factor of two during about 20% of the interpulse phases, such a carbon star could be observed at luminosities as low as .
Key Words.:
stars: AGB - stars: carbon - stars: white dwarf - stars: evolution - stars: interior - stars: abundances1 Introduction
The third dredge-up (3DUP) phenomenon is the process by which ashes from helium burning nucleosynthesis are transported from the interior to the surface of low- and intermediate-mass stars () during the asymptotic giant branch (AGB) phase (see, e.g., Mowlavi 1998a for a general introduction to the structural and chemical evolution of AGB stars). It contrasts with the first and second dredge-ups which bring to the surface only ashes from hydrogen burning. The signature of those 3DUP events is observable in the specific chemical composition characterizing many AGB stars as compared to those of red giant stars (see, for example, Mowlavi 1998b). In particular, the high C/O ratios observed in MS, S, SC (C/O1 in number) and C (C/O1) stars are explained as resulting from an increase in the carbon abundance due to the 3DUP (solar C/O0.42). Similarly, the overabundances (as compared to those in red giants) of fluorine and s-process elements (Jorissen et al. 1992) attest to the operation of dredge-up in AGB stars.
Stellar models show that thermal instabilities (called pulses) develop periodically in the He-burning shell of AGB stars (Schwarzschild and Härm 1965), leading to structural readjustments which provide an adequate stage for the operation of the 3DUP (Iben 1975, Sugimoto and Nomoto 1975). Unfortunately, model predictions available in the literature do not agree on the characteristics of the 3DUP, such as the pulse number at which it begins to operate along the AGB or the extent of envelope penetration in the C-rich layers. The problem is of particular relevance when confronting chemical abundances observed at the surface of AGB stars to model predictions. For example, the famous ‘carbon star mystery’ put forward by Iben (1981) about the luminosity function of C stars in the Magellanic Clouds revealed, among other things, the difficulty of models to explain the low luminosity C stars (see Mowlavi 1998c for the present state on that question). The few – but isolated – successes of AGB models in obtaining low-luminosity carbon star models in the late 80’s suggested that the solution to the carbon star mystery resides in the use of new radiative opacities and adequate mixing length parameters (Sackmann & Boothroyd 1991). Yet, many recent AGB calculations do not confirm those expectations (Vassiliadis & Wood 1993, Wagenhuber & Weiss 1994, Blöcker 1995, Forestini & Charbonnel 1997), while some others do succeed in obtaining dredge-up (Frost & Lattanzio 1996, Straniero et al. 1997, Herwig et al. 1997, this work).
The disagreement between AGB model predictions on the issue of dredge-up prevents us to provide reliable and consistent chemical yields of low- and intermediate-mass stars. Why do some models obtain dredge-up while others fail to do so? Herwig et al. (1997) succeed in obtaining dredge-up from the pulse on in a Pop. I star model by using an overshooting algorithm below the convective envelope. Some sort of extra-mixing beyond the convection borders defined by the Schwarzschild criterion was already used by Boothroyd & Sackmann (1988a) and Lattanzio (1986), and its inclusion is found to improve the dredge-up efficiencies predicted by the models of Frost & Lattanzio (1996). These last authors further note the critical dependency of dredge-up on the numerical treatment of convection in massive AGB models. In contrast, Straniero et al. (1997) claim to obtain dredge-up consistently without invoking any extra-mixing. A similar claim is also reported by Lattanzio (1989). According to Straniero et al. (1997), the solution resides rather in the time and mass resolution of the models. Clearly, several questions must be clarified. How influential is the numerical accuracy of AGB models in obtaining dredge-up? What is the role of extra-mixing below the envelope? Is extra-mixing necessary for obtaining 3DUP in current AGB models using the Schwarzschild criterion? If yes, how sensitive are the dredge-up characteristics to the extra-mixing parameters, about which little is known today? And, finally, what are the characteristics governing the 3DUPs?
The aim of this paper is to shed some light on these questions. They are, for a great part, related to the delicate question of convection and the determination of their boundaries in AGB models. The use of a local theory of convection, such as that of the mixing length theory (MLT), is certainly one of the greatest shortcomings still affecting stellar model calculations in general, and AGB models in particular. New non-local formulations are being developed (e.g. Canuto & Dubovikov 1998) and may, hopefully, be included in future calculations. For the present time, however, evolutionary AGB models are still performed using the MLT prescription – mainly due to computer time requirements –, and we also adopt it in this study. During the third dredge-up, however, the use of such a local prescription leads to the development of an (unphysical) discontinuity in the abundance profiles when the H-rich envelope penetrates into the H-depleted layers. The determination of the lower boundary of the convective envelope then becomes problematic, and requires a careful analysis of its stability against mixing across the discontinuity (i.e. extra-mixing). That problematic is set forth in Sect. 2. Several definitions involving the use of the Schwarzschild criterion and of extra-mixing are also presented in that section. Sections 3 to 6 then analyze the 3DUP predictions from AGB model calculations of a star of solar metallicity, computed both with and without extra-mixing. Section 3 describes the main characteristics of the code used to compute the models. A first set of calculations performed without any extra-mixing is analyzed in Sect. 4. It is shown that dredge-up does not occur in those conditions. In contrast, Sect. 5 shows that models calculated with extra-mixing lead naturally to the occurrence of the 3DUP phenomenon. The dredge-up laws derived from those calculations are presented in Sect. 6. Finally, some implications of those laws on stellar evolution along the AGB are analyzed in Sect. 7. Conclusions are drawn in Sect. 8.
2 On the convective boundaries in AGB stars
The criterion used in most stellar evolution calculations – and in all AGB models published to date – to delimit convective regions is that of Schwarzschild. According to that criterion, a layer is convective if , and radiative if . is the adiabatic temperature gradient, and the radiative temperature gradient given by
| (1) |
with , , , and being, respectively, the temperature, luminosity, Rosseland mean opacity, and mass contained in the sphere interior to the radius (other symbols having their usual meanings). The layer where defines the convection boundary, and is called the Schwarzschild layer.
Let us suppose for now that mixing of material inside a star can only occur through convection, and let us imagine the star as being composed of a finite number of shells located at increasing mass coordinates . Each shell is characterized by a temperature , density , luminosity and chemical composition . All these quantities vary with time . The Schwarzschild criterion tests locally the stability of each shell against convection by comparing derived from Eq. 1 with at the given shell independently of the values of those quantities in adjacent shells. Mixing of matter between two adjacent shells is allowed to operate only if both of them are found to be convective. Alternatively, the chemical composition of a radiative shell is not altered with time, according to the Schwarzschild criterion, unless and until its radiative gradient exceeds its adiabatic gradient. This could result from a change with time of , and/or (we neglect here changes due to nuclear burning). Applied in this strict definition, the local Schwarzschild criterion is called hereafter the strict Schwarzschild criterion. We note that the shell-representation of a star used in the above discussion corresponds to the numerical zoning performed during the computation of stellar models (by the finite difference method). Thus, stellar model calculations using the Schwarzschild criterion without any extra-mixing essentially use the strict Schwarzschild criterion. For this reason, the ‘strict Schwarzschild criterion’ is equivalently called, hereafter, the Schwarzschild criterion without extra-mixing.
Convection, however, is essentially non-local. Convective bubbles reaching the convection boundary do penetrate, on a whatever small distance, into the radiative layers. The chemical composition of a radiative layer adjacent to a convective zone may thus, in reality, be modified by this convective penetration. For it to occur in models using the Schwarzschild criterion, however, an extra-mixing procedure must be specified in the code (whether purely numerically or according to a physical prescription). In most cases, this extra-mixing does not affect the stability of the radiative layers adjacent to the convective zone. A short discussion of these cases is presented in Sect. 2.1. In some cases, however, this extra-mixing does modify the stability of those radiative layers. Those are discussed in Sect. 2.2. They characterize, in particular, the dredge-up phase in AGB stars. A third situation may be encountered in model stars where both of the above cases are present simultaneously. This is discussed in Sect. 2.3.
2.1 Case a: Stable Schwarzschild boundary
The most common case is encountered when the convection boundary lies in a region of smooth profile, such as in chemically homogeneous regions as illustrated in Fig. 1(a). This case characterizes, in particular, the bottom layers of the convective envelope in AGB stars during most of their pulse and interpulse phases.
It is easily seen that an extra-mixing of material from the convective envelope into the radiative layers does not alter the stability of those layers against convection. The Schwarzschild layer is thus said to be stable in the sense that an extra-mixing of matter from the convective zone into the underlying radiative layers does not, to first order, alter the location of the Schwarzschild layer.
Of course, the Schwarzschild layer does not necessarily locate correctly the boundary of the convective zone, since a penetration of the convective bubbles into the radiative layers (i.e. overshooting) may occur, the extent of which is still a question of debate. But such an overshooting does not, to first approximation, have any crucial consequence on the location of the Schwarzschild layer.

2.2 Case b: Unstable Schwarzschild boundary
During a 3DUP, the H-rich convective envelope penetrates into the H-depleted radiative layers, and gives rise to a discontinuous chemical profile [dotted line in Fig. 1(b)]. As a result, a concomitant discontinuity develops in the profile [solid line in Fig. 1(b); see also Iben 1976, Paczyński 1977, Frost & Lattanzio 1996]. A similar situation occurs during the core helium burning phase of most stars when the He-depleted convective core grows into the overlying He-rich layers.
In models using the Schwarzschild criterion without extra-mixing, the border of the convective zone is automatically located at the position of the hydrogen abundance discontinuity. As a result, no alteration of any chemical abundance is expected to occur in the radiative layers. The convection boundary remains located at this position as long as the value of on the radiative side of the discontinuity is below . Evolutionary AGB model calculations performed without extra-mixing confirm that no penetration of the convective envelope occurs beyond that point of discontinuity (see Sect. 4). It should be stressed that the Schwarzschild layer is undefined in those models, a situation which is clearly unphysical.
In reality, some matter does travel across the discontinuity. This results from the finite velocity of the bubbles at the convection boundary, since is positive. Models should thus include some sort of extra-mixing. The consequences of such a penetration can readily be evaluated: mixing of matter from the envelope into the radiative regions enriches the latter region with hydrogen and renders them unstable against convection. This in turn leads to further penetration of the envelope. The situation is thus unstable, in the sense that an extra-mixing of matter from the convective zone into the underlying layers does alter the location of the convective boundary.
The challenge facing AGB modelers is to provide a reliable description of this envelope penetration with simple (i.e. computer feasible) convection prescription. The analysis presented in Sect. 5 actually reveals that the penetration of the envelope into the H-depleted layers is rather insensitive to the extra-mixing parameters such as its extent or mixing efficiency. That main conclusion to be obtained in Sect. 5 is most welcomed since not much – not to say nothing – is known on the extra-mixing characteristics in AGB stars. Section 5 also shows that the use of a diffusive algorithm for the mixing of chemical elements enables to avoid the development of a discontinuity in the models, and to properly define the Schwarzschild layer.
2.3 Case c: Existence of a minimum in the profile
In massive AGB stars, the profile can display a minimum close to the lower boundary of the envelope, as illustrated in Fig.1(c). A situation can occur where two convective zones develop, separated by a radiative region around that minimum. This case combines the features of both previous cases: the outer convective zone has a smooth profile as in case a, while the inner one presents a discontinuity as in case b.
In models using the Schwarzschild criterion with no extra-mixing, the inner convective zone does not penetrate into the H-depleted regions due to the discontinuity (see Sect. 2.2). The outer zone, on the other hand, is free to deepen until it reaches the inner convective zone. The two convective zones then merge together, and the situation resumes to case b.
When extra-mixing is allowed to operate, a specific scheme is expected to develop. Because of the small amount of mass involved in the inner convective zone (), any extra-mixing into the He-rich layers reduces the hydrogen content of that convective zone, and renders its outermost layers stable. Those outermost layers are then progressively excluded from the convective zone as they reach convective neutrality, and a semi-convective zone is expected to develop111A semi-convective zone is defined here to be one throughout which partial mixing leads to convective neutrality (see, e.g., Mowlavi & Forestini 1994). This definition is not to be confused with other ones used in the literature, such as that whereby a semi-convective region is defined by , being the Ledoux adiabatic gradient (which takes into account the gradient of the mean molecular weight). Furthermore, the semi-convective zone discussed here, and located at the H-He discontinuity, is different from that described by Iben (1981), which is located at the He-C discontinuity.. Eventually, the main convective envelope penetrates into that semi-convective zone, and the case resumes to case b.
2.4 Conclusions
It is clear from the discussion in this section that models using the Schwarzschild criterion with no extra-mixing are inadequate to describe the 3DUP phenomenon. There is, however, a great deal of confusion in the literature on the third dredge-up predictions, and in particular on the role of extra-mixing. For the purpose of clarifying some of those issues, AGB models have been computed both with and without extra-mixing. Particular attention has been devoted to ensure that the code comply with the definitions given at the beginning of this section on the location of convection boundaries. The description and results of those calculations are presented in Sects. 3 to 5.
3 The stellar evolution code
The stellar evolution code used to compute the models is described in detail in Mowlavi (1995). Among the modifications brought to it since its conception in 1995, let me mention the use of interior radiative opacities taken from Iglesias & Rogers (1996) and the use of low-temperature ones from Alexander & Ferguson (1994). The convection energy transport is described as usually by the MLT, with the mixing length parameter taken equal to 1.5 in units of pressure scale height. The time-step and mesh allocation procedures relevant to our study are presented in more details in Sect. 3.1, while the mixing schemes of chemical elements are described in Sect. 3.2.
3.1 Time-step and mesh distribution
The time step between each model is determined, in most cases, by the relative variation of the dependent variables (radius, temperature, pressure and luminosity) from one model to the next such that it does not exceed 10% at any layer in the star. On the AGB phase, the time step is further limited to a maximum of , where is the time between two successive pulses. The time-step during the 19th interpulse phase, for example, is of the order of 25 y, and can decrease down to few hours during a pulse.
The mesh allocation is based on the constitutive differential equations, and ensures a relative accuracy in the finite difference method222Our criterion for the mesh allocation contrasts with that used in almost all existing stellar evolution codes where the mesh distribution is determined according to the relative variation of the dependent variables (except that of Wagenhuber & Weiss 1994 who use a method similar to ours). of better than (see Mowlavi 1995). Special care is taken around boundaries of convective regions and in regions with steep chemical abundance profiles in order to avoid spurious numerical chemical diffusion. Our models are characterized by about 3000 meshes during the interpulse phases, and by up to 8000 meshes during pulses.
3.2 Mixing
Instantaneous mixing is assumed in all convective zones in models with no extra-mixing. When a discontinuity in the profile is detected at the convection border, care is taken not to mix the material of the mesh comprising that discontinuity with the convective zone. This prevents a spurious numerical propagation of the convective zone into the radiative layers in unstable cases such as case b described in Sect.2.2, and guarantees a correct application of the Schwarzschild criterion described in Sect. 2.
In models with extra-mixing, a specific overshooting prescription is used beyond the Schwarzschild layer. The bubble velocity field in the radiative field is assumed to decay exponentially with the distance to the Schwarzschild layer, in the form
| (2) |
with
| (3) |
where subscripts and refer to quantities evaluated at the Schwarzschild boundary and at the edge of the overshooting region , respectively. The function ensures that vanishes at the outer edge of the overshooting region. It is close to unity in all the overshooting region except close to where it vanishes. Mixing in the convective overshooting regions is performed through an algorithm coupling diffusive mixing and nucleosynthesis (see Mowlavi 1995) with a diffusion coefficient equal to , where ( being the pressure scale height). The bubble speed at , , is determined from the bubble velocity profile in the convective zone as given by the MLT, while that at , , is determined by an ‘efficiency’ parameter according to Eq. 3. The extent of the overshooting region is determined by a second parameter, , defined such that locates the layer where , and being the pressure at and , respectively.
In those models with extra-mixing, the mesh distribution is increased in the overshooting regions by about 100 meshes in order to ensure a good description of the abundance profiles. The time-step is further reduced to about y during a 3DUP. A dredge-up episode is then covered by about 2000-3000 models.
Let us remark that a velocity field of the type of Eq. 2 is supported by recent hydrodynamical simulations of stellar convection in solar-type stars and white dwarfs (Freytag et al. 1996). However, we do not claim that such an overshooting pattern also applies to the envelopes of AGB stars, in which the physical conditions are quite different from those characterizing solar-type stars or white dwarfs. That remains to be confirmed by future hydrodynamical studies. We rather use such a prescription merely as a way to simulate an extra-mixing below the envelope and to analyze its effects on the 3DUP predictions. The extra-mixing could very well be associated with other ‘non-standard’ mixing processes such as, for example, diffusion induced by rotation or shear mixing. Actually, the results presented in Sect. 5 show that the dredge-up predictions are quite insensitive to the extra-mixing parameters.
4 Models without extra-mixing
4.1 Failure to obtain dredge-up
A set of standard333The word ‘standard’ refers throughout this paper to models calculated without any extra-mixing beyond the Schwarzschild layer. models of solar metallicity is computed with from the pre-main sequence phase up to the 32nd pulse on the TP-AGB phase. The maximum depth reached by the convective envelope after each pulse is shown in Fig. 2. The depth is expressed in terms of the mass separating the lower convective envelope boundary to either the H-He discontinuity (lower solid line) or the He-C one (upper solid lines). It is seen that the envelope does not penetrate into the He-rich layers (and a fortiori into the C-rich layers) during the first thirty two pulses.
The non-occurrence of the third dredge-up in those models is easily understood as resulting from the discontinuity in the H abundance when the convective envelope reaches the H-He discontinuity (case b described in Sect. 2.2). In those regions, the opacity is mainly determined by the Thompson opacity , where is the hydrogen mass fraction. It presents a jump across the composition discontinuity, with the H-rich layers being more opaque to radiation than the He-rich layers [Fig. 3(b)]. This discontinuity in translates into a similar discontinuity in [Fig. 3(a)], which prevents further penetration of the envelope into the H-depleted regions when no extra-mixing is allowed in the models.
It is instructive to recall that the structural readjustments characterizing the afterpulse phases result from the evacuation of a gravothermal energy (defined by , where , and are the pressure, density and internal energy, respectively) which develops at the bottom of the former pulse (Paczyński 1977). This translates into a positive gravothermal energy wave propagating outwards and reaching the H-rich layers in about 250 yr during the 19th afterpulse in our models (see Fig. 4). The luminosity at the bottom of the envelope, , increases concomitantly with time until the gravothermal energy has been evacuated [Fig. 4(b)]. As a result, increases too, and the convective envelope penetrates inwards until it reaches the H-He discontinuity. A further deepening of the envelope could be possible if the increase in overcomes the discontinuity in . In the standard models, however, this does not happen during the first thirty two pulses calculated so far.


Effect of mixing length parameter
The mixing length parameter is known to be very influential on the depth of convective envelopes (Wood 1981). In order to analyze its role in obtaining 3DUP in AGB models without extra-mixing, the standard star is recalculated from the first to the 23rd pulse with (i.e. similar to the value used by Straniero et al. 1997). The results are shown in dotted lines in Fig. 2. Indeed the convective envelope reaches deeper layers with than with 1.5. But they are not more successful in penetrating the He-rich layers. This contrasts with the results of Straniero et al. who claim to obtain dredge-up in their models without any extra-mixing.
Effect of stellar mass
Finally, a last set of standard models is calculated for a star of solar metallicity up to its 22nd pulse. It is indeed known that 3DUP should also be favored in more massive AGB stars (Wood 1981). The results of our model calculations are shown in Fig. 5. Again, no dredge-up is found in those models calculated without any extra-mixing, for reasons similar to those put forward for the standard models.
Effect of numerical accuracy

The analysis presented in this section shows that models using the local Schwarzschild criterion without extra-mixing do not lead to the occurrence of third dredge-up because of the discontinuity at the core’s edge. That conclusion should thus not be sensitive to the numerical accuracy of the models. Indeed, test calculations performed on the 19th afterpulse without extra-mixing, but with increased or decreased accuracies on both the time-step and mesh resolution lead to results identical to those presented in this section.
4.2 Useful relations
Some relations characterizing the evolution of the standard models are presented in this section. These will be useful in Sect. 6.
The first relation describes the evolution of the surface luminosity with core mass growth. The values of those quantities before the onset of each pulse of our standard models are displayed as filled circles in Fig. 6(a). It is well known that AGB models not experiencing dredge-up reach an asymptotic regime characterized by a linear relation between and . This is the famous relation, which writes from our models [dotted line in Fig. 6(a)]
| (4) |
and being given in solar units. A correction has to be applied to this relation in order to account for the lower luminosities of the first pulses. This correction is found to be well reproduced by an exponential function, and Eq. 4 becomes
| (5) |
This relation is shown in solid line in Fig. 6(a), and is seen to fit very well model predictions.

The second useful relation expresses the interpulse duration as a function of core mass growth. From our standard model calculations, shown in filled circles in Fig. 6(b), we find an asymptotic relation given by [dotted line in Fig. 6(b)]
| (6) |
being expressed in yr. Again, a correction has to be applied during the first pulses. The resulting relation writes [solid line in Fig. 6(b)]
| (7) |
5 Dredge-up in models with extra-mixing


5.1 Model results
The structural evolution of the 19th afterpulse of the standard star is recalculated in a set of models using the overshooting prescription described in Sect. 3.2, with . The structural evolution of the intershell layers of these models is shown in long dashed line in Fig. 7(a).
Clearly, the use of extra-mixing leads to the penetration of the convective envelope into the H-depleted regions, as expected from the discussion in Sect. 2.2. The role of overshooting in the 3DUP was already addressed by Iben (1976) and Paczyński (1977). The latter author, in particular, showed the essential role of extra-mixing in obtaining 3DUP. The envelope is seen in our models to deepen at a maximum dredge-up rate of /yr. The dredge-up lasts for about 120 yr, which corresponds to the time necessary for the gravothermal energy to evacuate from the bottom of the formal pulse to the stellar surface (see Fig. 4). of C-rich material is mixed into the envelope, which leads to a 16% increase in the surface carbon mass fraction.

| pulse | |||||||||
|---|---|---|---|---|---|---|---|---|---|
| number | () | () | () | (/y) | () | () | |||
| 12 | 0.6184 | 7928 | 5015 | 0.00665 | 0.00223 | 0.335 | 0.239 | 0.095 | |
| 15 | 0.6390 | 9260 | 6117 | 0.00679 | 0.00354 | 0.521 | 0.222 | 0.247 | |
| 19 | 0.6657 | 10912 | 7600 | 0.00650 | 0.00437 | 0.672 | 0.206 | 0.337 | |
| 25 | 0.7019 | 13140 | 9760 | 0.00566 | 0.00524 | 0.926 | 0.200 | 0.566 | |
| 32 | 0.7382 | 15575 | 12720 | 0.00480 | 0.00473 | 0.985 | 0.199 | 0.388 |

It is instructive to stress that the extent of the overshooting region below the envelope comprises less than . This is 40 times less than the total amount of material dredged-up. Overshooting alone can thus not explain the amount of material dredged-up. Indeed, the occurrence of dredge-up essentially results from the unstable character of the convection border in the standard models (see Sect. 2.2). Extra-mixing has the role of triggering the penetration of the envelope into the H-rich layers. Had we, at any time during the dredge-up, suppressed the extra-mixing procedure in the model calculations, the envelope would have stopped from further penetration for reasons described in Sect. 4.
The use of a diffusive extra-mixing procedure results in models displaying smooth profiles as shown in Fig. 8(a). This enables to locate properly the Schwarzschild layer. It should be noted, however, that the Schwarzschild layer is still unstable in the sense that more mixing of hydrogen from the envelope into the deeper layers renders them unstable against convection, leading thereby to further penetration of the envelope.
The question then arises of the sensitivity of the dredge-up characteristics to the extra-mixing parameters. In order to answer that question, two other sets of models are calculated, one with increased extra-mixing extent and efficiency of , and one with lower extra-mixing extent and efficiency of . The predictions from those sets are displayed in Fig. 7 in dotted and short-dashed lines, respectively. It is seen that the dredge-up characteristics are rather insensitive to the extra-mixing parameters. In particular, the dredge-up rate is independent of the extra-mixing parameters, and equals /yr in all three sets of calculations. The only small difference between the different sets is the earlier time, in models with higher , at which the envelope reaches the H-depleted regions.
The important conclusion that the dredge-up characteristics are rather insensitive to the extra-mixing parameters can be understood from basic considerations on the dredge-up process, developed in Sect. 6. It allows, in particular, to analyze the 3DUP phenomenon without worrying much about the exact values of the overshooting parameters. In order to perform such an analysis as a function of stellar parameters, additional calculations with extra-mixing are performed on the 12th, 15th, 25th and 32nd afterpulses of the standard star. The resulting structural evolution of the intershell layers are shown in Fig. 9, and some of their characteristics summarized in Table 1.
Dredge-up rate
The dredge-up rate is seen from Table 1 to be an increasing function of the pulse number. A linear relation between and is found from the model calculations, as shown in Fig. 10(a). It translates into the following equation for our star [dashed line in Fig. 10]
| (9) |
and being expressed in and yr-1, respectively.
Dredge-up efficiency
The depth reached in mass coordinates by the envelope after each pulse depends on both the time over which it penetrates and the dredge-up rate. The former is mainly determined by the thermal time-scale for the evacuation of the gravothermal energy accumulated at the bottom of the pulse (Fig. 4), while the latter is determined by the time-scale of the thermal readjustment of the envelope. The resulting mass of C-rich material dredged-up in the envelope, , is reported in Table 1.
The dredge-up efficiency is traditionally expressed by a number , which is the ratio of to the core mass increase due to hydrogen burning during two successive pulses. A value of , for example, implies a constant core mass from one pulse to the next. From the model calculations, is found to also increase linearly with [filled circles in Fig. 10(b)]. The linear relation writes [dotted line in Fig. 10(b)]
| (10) |
being expressed in solar mass.
Evolution of surface characteristics during the dredge-up
The evolution of the surface luminosity and radius during the 3DUP is shown in Fig. 7(c,d) (solid lines), and compared to that predicted by models without dredge-up (dotted lines). It is seen that dredge-up leads to surface luminosities lower than those obtained in otherwise similar models but without dredge-up. That the luminosity should be lower in models with dredge-up is easily understood from the above discussion, since the penetration of the envelope absorbs energy in order to lift the dredged-up material into the envelope (see also Paczyński 1977). Dredge-up also leads to lower surface radii.
5.2 Influence of convection prescription
While the dredge-up characteristics are found to be rather insensitive to the extra-mixing parameters, a dependency of those characteristics on the convection prescription in the envelope should be discussed. Higher values of are known to favor deeper convective envelopes (Wood 1981). The envelope would thus reach the H-depleted layers sooner and lead, for an otherwise similar dredge-up rate, to more C-rich material being dredged-up. Moreover, the dredge-up rate itself should also be affected by the convection prescription. The analysis presented in Sect. 6.1 stresses on the role of the thermal response of the envelope in the dredge-up process. The thermal time-scale of the envelope depends on its thermal structure, which is imposed by the surface conditions and the parameter. We thus expect the dredge-up rate to be also dependent on . A test calculation on the 19th afterpulse of the computed with leads to /yr with =. This has to be compared with a predicted dredge-up rate of /yr at that core mass in models with (from Eq. 9). Models with thus predict higher dredge-up rates by about 16% than those in models with .
5.3 Comparison with other published works
The calculations presented in Sects. 4 and 5 lead to a simple conclusion about AGB models using the Schwarzschild criterion: models computed without any extra-mixing do not lead to dredge-up while those using an extra-mixing procedure lead to efficient dredge-up.
How does this compare to model calculations published in the literature? The answer to that question requires the knowledge of the precise numerical procedures used by each AGB modeler in their code. Such information is often not available in the literature. For this reason – and because it is anyway outside the scope of this paper to do so – it is impossible to compare all published models. Some of them are however discussed below.
Many AGB calculations of the last five years do not report the occurrence of the 3DUP (Vassiliadis & Wood 1993, Wagenhuber & Weiss 1994, Blöcker 1995, Forestini & Charbonnel 1997). This is consistent with their working hypothesis of the Schwarzschild criterion without extra-mixing.
Several codes use an extra-mixing procedure based on a purely numerical technique. Boothroyd and Sackmann (1988a), for example, mix the radiative layer adjacent to the convective zone before checking for its stability. If the ratio of that (formally stable) layer is found to be greater than one after mixing, then they declare it convective. As this mixing procedure is performed once per model calculation, it allows a numerical propagation of the convective envelope during the 3DUP. This might be the reason for their success in obtaining low-mass carbon stars (Boothroyd & Sackmann 1988b). A similar technique was already used by Paczyński (1977). This last author obtained dredge-up in AGB models with such a numerical ‘overshoot’ procedure, while no dredge-up resulted in models not including that overshoot. The use of extra-mixing procedures based on a purely numerical technique suffers from at least two shortcomings. First, they assume instantaneous mixing of the layer(s) added to the envelope. Besides being unphysical, it may lead to convergence difficulties. Second, they would probably depend on the numerical accuracies of the models such as the time-step and mesh re-zoning. As a result, such models may or may not lead to efficient dredge-up.
Herwig et al. (1997) use an overshooting algorithm which assumes an exponentially decreasing bubble velocity field in the extra-mixing region. Their algorithm is very similar to mine, and enables a direct comparison of their predictions with mine. These are reported in Fig. 10(b) ( signs). Interestingly, they find higher dredge-up efficiencies than I do at a given stellar luminosity. We note that they use in their calculations. This could explain part of the differences. We further note that their core masses are lower by about than mine at a given pulse number, which could imply a dependence of the dredge-up efficiencies on the initial conditions at the onset of the AGB.
Finally, the recent work of Straniero et al. (1997) should be mentioned. These authors obtain dredge-up in models of 1.5 and stars without using any extra-mixing procedure in their calculation. This seems in contradiction with my conclusions. Private discussions with some of the authors in Straniero et al. (1997) seemed to confirm that they did not use any extra-mixing in their model calculations. They explain their results by the higher temporal and spatial resolution of their models (see their paper for more details). This conclusion, too, is not supported by my calculations reported in Sect. 4. While I do not understand their results, I cannot push the analysis much further. In any case, the dredge-up efficiencies found in their models are lower than those predicted from my calculations including extra-mixing. Their predictions are reported in Fig. 10(b) ( signs).
6 Third dredge-up laws
6.1 The dredge-up process
The important conclusion that the dredge-up rate is insensitive to the extra-mixing parameters can be understood from the following considerations. The AGB star is basically formed by an -degenerate core of 0.10-0.15 R⊙ surrounded by an extended H-rich envelope. As dredge-up proceeds, the outermost H-depleted layers of the core become part of the envelope and expand [which translates into a negative gravothermal energy production in those layers, see Fig. 8(c)]. This results in an increase of the potential energy of those layers engulfed in the convective envelope, which must be supplied by the luminosity provided by the inner layers. The maximum dredge-up rate is then determined by the thermal relaxation time-scale of those layers expanding into the envelope during the dredge-up.
Let us estimate that dredge-up rate from simplified arguments. The potential energy of a mass located at the H-He discontinuity is given by
| (11) |
where is the mass of the H-depleted core and its radius (i.e. during dredge-up). The energy necessary to lift the dredged-up material into the envelope is provided by the luminosity at the core edge, . The thermal time-scale for the dredge-up is then
| (12) | |||||
All quantities in this section are expressed in solar units and years. The dredge-up rate can then be estimated by
| (13) | |||||
Typical values for the star are [Fig. 7(a)], [Fig. 8(d)] and [Fig. 4(b)]. Equation 13 then gives /yr. This estimate of the dredge-up rate, while giving only an order of magnitude, convincingly supports the rate of /yr obtained in the full evolutionary models (Sect. 5). It is also consistent with the results obtained by Iben (1976), who estimated the dredge-up rate to be about /yr in a star with , and with those of Paczyński (1977), who found /yr in a star with .
The question of why the dredge-up rate is independent of the extra-mixing parameters can further be understood by comparing the time-scale of the thermal readjustment of the envelope with the typical time-scale of convective bubbles to cross the H-He transition zone. The velocity of the convective bubbles as they approach the H-He discontinuity is of the order of /yr, which translates in terms of mass to about /yr (from Fig. 8(d)). This rate is much higher than the dredge-up rate of /yr established above. The deepening of the envelope into the H-depleted layers is thus primarily fixed by the thermal relaxation time-scale of the envelope, rather than by the speed of the convective bubbles penetrating into the H-depleted layers.
6.2 Dredge-up characteristics
Equation 13 reveals a formal dependence of the dredge-up rate on , and .
Those three stellar parameters are not independent of each other. Refsdal & Weigert (1970) and Kippenhahn (1981), for example, show from homology considerations that most red giant star properties are functions of the H-depleted core mass and radius. As the burning shell advances, the structure of the intershell layers evolves, to first approximation, like homologous transformations. Let us consider two times and characterized by core masses, radii and luminosities of , and , respectively, at time , and , and , respectively, at time . Then the homology transformations applied to a AGB star lead to (Kippenhahn 1981, Herwig et al. 1998)
| (14) |
The dredge-up rate at time can then easily be evaluated from that at time , . Equations 13 and 14 lead to
| (15) |
The homology transformations thus suggest a linear relation between the dredge-up rate and the core mass.
In standard AGB calculations (i.e. without dredge-up), is a linear function of (Eq. 8 for our star). Equation 14 then recovers the classical linear - relation. In that case, is a linear function of either , or . The dredge-up predictions presented in Sect. 5 essentially obey these rules (Table 1), since the dredge-up calculations have been performed on selected afterpulses of the standard models and do not include the feedback of the dredge-ups on the AGB evolution.
When the feedback of dredge-up on the structural evolution is taken into account, the core radius is no more a linear relation of the core mass, and the linear - does not hold any more (Herwig et al. 1998). It must be replaced by a -- relation as suggested by Eq. 14. Equation 15, however, reveals that the dredge-up rate keeps a linear dependency on even in models experiencing dredge-up.
The implications of the linear - relation on the core mass evolution are analyzed in Sect. 7.1.
7 Dredge-up and the formation of white dwarfs
The dredge-up laws established in Sects. 5 and 6 allow an approximate study of the structural evolution of AGB stars without actually performing full AGB model calculations. This is the so called ‘synthetic’ AGB calculation technique.
Such a study is outside the scope of the present paper. However, a preliminary analysis of the synthetic evolution of a star with dredge-up is presented in Sects. 7.2 and 7.3 using simplified assumptions. But before doing that, the implications of the linear dependence of the dredge-up rate on the core mass is first discussed in Sect. 7.1.
7.1 Core mass evolution and the formation of white dwarfs
The analysis presented in Sect. 6 supports a linear relation between and . I assume that such a linear relation remains valid between and even when the feedback from the dredge-ups on the structural AGB evolution is taken into account.
Such a linear relation between and has an important consequence on the core mass reached at the end of the AGB evolution. Equation 10 predicts that reaches unity at . It is easy to see that the feedback between and leads to the evolution of towards an asymptotic value . Indeed, if , then and the core mass increases from one pulse to the next. If , then and the core mass decreases from one pulse to the next. At , the amount of material dredged-up from the core during the 3DUP equals that added to the core by H-burning during the interpulse phase, and remains constant from one pulse to the next. We thus expect to level off at unity, and to reach . This puts an upper limit to the mass of white dwarf remnants (which is for our star), and helps to constrain the predicted initial-final mass relation for white dwarfs.
7.2 Structural evolution

According to Eq. 9, dredge-up begins to operate in our star around the 10th pulse, at . This is where we begin our synthetic evolution. We assume that the star has reached its asymptotic regime, which is a good enough assumption (see Fig. 6) for our purposes.
The evolution of is governed, on the one hand, by its increase due to hydrogen burning during the interpulse. For a solar metallicity star, is given by (all quantities in this section are expressed in solar units and in years)
| (16) | |||||
where the luminosity of the H-burning shell is approximated by the surface luminosity (at the time of the maximum extension of the next pulse). The factor is introduced in order to account for the fact that the mean surface luminosity during the interpulse is actually lower than that at the the next pulse. From the standard model calculations, we find . After each pulse, on the other hand, decreases as a result of the 3DUP. The amplitude of this decrease is given by , where is estimated from Eq. 10. The resulting net increase in from one pulse to the next is then
| (17) |
In model calculations without dredge-up, the change in luminosity from one pulse to the next in the asymptotic regime is given by Eq. 4, while the change in the core radius is given by Eq. 8. In the presence of dredge-up, those relations must be modified. For , a dependence on is suggested from Eq. 14, and we adopt
| (18) |
For , we make the assumption that the time evolution of remains unaffected by the dredge-ups. Equations 6 and 8 then determine as a function of time .

Finally, the interpulse duration is assumed not to be altered by the dredge-up episodes, and is given by Eq. 7.
The predictions of our synthetic calculations are displayed in Figs. 11 (time evolution) and 12 (- evolution). As expected from the discussion in Sect. 7.1, increases towards unity and the core mass towards the asymptotic value of . The luminosity, however, increases continuously. This results from the fact that depends not only on but also on according to Eq. 14. Had we used a linear relation, then would have evolved towards an asymptotic value (of about for our star) in a similar way as does . The non-linearity of with is made clear in Fig. 12.
The assumptions underlying those synthetic calculations certainly are too simplistic. For example, the feedbacks of dredge-up on , or have been neglected, and relations 14 and 15 need to be confirmed by model calculations following the dredge-ups all along the AGB evolution. Yet, the main conclusions, such as the existence of a limiting towards which the core mass evolves asymptotically, should qualitatively be correct.
Effects of mass loss
A last word about the effects of mass-loss. The amplitude of mass loss depends mainly on the surface radius and effective temperature (and thus on ). Those are expected to be modified by the dredge-ups (Fig. 7). However, the time evolution of [Fig. 11(c)] reveals that they are not as much affected as is . As a result, mass loss is expected to be higher in models with dredge-up than in those without, at a given . In other words, mass loss will eject the AGB’s envelope at a much lower value of in the presence of dredge-up. For example, let us suppose that a superwind suddenly ejects all the envelope of the star at . Figure 13 then predicts that the mass of the white dwarf’s remnant would be in the presence of dredge-ups. This is much lower than the predicted white dwarf’s mass of predicted in the absence of dredge-up. Mass loss combined with dredge-ups thus further helps to constrain the mass of white dwarf remnants.
7.3 Carbon star formation
Let us now follow through our synthetic calculations the carbon abundance predicted at the surface of a star. The amount of carbon dredged-up to the surface, , is given by
| (19) |
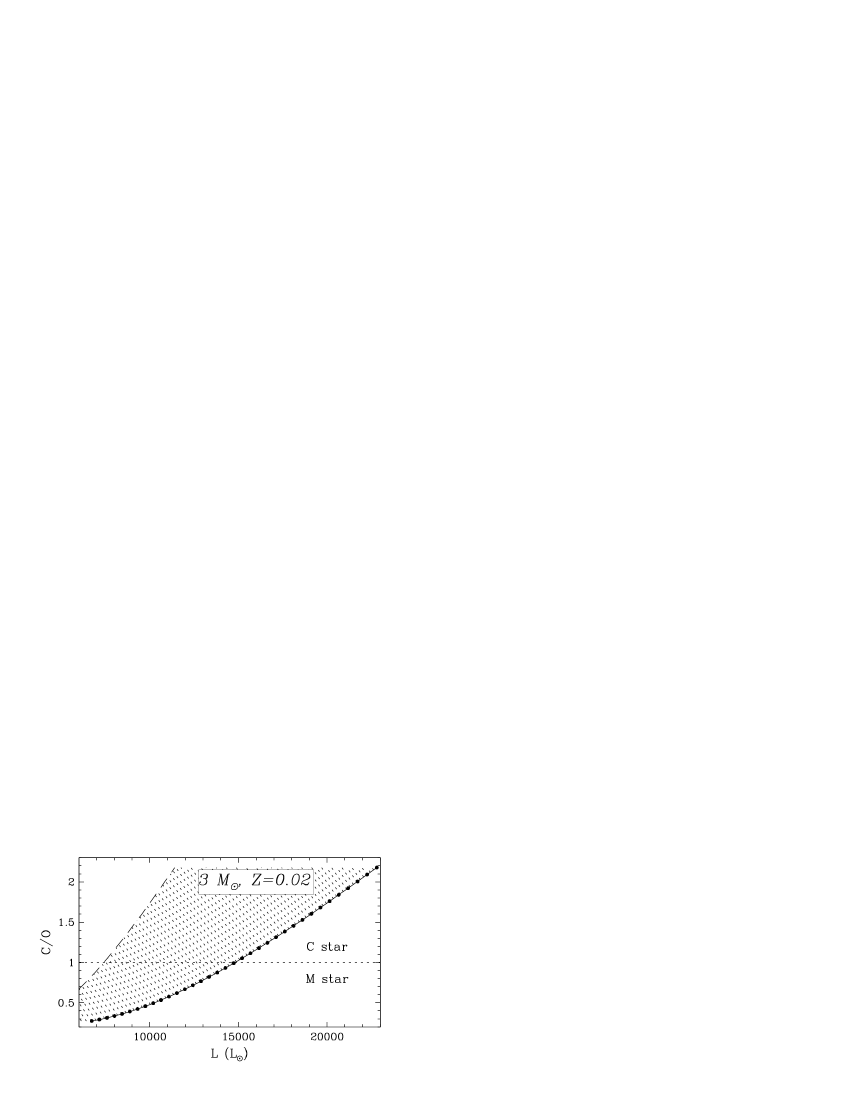
where is the mass fraction left over by the pulse in the intershell layers. From the values reported in Table 1, a mean value of can be assumed. The initial and mass fractions in the envelope are taken from our standard star at the beginning of the TP-AGB phase, and are equal to and , respectively. The resulting evolution of the surface C/O number ratio is shown in Fig. 13. It is seen that a star satisfying Eq. 10 becomes a C star after about twenty dredge-up episodes, at . Furthermore, it is known that the luminosity decreases by a factor of almost two during about 20% of the interpulse phase. This means that the star displayed in Fig. 13 could be observed as a C-star at luminosities as low as .
I should stress that the effects of mass loss have been neglected in those synthetic calculations, being outside the scope of this article. Mass loss would decrease the dilution factor of into the envelope, but would probably also decrease the dredge-up efficiency. Those effects should be considered in a future, more detailed, study of C star formation.
8 Conclusions
The analysis presented in this paper addresses several questions regarding the occurrence of 3DUP in AGB star models, the laws governing that phenomenon, and some of its implications on the structural and chemical evolution of those stars. The analysis is based on model calculations of a star using the Schwarzschild criterion and performed either with or without extra-mixing.
Modeling dredge-up in AGB stars
The use of a local criterion to delimit convection borders, such as that of Schwarzschild, and without any extra-mixing is shown to lead to an unphysical situation which prevents the deepening of the convective envelope into the H-depleted regions, and which thus also prevents the occurrence of the 3DUP (Sect. 2). The Schwarzschild layer is undefined in those models due to the development of a discontinuity in the hydrogen abundance profile at the bottom of the convective envelope. Model calculations using no extra-mixing confirm the failure to obtain dredge-up in those conditions (Sect. 4). That conclusion is found to be independent of the mixing length parameter, stellar mass, or numerical space and time resolution of the models. Models using the Schwarzschild criterion with no extra-mixing are thus inadequate to describe the 3DUP phenomenon.
Models of the same star but using extra-mixing, on the other hand, lead to efficient dredge-ups from the 11th pulse on (Sect. 5). This results directly from the unstable character of the lower boundary of the envelope against extra-mixing (Sect. 2.2). The calculations further reveal that the dredge-up characteristics are insensitive to the extra-mixing parameters (such as the extra-mixing extent and efficiency). This important conclusion is most welcomed since nothing is known yet about the characteristics of the extra-mixing expected to occur in AGB stars. It enables, in particular, to study the dredge-up characteristics with some confidence and without worrying about the extra-mixing parameters.
Although the dredge-up predictions are rather insensitive to the extra-mixing parameters, a proper handle of the extra-mixing procedure is essential in order to obtain reproducible predictions. In particular, a purely numerical extra-mixing can lead to model-dependent predictions (Sect. 5.3; see also Mowlavi 1999a). The use of instantaneous mixing in the extra-mixing region can also lead to convergence difficulties. The calculations presented in this paper use a diffusive overshooting with a decreasing bubble velocity field in the extra-mixing region. It leads to smooth chemical abundance profiles and to a proper location of the Schwarzschild layer.
The dredge-up process
The insensitivity of the dredge-up predictions on the extra-mixing parameters results from the fact that the dredge-up rate is limited by the time scale of the thermal readjustment of the envelope (Sect. 6.1). As dredge-up proceeds, H-depleted matter is lifted from the core into the envelope and its thermal state must relax to that of the envelope (see also Mowlavi 1999b). The dredge-up rate is estimated to /yr from model calculations (Sect. 5). This is also what is expected from an analytical estimation using simplified arguments of the physics involved in the dredge-up process (Sect. 6.1).
Dredge-up laws
The model calculations performed with extra-mixing on selected afterpulses of the standard star predict linear relations both between the dredge-up rate and core mass (Eq. 9) and between dredge-up efficiency and core mass (Eq. 10). In those calculations where the feedback of dredge-up on the AGB evolution is not taken into account, the dredge-up rate and efficiency further depend linearly on the stellar luminosity.
When the feedback of dredge-up on the AGB evolution is taken into account, the analysis presented in Sect. 6 suggests that the dredge-up rate keeps its linear dependence on the core mass. This conclusion is valid if the relation is of the form of Eq. 14, being the radius of the H-depleted core. In that case, we expect the dredge-up efficiency to level off at , at which point the core mass does not increase anymore from one pulse to the next. The asymptotic core mass of the star model presented in this paper is (Sect. 7.1).
Consequences on the AGB evolution
The synthetic calculations performed in Sect. 7 confirm the asymptotic evolution of the dredge-up efficiency towards unity and of the core mass towards . This helps to constraint the initial-final mass relation of white dwarfs, giving an upper limit for the mass f the white dwarf remnant.
The surface luminosity is not as much affected by the dredge-ups as is . This results from the adopted relation combined with the continuous decrease of . The non-validity of the linear relation, assumed in Eq. 18, is made evident in Fig. 12. The increase in with time predicted by the synthetic calculations is only slightly less steep than the increase predicted in the standard calculations without dredge-up (Fig. 11).
Mass loss can further constrain the initial-final mass relation of white dwarfs, because it depends on the luminosity through the stellar radius and effective temperature (Bowen & Willson 1991), and because the luminosity increases with time despite the leveling of . We thus expect mass loss [or superwind(s)] to peal off the AGB’s envelope at a lower core mass than in models not experiencing dredge-up. For example, if a superwind is assumed to eject all the envelope when the star reaches , the star models with dredge-up predict the formation of a white dwarf remnant of . This has to be compared with a predicted remnant of in the absence of dredge-up. The synthetic calculations presented in Sect. 7 are, however, preliminary and based on simplified assumptions. Future investigations along these lines should refine the quantitative predictions given in this paper.
Finally, a carbon star is predicted to form after about twenty pulses experiencing dredge-up (i.e. at about the 25th-30th pulse on the AGB), at . Taking into account the luminosity dip experienced during about 20% of the following interpulse time, such a C star could be observed at luminosities as low as .
Acknowledgments. I thank Drs. A. Jorissen and G. Meynet for their careful reading of the first version of this article, and Dr. G. Meynet for many useful discussions.
References
- (1) Alexander D.R., Ferguson J.W., 1994, ApJ 437, 879
- (2) Blöcker T., 1995, A&A 297, 727
- (3) Boothroyd A.I., Sackmann I.-J., 1988a, ApJ 328, 653
- (4) Boothroyd A.I., Sackmann I.-J., 1988b, ApJ 328, 671
- (5) Bowen G.M., Willson L.A., 1991, ApJ 375, L53
- (6) Canuto V.M., Dubovikov M., 1998, ApJ 493, 834
- (7) Forestini M., Charbonnel C., 1997, A&AS 123, 241
- (8) Freytag B., Ludwig H.-G., Steffen M., 1996, A&A 313, 497
- (9) Frost C.A., Lattanzio J.C., 1996, ApJ 344, L25
- (10) Fujimoto M.Y., Nomoto K., Sugimoto D., 1976, Publ. Astron. Soc. Japan 28, 89
- (11) Herwig F., Blöcker T., Schönberner D., El Eid M., 1997, A&A 324, L81
- (12) Herwig F. et al., 1998, A&A, submited
- (13) Iben I. Jr., 1975, ApJ 196, 525
- (14) Iben I. Jr., 1976, ApJ 208, 165
- (15) Iben I. Jr., 1981, ApJ 246, 278
- (16) Iglesias C.A., Rogers F.J., 1996, ApJ 464, 243
- (17) Jorissen A., Smith V.V., Lambert D.L., 1992, A&A 261, 164
- (18) Kippenhahn R., 1981, A&A 102, 293
- (19) Lattanzio J.C., 1986, ApJ 311, 708
- (20) Lattanzio J.C., 1987, ApJ 313, L15
- (21) Lattanzio J.C., 1989, ApJ 344, L25
- (22) Mowlavi N., Forestini M., 1994, A&A 282, 843
- (23) Mowlavi N., 1995, Ph. D. Thesis, Université Libre de Bruxelles444Postscript file available by anonymous ftp on ‘obsftp.unige.ch’ in ‘pub/mowlavi’, or on the WWW at ‘http://obswww.unige.ch/mowlavi/publications’.
- (24) Mowlavi N., 1998a, in ‘Tours Symposium on Nuclear Physics III’, eds. M. Arnould, M. Lewitowicz, Yu. Ts. Oganessian, M. Ohta, H. Utsunomiya, T. Wada, AIP Conf. Proc. 425, New-York, p. 5074
- (25) Mowlavi N., 1998b, in ‘Cosmic Chemical Evolution’, IAU Symp. 187, in press4
- (26) Mowlavi N., 1998c, in ‘Abundance Profiles: Diagnostic Tools for Galaxy History’, eds. Friedli D., Edmunds M.G., Robert C., Drissen L., ASP Conf. Series 147, 1664
- (27) Mowlavi N., 1999a, in ‘Nuclei in the Cosmos V’, ed. N. Prantzos, Editions Frontières, France, in press4
- (28) Mowlavi N., 1999b, in ‘Asymptotic Giant Branch Stars’, IAU Symp. 191, eds. Le Bertre T., Lebre A., Waelkens C., PASP, in press4
- (29) Paczyński B., 1977, ApJ 214, 812
- (30) Refsdal S., Weigert A., 1970, A&A 6, 426
- (31) Sackmann I.-J., Boothroyd A.I., 1991, in ‘Evolution of Stars: The Photospheric Abundance Connection’ (IAU Symp. 145), eds. Michaud G., Tutukov A., Kluwer Acad. Publ., p 275
- (32) Schwarzschild M., Härm R., 1965, ApJ 142, 855
- (33) Straniero O., Chieffi A., Limongi M., Busso M., Gallino R., Arlandini C., 1997, ApJ 478, 332
- (34) Sugimoto D., Nomoto K., 1975, Publ. Atron. Soc. Japan 27, 197
- (35) Vassiliadis E., Wood P.R., 1993, ApJ 413, 641
- (36) Wagenhuber J., Weiss A., 1994, A&A 286, 121
- (37) Wood P.R., 1981, in ‘Physical Processes in Red Giants’, eds. Iben I.Jr., Renzini A., D. Reidel Publishing Company, p 135