NaSt1: A Wolf-Rayet star cloaked by an Car–like nebula?
Abstract
We present a study of the peculiar Galactic emission line object NaSt1 (WR122, IRAS 18497+0056) which has previously been classified as a Wolf-Rayet (WR) star. Our spectroscopic dataset comprises Keck I-HIRES, WHT-ISIS and UKIRT-CGS4 observations which show that NaSt1 has a highly reddened nebular spectrum with extremely strong permitted and forbidden lines covering a wide range in excitation (H i, He i-ii, N i-iii, [N ii], [Ne iii-iv], Mg i-ii, Si ii, [S ii-iii], [Ar iii-v], [Ca v-vii], [Fe ii-vii], [Ni ii-iii]). [O ii-iii] is unusually weak, with He i-ii and [N ii] very strong, and carbon absent, suggestive of chemical peculiarities. Narrow-band WHT imaging reveals an elliptical nebula with an average diameter of 6.8 arcsec. We measure an interstellar extinction of 2.1 mag and estimate a distance of 1–3 kpc, suggesting that NaSt1 is a luminous object, with 4log ()6.5. We determine the physical parameters and abundances from the nebular forbidden lines. For K and cm-3, we obtain He/H, N enhanced by a factor of 20, O deficient by a factor of 140, while Ne, Ar and S are normal compared to average H ii region abundances. This unusual abundance pattern suggests that the nebula consists of fully CNO-processed material. We compare the spectral appearance of NaSt1 with other luminous emission objects, and conclude that it is not an Ofpe/WN9, B[e] star or symbiotic nova although it does share several characteristics of these systems. We suggest instead that NaSt1 contains a massive evolved star that ejected its heavily CNO-processed outer layers a few thousand years ago. Although the stellar remnant is completely hidden from view by the dense nebula, we argue that the star must be an early-type WR star. The only object that shares some of the peculiarities of NaSt1 is Carinae. Whatever its true nature, NaSt1 should no longer be considered as a late-WN classification standard in the near-IR.
keywords:
stars: individual (NaSt1) – stars: emission-line – stars: peculiar – stars: Wolf-Rayet – ISM: H ii regions1 Introduction
Relatively few peculiar emission line objects identified from H surveys in the 1960’s (e.g. Henize 1967, 1976) have been studied in detail, principally because they are faint and suffer from heavy reddening. However, advances with instruments combined with the availability of 8–10m telescopes now permit the routine observation of such objects, which may provide new information on stellar systems and evolution.
One such object is NaSt1 (V mag), discovered by Nassau & Stephenson (1963) who proposed a Wolf-Rayet (WR) classification because of its strong emission line spectrum. Its appearance, however, was quite unlike any previously known WR star in the Galaxy or Large Magellanic Cloud (Massey & Conti 1983). Nevertheless, Massey & Conti proposed a cool, late type nitrogen sequence WN10 spectral type for NaSt1, and it was included in the sixth WR catalogue as WR122 (van der Hucht et al. 1981).
| – Spectroscopy – | |||||
| Date | Telescope | Wavelength | Exp. | Sp. Res. | PA |
| Instrument | (nm) | (sec) | (nm) | (∘) | |
| 29 Jul 1994 | WHT–ISIS | 382–462 | 1800 | 0.16 | 26 |
| 531–622 | 1800 | 0.17 | 26 | ||
| 611–703 | 60 | 0.17 | 26 | ||
| 01 Aug 1994 | WHT–ISIS | 382–462 | 1800 | 0.16 | 353 |
| 458–538 | 1800 | 0.16 | 353 | ||
| 19 Aug 1994 | UKIRT–CGS4 | 1028–1132 | 128 | 1.4 | 90 |
| 2007–2215 | 64 | 2.6 | 90 | ||
| 21 Aug 1994 | UKIRT–CGS4 | 1228–1332 | 320 | 1.5 | 90 |
| 1606–1814 | 128 | 2.8 | 90 | ||
| 2055–2062 | 1280 | 0.13 | 90 | ||
| 13 Oct 1994 | Keck I–HIRES | 435–679 | 1500 | 0.01 | 0 |
| 632–875 | 600 | 0.02 | 0 | ||
| – Imaging – | |||||
| Date | Telescope | Wavelength | Exp. | FWHM | |
| Instrument | (nm) | (sec) | (nm) | ||
| 12 Aug 1996 | WHT–AUX | 469.1 | 350 | 4.9 | |
| 588.1 | 50 | 4.6 | |||
| 656.5 | 50 | 6.0 | |||
| 659.0 | 200 | 1.6 | |||
More recently, van der Hucht, Williams & Thé (1984) and Williams, van der Hucht & Thé (1987) have obtained infra-red (IR) photometry of NaSt1, and the closely related object LS4005 (WR85a), revealing the presence of circumstellar dust shells. van der Hucht et al. (1989, 1997) reported moderate IR photometric variability for NaSt1 and argued against a WR nature, instead preferring an alternative (massive) emission line nature (either B[e], O[e] or Ofpe/WN9) based on optical and infrared spectroscopy. B[e] supergiants appear to represent objects with an equatorial excretion disk plus an OB-type stellar wind in the polar regions. Ofpe/WN9 stars – now revised to WN9–11 (Smith, Crowther & Prinja 1994) – are intimately related to Luminous Blue Variables (LBVs) and classical WR stars (Crowther & Smith 1997).
NaSt1 has recently received renewed attention principally because it is extremely bright in the IR (K mag). Blum, DePoy & Sellgren (1995), Tamblyn et al. (1996), Morris et al. (1996), and Figer, McLean & Najarro (1997) have presented a spectral comparison of various emission line objects, including NaSt1, still adhering to its former WN10 or Ofpe/WN9 classifications. Indeed, NaSt1 is currently used as a late WN-type spectral standard, particularly for IR studies of WR stars near the Galactic Centre, despite its nature being uncertain.
In this paper we present new data for NaSt1 and consider its true nature. Specifically, in Section 2 we report on new spectroscopy of NaSt1, obtained at the Keck I, William Herschel Telescope (WHT), and UK Infrared Telescope (UKIRT). In Section 3 we discuss these new observations revealing a peculiar nebular appearance. In Section 4 we use various techniques to determine the interstellar extinction and distance to NaSt1, while we obtain its nebular properties and abundances in Section 5. We finally interpret our results and discuss possible natures for NaSt1 in Section 6.


2 Observations
We have obtained intermediate to high spectral resolution optical and infrared spectroscopy of NaSt1 during 1994 July–October at the 10m Keck I, 4.2m WHT and 3.8m UKIRT telescopes. These data were complemented by narrow-band filter imaging with the auxiliary port of the WHT during August 1996. The journal of our observations is presented in Table 1.
2.1 Optical observations
Intermediate dispersion spectroscopy of NaSt1 between 3820–7030 Å were obtained at the 4.2m WHT, during July–August 1994 using the the dual beam Intermediate dispersion Spectroscopic and Imaging System (ISIS). These observations, obtained in good seeing (0.8′′) used 600 l/mm gratings on both arms of ISIS, with Tektronix and EEV CCDs (both 24m pixels) on blue and red arms, respectively. A 1′′ slit width resulted in a spectral resolution of 1.6Å (blue), and 1.7Å (red) as determined from widths of CuAr and CuNe arc lines. The data were de-biased, divided by a normalised flat-field, and optimally extracted using the pamela (Horne 1986) routines within figaro (Shortridge et al. 1997). After wavelength calibration using arcs obtained between stellar exposures, the spectra were absolutely flux-calibrated using the standard star BD+28∘ 4211. Subsequent analysis was carried out within dipso (Howarth et al. 1995).
Since the observed emission features were unresolved in our ISIS observations, additional high spectral resolution observations of NaSt1 were kindly obtained for us by Dr M.H. van Kerkwijk at the 10m Keck I telescope, using the high resolution echelle spectrograph (HIRES) and a 20482048 Tek CCD as the detector. Observations at two wavelength settings during good conditions (0′′.7 seeing) provided near complete wavelength coverage between 4350–8750 at a 2.5 pixel spectral resolution of 0.08–0.15Å, as measured from Th-Ar arc spectra. The CCD frames were bias-subtracted, and the echelle orders of NaSt1 and the flux and atmospheric standard Feige 110 were optimally extracted using the software package echomop (Mills & Webb 1994). Subsequent analysis was again performed using the figaro and dipso packages.
Synthetic Johnson filter photometry performed on the WHT and Keck spectra give V=14.47 and 14.67 mag, respectively. Using the narrow-band photometric system derived for WR stars (Smith 1968) and convolving our flux calibrated observations with suitable Gaussian filters, we find =16.91 mag, =15.20 mag and =13.99 mag for our WHT dataset. These compare reasonably well with previous optical narrow band photometry (=16.9 mag, =15.4 mag) provided by Massey & Conti (1983).
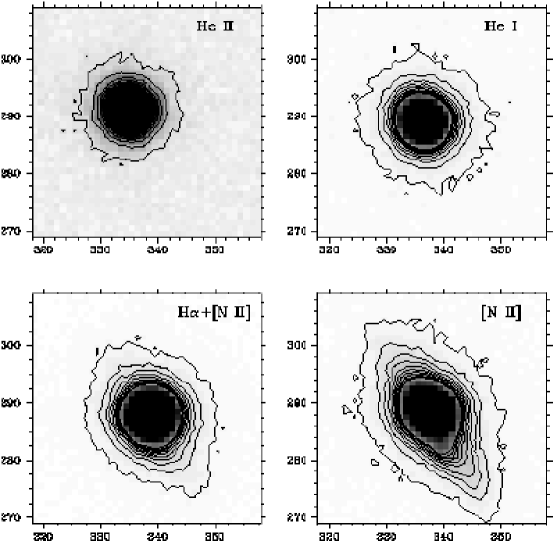
To complement our optical spectroscopy, imaging was carried out with the WHT auxiliary port during August 1996 using the 10241024 EEV CCD detector and several narrow-band filters, covering He ii 4686, He i 5876, H + [N ii] 6583, and [N ii] 6583. The details of the filters and exposure times employed are given in Table 1. The images were de-biassed and flat-fielded prior to analysis. The average seeing measured from the images was with each CCD pixel corresponding to 0.22 arcsec.
2.2 Infrared observations
Our infrared NaSt1 observations were obtained at the 3.8m UKIRT with the cooled grating spectrograph CGS4, the 300mm camera, the 75 l/mm and echelle gratings and a 6258 InSb array in 1994 August covering selected regions in the 1.03–2.21m range. The observations were bias-corrected, flat-fielded, extracted and sky-subtracted using cgs4dr (Daly & Beard 1992). In order to remove atmospheric features, the observations were divided by an appropriate standard star (whose spectral features were artificially removed) observed at around the same time and similar air mass. Our echelle observations covered only He i 2.058m and were obtained at a spectral resolution of /=16 000.
3 Discussion of observations
In this section we discuss our WHT, Keck and UKIRT spectroscopy and imaging of NaSt1. An extremely unusual nebular appearance is revealed, with no clear signature of stellar emission lines, arguing strongly against a WR identification.
3.1 Optical spectroscopy
We present our WHT-ISIS flux calibrated observations of NaSt1 in Fig. 1. The visual spectrum of NaSt1 shows a multitude of strong, narrow, low and high excitation nebular features superimposed on a clear continuum. From this figure it is clear that the nebular spectrum of NaSt1 is unusual. Very strong He i features are observed relative to the Balmer series. In spite of the presence of very strong He ii 4686 emission – indicating high temperatures or densities – [O iii] 5007 is very weak and [N ii] is strong, suggestive of chemical peculiarities (see Sect. 6).
In Fig. 1 we include our WHT-ISIS observations degraded to the resolution (6Å) of the sole previously published optical spectroscopy of NaSt1 by Massey & Conti (1983), obtained in 1982 September. On close inspection we find that the two datasets are essentially identical, indicating that, whatever the true nature of NaSt1, it has remained unchanged over the past decade.
From a spectral comparison with bona-fide cool nitrogen sequence WR stars (specifically the WN9 stars HDE 313846 and BE381), Massey & Conti (1983) proposed a very late WN spectral classification for NaSt1 of WN10 on the basis that N ii 4654–67 emission was stronger than N iii 4634–41, and tentatively identified N i 5616, in spite of very strong He ii 4686 emission. (Smith et al. (1994) and Crowther & Smith (1997) have recently updated the spectral classification of WN9–11 stars, with N i absent).
The emission lines observed in NaSt1 are resolved in our Keck I HIRES data set, providing a potential means to unravelling its true nature. The stellar spectral features proposed by Massey & Conti (1983) as N ii 4654–67 and N i 5616 which resulted in a late WN classification are revealed as nebular [Fe iii] 4658 and [Ca vii] 5619, respectively. Indeed, all optical spectral features appear to be of nebular, rather than stellar, origin. Permitted and forbidden lines cover a wide range in excitation, and include H i, He i-ii, N i-iii, [N ii], [Ne iii-iv], Mg i-ii, Si ii, [S ii-iii], [Ar iii-v], [Ca v-vii], [Fe ii-vii], [Ni ii-iii]).
We present selected line profiles from the Keck dataset in Fig. 2, covering a wide range of morphologies, which we now discuss. A full line list is provided in Table 2.
-
1.
Balmer series: H and H show very similar emission line profiles with a double component structure, comprising a major component with FWHM50 km s-1 at line centre plus a minor component centred at 115 km s-1, which we attribute to He ii since these features have the correct velocity displacement, the appropriate strength and an identical structure to adjacent Pickering series members.
-
2.
He i: The numerous He i emission lines in our observations show a variety of morphologies. Most He i profiles, such as 7281 in Fig. 2 show double Gaussian, asymmetric profiles (FWHM33 km s-1), separated by 32 km s-1, with stronger emission in the red component. Other He i lines such as 4713, 5016 show a broader profile that can be deconvolved into two components, again stronger on the red side (FWHM43 km s-1 separated by 27 km s-1). Exceptions include 5876 (see Fig. 2) which shows a double Gaussian profile with greater blue emission and 6678 which has a single symmetric profile with FWHM=62 km s-1.
-
3.
He ii: The profiles (e.g. , , , 8237 in Fig. 2) are asymmetric, and can readily be deconvolved into two components with FWHM50 km s-1, separated by 50 km s-1 with blue to red strengths of 2:3.
-
4.
Low excitation forbidden lines: Spectral lines from these transitions are fairly common and include [N i] 8680, [N ii] 5755, 6583, [S ii] 6731, [Fe iii] 4658 presented in Fig. 2. These profiles can be reproduced with double Gaussian fits of similar strength, with intrinsic FWHM24 km s-1, and separated by 28–31 km s-1.
-
5.
High excitation forbidden lines: Spectral features due to [Ca v-vii], [Fe v-vii] are observed (see Fig. 2). While the broad shape of these lines can be reproduced by a single Gaussian fit (FWHM140 km s-1), a double peaked structure is observed, with each component separated by 50 km s-1.
-
6.
Permitted metal lines: Examples include N iii 4634–41 and Si ii 6347–71, shown in Fig. 2. These are of similar shape to the He ii profiles, with asymmetric, double peaked profiles (FWHM28–36 km s-1), separated by 36–41 km s-1, showing greater emission in the red component.

In Fig. 3 we present a small portion of our HIRES spectrum in the region of the [O iii] 5007, 4959 lines. These lines, usually amongst the strongest nebular lines in hot Planetary Nebulae (PNe), are extremely weak in NaSt1. Indeed, our line measurements indicate that the feature at 5007 is blended, since it is seven times stronger than 4959 (the theoretical line ratio is 2.9). Although our spectroscopic observations do not extend to the [O ii] doublet at , we have been provided with intermediate dispersion observations of NaSt1 from L.F. Smith extending to 3300. From this data set, negligible emission is observed at [O ii] 3727. The high reddening towards NaSt1 (Sect. 4.1), however, means that no useful limit can be determined for the strength of this feature. Instead, we have searched for the red [O ii] lines at 7320 and 7330 Å in the Keck dataset. The latter occurs in the inter-order gap but the former is detected and has approximately the same strength as the blended [O iii] line. The weakness of the oxygen lines therefore indicates that the oxygen content of NaSt1 is very low. Likewise, we can make inferences about the carbon content since, by comparison with planetary nebulae and the presence of strong He ii in NaSt1, we would expect to see the C iv recombination lines at , 5801–12, but these are absent in our spectra. The C ii line at is also absent, suggesting that NaSt1 is carbon deficient.

In Fig. 4 we present line FWHM (km s-1) versus ionization potential (in eV) for representative ions in our HIRES spectra of NaSt1, revealing a broad correlation, suggesting lines of different excitations are formed within different regions of the nebula, as seen, for example, within symbiotic novae (e.g. V1016 Cyg, Schmid & Schild 1990).

3.2 Infrared spectroscopy
The low resolution 1.0–1.8m UKIRT/CGS4 spectrum of NaSt1 is shown in Figure 5 together with a higher resolution 1.99–2.31m spectrum obtained at the Steward Bok 2.3m/FSPEC by Tamblyn et al. (1996). Once again, numerous nebular emission lines, principally attributable to H i and He i-ii are observed, with weak features tentatively identified as nitrogen and iron (Table 3). While our observations are generally of insufficient quality to resolve individual features, the hydrogen and helium components at 2.165m are resolved (He i 2.162m + He ii 2.1646m + Br) in the FSPEC data set, as are the Balmer-Pickering series in the optical.
In Fig. 6 we present the high resolution He i 2.058m UKIRT echelle profile. These observations reveal a strong, emission feature with wings extending to 300 km s-1. This feature can be reproduced with a double Gaussian fit comprising a narrow central feature with FWHM110 km s-1 plus a second, broad component of similar flux with FWHM360 km s-1. This profile represents the only potential feature that has a stellar origin. Consequently, 300 km s-1 may relate to the underlying outflow wind velocity.
3.3 Optical imaging
We now discuss our narrow-band imaging of NaSt1 obtained at the auxiliary port of the WHT. To date, the only published image of NaSt1 is an H+[N ii] image from Miller & Chu (1993). This image shows no nebular emission associated with the star although the pixel size of means that a nebula close to the central star would have been missed. Williams et al. (1987) find evidence from the IR flux distribution for a dusty circumstellar shell associated with NaSt1.

In Fig. 7 we show the four narrow-band images of NaSt1 with contours superimposed. It is immediately obvious that a nebula is detected in the [N ii] 6583 image. It is elliptical in shape with the major axis at a position angle of . The lengths of the major and minor axes (using the lowest contours shown in Fig. 7) are 8.5 and 5.1 arcsec respectively. The nebula is also seen in the H[N ii] 6565 image. In contrast, there is no hint of any extension in the He ii and He i images at the measured seeing of .
The [N ii] line is also spatially extended in the Keck HIRES spectra which were obtained at a position angle of . Examination of the [N ii] profile shows that the relative strengths of the blue and red components vary as a function of spatial position. At the position of the continuum, they have equal strengths and are separated by 30 km s-1; to the north, the blue component dominates; and to the south, the reverse occurs with the red component much stronger. At all positions, both components are always seen and their velocities are constant with no sign of the two components merging at the edge of the nebula. The dynamics are therefore inconsistent with a simple expanding shell, but suggest a more complex geometry.
Pre-empting the derived distance for NaSt1 in the next section, an average diameter for the [N ii] emitting region of 6.8 arcsec corresponds to a physical size of 0.033 pc (or 6,800 AU) at a distance of 1 kpc, or 0.11 pc (22,400 AU) at a distance of 3.3 kpc. If we assume that the characteristic expansion velocity associated with the outflowing material is 15 km s-1, we derive a dynamical timescale for the [N ii] emitting region of 1,100–3,600 yr.
4 Extinction and distance towards NaSt1
We now use our spectroscopic observations presented above to investigate the interstellar extinction and distance to NaSt1.
4.1 Energy distribution and interstellar extinction
The observed 0.4–15m flux distribution for NaSt1 is presented in Fig. 8. The energy distribution is extremely red, and peaks around the L-band, suggestive of a very high interstellar reddening. We defer a comparison between the observed IR colours for NaSt1 with other emission line objects until Sect. 6.1.
We use two methods to determine the interstellar extinction to NaSt1; applying Case B recombination theory (Storey & Hummer 1995) to the observed H i line strengths, and the strength of observed Diffuse Interstellar Band (DIB) absorption lines.
For the first method, we have assumed an electron temperature =10,000K and electron density =104 cm-3 and used the H, P13 and P16 fluxes relative to H from our Keck/HIRES observations. Higher Balmer series were not used since measurements of these features are restricted to less reliable WHT/ISIS observations. We obtain (H)=3.06, implying EB-V=2.10.1 mag. In Sect. 5, we derive higher values of and but these have a negligible effect on the derived value of EB-V.
NaSt1 lies along the line-of-sight to the Aquila Rift (200100 pc) which Dame & Thaddeus (1985) suggest has a low mean visual extinction of about 2 magnitudes. It appears that the majority of the extinction we observe arises from diffuse material lying behind this cloud, and therefore that the standard mean value of (=/EB-V)=3.1 may be reasonable (i.e. =6.50.3 mag).

Diffuse Interstellar Band (DIB) features are readily visible in our Keck/HIRES spectra of NaSt1 and allow an independent determination (see also Le Bertre & Lequeux 1993). In particular, equivalent widths of certain DIBs (5797, 5849) are known to scale fairly linearly with (Herbig 1995). We have measured equivalent widths for these DIBs and compared them with those quoted by Herbig (1995) along the (standard) line-of-sight to HD 184143. We obtain equivalent widths of 377 and 135 mÅ for 5797 and 5849, implying =2.00 and 2.04 mag, in excellent agreement with our value derived from Case B recombination theory.
The de-reddened flux distribution for NaSt1 is shown in Fig. 8. Clearly, the intrinsic optical flux distribution from NaSt1 is very blue, indicating a very hot ionizing source for the nebula, as illustrated by the 100,000K blackbody flux distribution in the figure. Our optical spectroscopy does not allow us to distinguish between temperatures for the ionizing source in the range 30kK (if =2.0 mag) to 200kK (if EB-V=2.2 mag). The mid-IR energy distribution can be approximated with a warm blackbody of 700K (van der Hucht et al. 1984; Williams et al. 1987), while a further blackbody of 2000K is required to reproduce the intrinsic near-IR flux distribution, The combined effect of our three blackbodies is indicated as a solid line in Fig. 8.
4.2 Distance
We use several techniques to estimate the distance, based on the LSR radial velocity of NaSt1 and interstellar material, and from previously obtained distance-reddening relations along this line-of-sight.
To estimate the systemic LSR radial velocity for the emission lines observed in NaSt1, we have measured the velocities of thirteen emission lines which show red and blue components (see Fig. 2) in the Keck HIRES dataset. We derive and km s-1 for the blue and red components, giving a systemic of km s-1 for NaSt1. The interstellar Na i lines are shown in Fig. 9 and have a strong, broad component centred on km s-1, and extending to km s-1, with a weaker component at km s-1.
The LSR radial velocity as a function of distance for the line-of-sight towards NaSt1 is also shown in Fig. 9, using the Galactic rotation curve of Brand & Blitz (1993) and a Galactocentric distance of 8.5 kpc for the Sun. The velocity of km s-1 derived from the emission lines indicates a distance of 1 kpc for NaSt1. In contrast, the main Na i absorption feature, extending up to km s-1 suggests a distance of 3.3 kpc. The first estimate assumes that NaSt1 is participating in the Galactic rotation and has no peculiar velocity. The second estimate assumes that the Na i absorption originates from diffuse interstellar clouds along the line-of-sight which are co-rotating with the Galaxy. It is possible that some of this absorption arises in the circumstellar shell associated with NaSt1 since the red emission component is at km s-1. On the other hand, there is no blue-shifted emission with velocities as negative as the additional Na i component at 25 km s-1.

Alternatively, Cappellaro et al. (1994) have presented an approximate distance-reddening relation for objects along a narrow line-of-sight common to NaSt1 based on normal stars and PNe. Using their approximate relation our implies a significantly larger distance of 71 kpc. It is possible, however, that the high extinction towards NaSt1 results from dusty circumstellar material rather than interstellar material.
In summary, the high reddening of mag derived from H i line ratios indicates a large distance of kpc but some of this reddening could be local to NaSt1. Conversely, the radial velocities of the emission and interstellar absorption lines indicate smaller distances of 1–3.3 kpc and by inference, that most of the reddening is circumstellar. Dame & Thaddeus (1985) list nine O stars lying behind the Aquila Rift with distances in the range 1–6 kpc and extinctions of =2.4–4.2 mag, considerably less than the value derived for NaSt1. We have a slight preference for the distances based on kinematic arguments and will assume a distance to NaSt1 of 1–3.3 kpc.
This distance range yields an absolute visual magnitude for NaSt1 of =1.9 to 4.5 mag. Assuming a bolometric correction in the range 3 to 7 mag, appropriate for stars with temperatures of 30,000K to 200,000K, the intrinsic luminosity of the hot component lies in the range log ()=3.9 to 6.5. We can also obtain a luminosity from the IRAS mid-IR photometry, which reflects warm re-radiated dust. For a distance of 1 to 3.3 kpc we obtain log ()=2.6 to 3.6 (assuming a 700K blackbody normalized at the observed 12m flux). Clearly, although extremely bright at IR wavelengths, the entire bolometric luminosity of NaSt1 is not re-radiated in the IR.
| Identification | Note | |||||
|---|---|---|---|---|---|---|
| (Å) | Feature | H=100 | H=100 | |||
| 3856.2 | Si ii | 1 | 3856.0 | 1.9 | 9.8 | WHT |
| 3862.8 | Si ii | 1 | 3862.6 | 2.9 | 14.6 | WHT |
| 3869.1 | Ne iii | 3F | 3868.8 | 20.9 | 105.9 | WHT |
| 3888.9 | He i | 3888.6 | 51.0 | 251.5 | WHT | |
| 3967.6 | H i | 3968.5 | 15.4 | 68.8 | WHT | |
| He i | 5 | 3964.7 | WHT | |||
| 4009.3 | He i | 55 | 4009.3 | 2.9 | 12.0 | WHT |
| 4026.6 | He i | 19 | 4026.6 | 9.9 | 40.0 | WHT |
| 4068.9 | S ii | 1F | 4068.9 | 1.3 | 4.9 | WHT |
| 4076.7 | S ii | 1F | 4076.2 | 0.4 | 1.5 | WHT |
| 4097.0 | N iii | 1 | 4097.3 | 7.1 | 25.7 | WHT |
| 4101.7 | H | 4101.7 | 10.3 | 37.0 | WHT | |
| N iii | 1 | 4103.3 | WHT | |||
| 4121.4 | He i | 16 | 4120.8 | 3.0 | 10.5 | WHT |
| 4144.4 | He i | 53 | 4143.8 | 6.5 | 21.9 | WHT |
| 4178.9 | Fe ii | 28 | 4178.9 | 2.7 | 8.6 | WHT,bl? |
| 4199.7 | He ii | 4199.9 | 7.5 | 23.1 | WHT | |
| 4233.3 | Fe ii | 27 | 4233.2 | 2.4 | 7.0 | WHT |
| 4247.7 | 3.0 | 8.5 | WHT | |||
| 4287.7 | Fe ii | 7F | 4287.4 | 2.6 | 6.9 | WHT |
| 4339.9 | H | 4340.8 | 21.4 | 52.3 | WHT | |
| He ii | 4338.7 | |||||
| O iii | 3F | 4363.2 | 0.5 | 1.2 | ||
| 4388.0 | He i | 51 | 4388.1 | 14.1 | 31.8 | |
| 4413.8 | Fe ii | 7F | 4413.8 | 2.0 | 4.3 | |
| 4416.3 | Fe ii | 6F | 4416.3 | 2.1 | 4.5 | |
| 4437.6 | He i | 50 | 4437.5 | 2.8 | 5.8 | |
| 4446.9 | N ii | 4447.0 | 1.2 | 2.4 | ||
| 4471.7 | He i | 14 | 4471.5 | 39.7 | 78.7 | |
| 4481.2 | Mg ii? | 4 | 4481.3 | 4.7 | 9.1 | |
| 4491.4 | Fe ii | 37 | 4491.4 | 2.0 | 3.8 | |
| 4511.0 | Fe ii | 6F | 4509.6 | 3.4 | 6.2 | |
| 4515.3 | Fe ii | 37 | 4515.3 | 2.5 | 4.5 | |
| 4520.1 | Fe ii | 37 | 4520.2 | 3.3 | 5.9 | |
| 4533.6 | Fe ii | 6F | 4533.0 | 2.2 | 3.9 | |
| 4541.6 | He ii | 4541.7 | 14.8 | 25.7 | ||
| 4549.5 | Fe ii | 38 | 4549.5 | 2.9 | 5.0 | |
| 4554.8 | 3.0 | 5.1 | ||||
| 4571.0 | Mg i | 1 | 4571.1 | 2.2 | 3.6 | |
| 4576.4 | Fe ii | 38 | 4576.3 | 1.5 | 2.5 | |
| 4583.8 | Fe ii | 38 | 4583.8 | 5.0 | 8.1 | bl. |
| 4607.0 | Fe iii | 3F | 4607.0 | 5.0 | 7.8 | |
| 4620.6 | Fe ii | 38 | 4620.5 | 1.5 | 2.2 | |
| 4629.3 | Fe ii | 37 | 4629.1 | 5.7 | 5.1 | |
| 4630.6 | 1.8 | 2.7 | ||||
| 4634.2 | N iii | 2 | 4634.1 | 10.2 | 15.1 | |
| 4640.7 | N iii | 2 | 4640.6 | 20.2 | 29.6 | |
| 4658.1 | Fe iii | 3F | 4657.7 | 42.5 | 60.5 | |
| 4666.9 | Fe iii | 3F | 4667.0 | 5.7 | 8.0 | |
| 4685.8 | He ii | 4685.8 | 403.3 | 546.5 | ||
| 4701.6 | Fe iii | 3F | 4701.6 | 18.4 | 24.2 | |
| 4713.4 | He i | 4713.2 | 36.9 | 47.7 | ||
| 4724.1 | Ne iv | 1F | 4724.1 | 3.7 | 4.7 | br. |
| 4731.4 | Fe ii | 43 | 4731.4 | 2.2 | 2.7 | |
| Identification | Note | |||||
|---|---|---|---|---|---|---|
| (Å) | Feature | H=100 | H=100 | |||
| 4733.9 | Fe iii | 3F | 4733.9 | 4.6 | 5.7 | |
| 4739.9 | Ar iv | 1F | 4740.1 | 1.9 | 2.3 | br |
| 4754.8 | Fe iii | 3F | 4754.8 | 7.8 | 9.4 | |
| 4769.5 | Fe iii | 3F | 4769.6 | 6.1 | 7.2 | |
| 4777.7 | Fe iii | 3F | 4777.9 | 2.8 | 3.2 | |
| 4814.5 | Fe ii | 20F | 4814.5 | 1.9 | 2.1 | |
| 4824.1 | 1.2 | 1.3 | ||||
| 4859.4 | He ii | 4859.4 | 34.9 | 34.9 | ||
| 4861.4 | H | 4861.2 | 100.0 | 100.0 | ||
| 4864.1 | 8.6 | 8.6 | bl. | |||
| 4889.6 | Fe ii | 4F | 4889.6 | 2.2 | 2.1 | |
| 4921.9 | He i | 48 | 4921.9 | 66.4 | 59.9 | |
| 4923.8 | Fe ii | 42 | 4923.9 | 4.2 | 3.8 | |
| 4930.6 | Fe iii | 1F | 4931.0 | 10.5 | 9.3 | |
| 4939.1 | Ca vii | 1F | 4940.3 | 13.8 | 12.0 | |
| 4944.4 | Fe vii | 2F | 4942.3 | 10.3 | 9.0 | bl. |
| 4958.9 | O iii | 1F | 4959.3 | 1.2 | 1.0 | |
| 4967.1 | Fe vi | 2F | 4967.1 | 2.9 | 2.4 | br. |
| 4972.4 | Fe vi | 2F | 4972.5 | 3.9 | 3.2 | br. |
| 4987.3 | Fe vii | 2F | 4988.8 | 3.9 | 3.2 | |
| 4993.9 | 2.8 | 2.2 | ||||
| 5001.1 | 65.0 | 51.1 | ||||
| 5007.2 | O iii | 1F | 5006.9 | 8.4 | 6.5 | bl. |
| 5011.3 | 29.4 | 22.7 | ||||
| 5015.8 | He i | 4 | 5015.7 | 182.7 | 140.1 | |
| 5018.4 | Fe ii | 42 | 5018.4 | 6.6 | 5.0 | |
| 5032.6 | Fe iv | -F | 5032.3 | 2.3 | 1.7 | |
| 5041.0 | Si ii | 5 | 5041.3 | 42.9 | 31.5 | |
| 5045.1 | 1.8 | 1.3 | ||||
| 5047.8 | He i | 47 | 5047.7 | 19.5 | 14.1 | |
| 5056.1 | Si ii | 5 | 5056.5 | 24.3 | 17.4 | |
| 5084.7 | Fe iii | 1F | 5084.8 | 5.7 | 3.9 | |
| 5132.6 | 1.8 | 1.1 | ||||
| 5146.1 | Fe vi | 2F | 5145.8 | 4.9 | 3.0 | br. |
| 5158.8 | Fe ii | 19F | 5158.8 | 7.4 | 4.4 | bl. |
| 5169.0 | Fe ii | 42 | 5169.0 | 4.9 | 2.9 | |
| 5176.2 | Fe vi | 2F | 5176.2 | 7.8 | 4.5 | br. |
| 5191.8 | Ar iii | 5191.8 | 0.4 | 0.2 | ||
| 5197.5 | N i | 1F | 5198.0 | 8.4 | 4.7 | |
| N i | 1F | 5200.4 | 0.2 | 0.1 | ||
| 5234.6 | Fe ii | 49 | 5234.6 | 8.1 | 4.3 | |
| 5261.6 | Fe ii | 19F | 5261.6 | 4.3 | 2.2 | |
| 5270.5 | Fe iii | 1F | 5270.3 | 75.0 | 37.2 | |
| 5273.4 | Fe ii | 18F | 5273.4 | 3.5 | 1.7 | |
| 5275.9 | Fe ii | 49 | 5276.0 | 10.0 | 4.9 | bl. |
| 5276.6 | Fe vi | 2F | 5277.8 | bl. | ||
| 5284.1 | Fe ii | 41 | 5284.1 | 4.1 | 2.0 | |
| 5309.1 | Ca v | 1F | 5309.2 | 10.4 | 4.8 | br. |
| 5316.6 | Fe ii | 49 | 5316.6 | 24.2 | 11.1 | |
| 5325.5 | Fe ii | 49 | 5325.6 | 3.0 | 1.3 | |
| 5333.5 | 3.3 | 1.5 | ||||
| 5362.9 | Fe ii | 49 | 5362.9 | 2.9 | 1.2 | |
| 5411.6 | He ii | 5411.6 | 101.7 | 39.7 | ||
| 5425.2 | Fe ii | 49 | 5425.6 | 4.4 | 1.7 | |
| 5432.9 | Fe ii | 18F | 5433.1 | 3.8 | 1.4 | |
| 5460.5 | Ca vi | 2F | 5459.4 | 4.5 | 1.6 | |
| 5527.4 | Fe ii | 17F | 5527.3 | 2.7 | 0.9 | |
| 5534.8 | Fe ii | 55 | 5534.9 | 14.2 | 4.7 | |
| 5552.0 | 2.7 | 0.9 | ||||
| 5586.2 | Ca vi | 2F | 5586.3 | 3.2 | 1.0 | |
| 5618.4 | Ca vii | 1F | 5618.6 | 64.9 | 19.4 | |
| 5666.7 | N ii | 3 | 5666.6 | 18.4 | 5.2 | |
| Identification | Note | |||||
|---|---|---|---|---|---|---|
| (Å) | Feature | H=100 | H=100 | |||
| 5676.1 | N ii | 3 | 5677.0 | 51.4 | 14.3 | |
| 5679.6 | N ii | 3 | 5679.7 | 10.7 | 3.0 | |
| 5686.2 | N ii | 3 | 5686.2 | 34.4 | 9.5 | |
| 5710.8 | N ii | 3 | 5710.8 | 6.2 | 1.7 | |
| 5720.8 | Fe vii | 1F | 5721.1 | 58.5 | 15.5 | WHT |
| 5730.7 | N ii | 3 | 5730.6 | 2.7 | 0.7 | |
| 5747.2 | Fe ii | 34F | 5747.0 | 3.0 | 0.8 | |
| 5754.6 | N ii | 3F | 5754.6 | 452.0 | 114.9 | |
| 5767.5 | 5.0 | 1.2 | ||||
| 5868.4 | 6.6 | 1.5 | ||||
| 5876.1 | He i | 11 | 5875.7 | 2903.0 | 639.9 | |
| 5920.4 | 2.8 | 0.6 | ||||
| 5931.8 | N ii | 28 | 5931.8 | 5.8 | 1.2 | |
| 5941.7 | 5.9 | 1.2 | ||||
| 5953.0 | 4.5 | 0.9 | br. | |||
| 5957.0 | Si ii | 4 | 5957.6 | 1.6 | 0.3 | |
| 5961.8 | 4.2 | 0.8 | ||||
| 5977.0 | 3.5 | 0.7 | ||||
| 5979.0 | Si ii | 4 | 5979.0 | 4.8 | 0.9 | |
| 6037.7 | He ii | 6036.8 | 4.7 | 0.9 | ||
| 6074.3 | He ii | 6074.3 | 6.4 | 1.1 | ||
| 6086.6 | Fe vii | 1F | 6086.9 | 130.5 | 22.6 | |
| Ca v | 1F | 6086.4 | ||||
| 6170.7 | He ii | 6170.7 | 8.1 | 1.3 | ||
| 6182.3 | 10.4 | 1.6 | ||||
| 6233.9 | He ii | 6233.8 | 10.8 | 1.6 | ||
| 6238.3 | Fe ii | 74 | 6238.4 | 12.0 | 1.8 | bl. |
| 6247.5 | Fe ii | 74 | 6247.6 | 9.4 | 1.4 | bl. |
| 6311.3 | S iii | 3F | 6312.0 | 82.0 | 11.1 | |
| 6317.9 | Fe ii | – | 6318.0 | 8.4 | 1.1 | |
| 6347.0 | Si ii | 2 | 6347.5 | 69.5 | 9.1 | |
| 6371.5 | Si ii | 2 | 6371.3 | 89.7 | 11.4 | |
| 6383.9 | Fe ii | – | 6383.5 | 11.0 | 1.4 | |
| 6402.3 | 10.2 | 1.3 | ||||
| 6406.5 | Hei̇i | 6406.5 | 19.7 | 2.4 | ||
| 6416.9 | Fe ii | 74 | 6416.9 | 14.3 | 1.7 | |
| 6432.6 | Fe ii | 40 | 6432.6 | 16.1 | 1.9 | |
| 6435.2 | Ar v | 1F | 6435.1 | 11.3 | 1.3 | |
| 6456.4 | Fe ii | 74 | 6456.4 | 36.6 | 4.3 | |
| 6482.1 | N ii | 6482.0 | 25.0 | 2.8 | ||
| 6506.4 | Fe ii | 6506.3 | 9.1 | 1.0 | ||
| 6516.0 | Fe ii | 6516.0 | 17.4 | 1.9 | ||
| 6527.2 | He ii | 6527.2 | 18.5 | 2.0 | ||
| 6532.6 | 6.4 | 0.7 | ||||
| 6548.1 | N ii | 1F | 6548.1 | 240.6 | 25.6 | WHT |
| 6560.6 | He ii | 6560.2 | 484.0 | 51.2 | ||
| 6562.8 | H | 6562.8 | 2575.0 | 282.0 | ||
| 6577.9 | 8.5 | 0.9 | ||||
| 6583.5 | N ii | 1F | 6583.9 | 700.8 | 71.9 | |
| 6610.5 | N ii | 6610.5 | 8.5 | 0.9 | ||
| 6678.4 | He i | 46 | 6678.1 | 4242.0 | 396.8 | |
| 6683.3 | He ii | 6683.2 | 49.5 | 4.6 | ||
| 6717.0 | S ii | 2F | 6716.5 | 3.6 | 0.32 | bl. |
| 6730.8 | S ii | 2F | 6730.7 | 3.1 | 0.27 | |
| 6891.0 | He ii | 6891.0 | 42.2 | 3.2 | ||
| 7005.5 | Ar v | 1F | 7005.7 | 20.3 | 1.4 | br. |
| 7135.6 | Ar iii | 1F | 7135.8 | 59.2 | 3.6 | |
| 7155.2 | Fe ii | 14F | 7155.2 | 32.3 | 1.9 | |
| 7170.7 | Ar iv | 2F | 7170.4 | 35.2 | 2.1 | br. |
| 7236.8 | Ar iv | 2F | 7237.3 | 29.5 | 1.7 | |
| Identification | Note | |||||
|---|---|---|---|---|---|---|
| (Å) | Feature | H=100 | H=100 | |||
| 7281.7 | He i | 45 | 7281.3 | 2610.0 | 141.3 | |
| 7298.0 | He i | 7298.0 | 12.8 | 0.7 | ||
| 7320.8 | O ii | 2F | 7319.7 | 8.5 | 0.5 | |
| 7377.8 | Ni ii | 2F | 7377.8 | 10.7 | 0.5 | |
| 7452.5 | Fe ii | 14F | 7452.5 | 13.6 | 0.6 | |
| 7462.3 | 14.9 | 0.7 | ||||
| 7468.3 | N i | 3 | 7468.3 | 18.8 | 0.9 | |
| 7593.0 | He ii | 7592.8 | 98.6 | 4.1 | ||
| 7618.3 | N v? | 7618.5 | 48.9 | 2.0 | ||
| 7711.3 | 68.5 | 2.6 | ||||
| 7751.0 | Ar iii | 1F | 7751.1 | 20.0 | 0.7 | |
| 7866.5 | 26.2 | 0.9 | ||||
| 7890.0 | Ni iii | F | 7889.9 | 74.6 | 2.5 | |
| 7896.3 | Mg ii | 8 | 7896.4 | 29.9 | 1.0 | |
| 8045.0 | Cl iv | 1F | 8045.6 | 7.4 | 0.2 | |
| 8084.1 | 27.3 | 0.8 | ||||
| 8116.4 | 26.6 | 0.8 | ||||
| 8237.0 | He ii | 8236.9 | 236.6 | 6.3 | ||
| 8247.7 | 25.6 | 0.7 | ||||
| 8264.9 | 54.2 | 1.4 | ||||
| 8438.0 | H i | 18 | 8438.0 | 12.6 | 0.29 | |
| 8445.6 | O i | 4 | 8446.4 | 213.7 | 5.0 | bl. |
| 8467.1 | H i | 17 | 8467.3 | 14.0 | 0.32 | |
| 8480.7 | Cl iii | 3F | 8480.9 | 14.1 | 0.3 | |
| 8486.2 | 25.3 | 0.6 | ||||
| 8499.7 | 98.7 | 2.2 | bl. | |||
| 8502.2 | H i | 16 | 8502.6 | 21.3 | 0.48 | |
| 8529.0 | 48.5 | 1.1 | ||||
| 8629.2 | 41.9 | 0.9 | ||||
| 8648.4 | 62.3 | 1.3 | ||||
| 8662.2 | 45.0 | 0.9 | ||||
| 8665.0 | H i | 13 | 8665.0 | 41.0 | 0.84 | |
| 8680.2 | N i | 1 | 8680.3 | 169.9 | 3.4 | |
| 8683.5 | N i | 1 | 8683.4 | 91.3 | 1.8 | |
| 8686.2 | N i | 1 | 8686.2 | 61.0 | 1.2 | |
| 8703.0 | N i | 1 | 8703.2 | 35.8 | 0.7 | |
| 8711.5 | N i | 1 | 8711.7 | 43.9 | 0.9 | |
| 8719.0 | N i | 1 | 8718.8 | 33.5 | 0.7 | |
5 Nebular diagnostics and elemental abundances
We can now proceed to obtaining estimates of the nebular physical parameters and abundances. From the usual diagnostic diagram relating H/[S ii] to [S ii] 6717/6731 (see Sabaddin, Minello & Bianchini 1977) we find that NaSt1 falls in the photoionization-dominated region. Therefore the usual nebular diagnostic techniques used for studies of PNe and symbiotic novae are applicable.
5.1 Nebular parameters from observed line fluxes
In Table 2 we provide observed line fluxes () of features visible in our Keck and WHT observations, including de-reddened fluxes (), using the interstellar extinction obtained in Sect. 4. (Table 3 contains observed and de-reddened IR line fluxes from our UKIRT observations.) Nebular line identifications have been largely drawn from the lists of Kaler et al. (1976), Keyes, Aller & Feibelman (1990), Baluteau et al. (1995), and H.-M. Schmid (priv. comm).
Despite the rich emission-line spectrum of NaSt1, many of the usual optical nebular diagnostics are unavailable (e.g. [O iii]). Since we do not possess ultraviolet (nor are we likely to, given its high reddening!) or far-red spectroscopy, we are limited to a small number of available diagnostics. A diagnostic diagram for these line ratios that are sensitive to and is presented in Fig. 10. The curves were generated using the ratio program, written by I.D. Howarth and S. Adams, which solves the equations of statistical equilibrium allowing a determination of as a function of for each ratio.
From comparison with studies of symbiotic novae that exhibit a range of physical conditions (e.g. Schmid & Schild 1990), we might expect lines from ions with the highest ionization potentials (IP) such as [Fe vi-vii] to sample the highest electron densities, while lines with low ionization potentials (e.g. [S ii]) sample lower density regions. From Fig. 10, we see that this may be the case for NaSt1 since the obtained from [S ii] is a factor of ten lower than that obtained from other diagnostic line ratios. We note, however, that [S ii] 4068 is unresolved in our ISIS dataset, and thus the solution from this ratio should be given a lower weight, since all the other line ratios are from the HIRES dataset. Indeed, the solution for [N ii] is consistent with the high ionization potential ions of [Fe vi-vii]. The interception point of these diagnostics is shown in the figure (filled circle) at =3.106cm-3 and 13 000K. The – intersection for the [Ar iv] diagnostic ratio (IP60 eV) with the iron diagnostic ratios is at 4.106cm-3–20,000K for [Fe vi] (IP99 eV) and 3.107cm-3–7,500K for [Fe vii] (IP125 eV).
| Identification | |||||
|---|---|---|---|---|---|
| (m) | Feature | H=100 | H=100 | ||
| 1.0309 | He i | 3p-6d | 1.0311 | 8.7 | 0.08 |
| 1.0401 | Ni ii | 1.0400 | 2.8 | 0.03 | |
| 1.0500 | N i | 1.050 | 4.3 | 0.04 | |
| 1.0831 | He i | 2s-2p | 1.0830 | 2780.0 | 21.80 |
| 1.0914 | Pa | 3-6 | 1.0938 | 12.9 | 0.10 |
| 1.0936 | He ii | 6-12 | 1.0934 | 12.0 | 0.09 |
| 1.1011 | He i | 3s-5p | 1.1013 | 2.6 | 0.02 |
| 1.1045 | He i | 3p-6d | 1.1045 | 2.7 | 0.02 |
| 1.1125 | Fe ii | 1.113 | 2.7 | 0.02 | |
| 1.1292 | Fe vi | 1.13 | 2.2 | 0.02 | |
| 1.2469 | N i | 1.2469 | 2.2 | 0.01 | |
| 1.2527 | He i | 3s-4p | 1.2526 | 43.9 | 0.21 |
| 1.2792 | He i | 3d-5f | 1.2785 | 52.6 | 0.24 |
| 1.2823 | Pa | 3-5 | 1.2818 | 34.4 | 0.15 |
| 1.2979 | He i | 3d-5p | 1.2985 | 14.9 | 0.06 |
| 1.6400 | H i | 12-4 | 1.6412 | 7.6 | 0.02 |
| 1.6796 | H i | 11-4 | 1.6811 | 5.7 | 0.01 |
| 1.7008 | He i | 3p-4d | 1.7002 | 101.5 | 0.24 |
| 1.7351 | H i | 10-4 | 1.7367 | 10.0 | 0.02 |
| 2.0594 | He i | 2s-2p | 2.0581 | 1044.0 | 1.82 |
| 2.1132 | He i | 3p-4s | 2.1120 | 34.7 | 0.06 |
| 2.1642 | Br | 4-7 | 2.1655 | 20.3 | 0.03 |
| 2.1889 | He ii | 7-10 | 2.1889 | 2.3 | 0.01 |
5.2 Nebular abundances

We now utilise our derived nebular parameters to obtain estimates of elemental abundances, and consider first the abundances of the collisionally-excited species. Ionic abundances were obtained by solving the equations of statistical equilibrium using the equib program, also written by S. Adams and I.D. Howarth, and are given in Table 4. Total element abundances were derived using the ionization correction factor (ICF) scheme of Kingsburgh & Barlow (1994) and these are also listed in Table 4.
| Element | ICF(X) | |||||
|---|---|---|---|---|---|---|
| N | 256.00 | – | – | – | 2.90 | 743.00 |
| (6584) | ||||||
| O | 1.25 | 2.38 | – | – | 1.00 | 3.63 |
| (7320) | (4959) | |||||
| Ne | – | 51.00 | – | – | 1.52 | 77.80 |
| (3869) | ||||||
| S | 2.53 | 5.34 | – | – | 1.12 | 8.80 |
| (6731) | (6312) | |||||
| Ar | – | 0.28 | 1.33 | 0.15 | 1.52 | 2.69 |
| (7135) | (4740) | (7005) |
Turning to the helium abundance, optical He i-ii transitions are produced by radiative recombination, with additional contributions to He i line strengths from collisional processes. Helium ionic abundances were derived relative to H+ using Case B recombination theory. For this we utilised interpolated effective recombination coefficients from Osterbrock (1989) for H i and He ii, and He i coefficients from Smits (1996). He i line strengths have been corrected for the effect of collisional population of their upper states (Kingdon & Ferland 1995). These collisional factors (C/R) are shown in Table 5 for =3.106cm-3 and =13 000 K together with the derived helium ionic abundance ratios. It is clear that there is a large scatter in the He+/H+ ratios which must result from optical depth effects. Indeed, the two lowest-lying singlets at and show the highest ionic abundances. We cannot therefore derive a reliable He+/H+ ratio using Case B recombination theory. The He2+/H+ ratio is, however, better determined since the He ii 4686 and 5412 transitions are in the correct Case B ratios and yield a mean He2+/H+ ratio of 0.64. Furthermore, with this abundance, the predicted strengths of He ii 4860 and 6683 are 28.0 and 3.8 relative to H, in agreement with the measured de-reddened values of 34.9 and 4.6.
In summary, while we cannot determine a reliable He+/H+ abundance because the lines are optically thick, we can determine a lower limit to the He/H abundance by using the He2+/H+ ratio of 0.64. In reality, we expect the total He/H abundance to be at least twice this, given the strength of the He i lines and the expectation that He+ is the dominant ionization stage of He. Even with this lower limit, it is apparent that NaSt1 is extremely helium-rich.
| Line | C/R | |||
|---|---|---|---|---|
| He i 3889 | 251.5 | 0.51 | 2.04 | – |
| He i 4387 | 31.8 | 0.09 | 6.70 | – |
| He i 4471 | 78.7 | 0.22 | 1.83 | – |
| He i 4922 | 59.9 | 0.11 | 5.78 | – |
| He i 5876 | 639.9 | 0.44 | 4.77 | – |
| He i 6678 | 396.8 | 0.17 | 12.85 | – |
| He i 7281 | 141.3 | 0.83 | 14.46 | – |
| He ii 4686 | 546.5 | – | – | 0.67 |
| He ii 5412 | 39.7 | – | – | 0.61 |
In Table 6 we present a summary of the abundances derived for NaSt1 and a comparison with other objects. First, we find that the abundances of Ne, Ar and S are very similar to the average H ii region values (Shaver et al. 1983). This excellent agreement suggests that the use of single representative and values has produced reliable abundances. The N/O ratio for NaSt1 is very different to that expected for H ii regions because N is enhanced by a factor of 20 while O is depleted by a factor of 140. Such extreme values indicate heavily CNO-processed material. Indeed, the total H ii CNO abundance of is comparable to the combined NO abundance of for NaSt1 suggesting that very nearly all the carbon and oxygen have been processed to nitrogen. This is in accord with the null detection of carbon emission lines in NaSt1 (Sect. 3.1).
The only object known to us which shows such extreme CNO-processing is the LBV Car. In Table 6, we list the abundances from the recent study of Dufour et al. (1997). The spectacular bipolar nebula associated with Car was ejected in 1840 during a giant eruption (Davidson & Humphreys 1997). The abundances show that the ejected outer stellar layers are composed of CNO-equilibrium products. Other LBV nebulae (e.g. AG Car, R127, S119) have much smaller nitrogen enrichments of 4–11, and little, if any, oxygen depletion, indicative of CN-processing only (Smith et al. 1997, 1998). These abundance differences have led Lamers et al. (1998) to propose that the LBV-like star whose spectrum now dominates the nucleus was not the star that ejected the nebula because the appearance of the stellar spectrum is indicative of mildly-enhanced CN products. They instead suggest that the eruptor was more evolved (possibly WR-like) and thus more massive than the LBV Car.
The abundances we determine for NaSt1 are also very different to those measured for symbiotic stars. Nussbaumer et al. (1988) and Schmid & Schild (1990) find CNO abundances similar to those observed in red giants with only N enhanced from CN-processing. The abundances we determine are also not in agreement with those measured for novae which show enriched C, N and O and sometimes Ne (Livio & Truran 1994).
| Abundance | NaSt1 | H ii | Car |
|---|---|---|---|
| He/H | 0.10 | 0.18 | |
| N/O | 200 | 0.07 | |
| 12+log(O/H) | 6.56 | 8.70 | |
| 12+log(N/H) | 8.87 | 7.57 | 9.04 |
| 12+log(Ne/H) | 7.89 | 7.90 | 7.98 |
| 12+log(Ar/H) | 6.43 | 6.42 | |
| 12+log(S/H) | 6.94 | 7.06 |

6 Discussion
In this final section, we discuss the information that we have obtained for NaSt1 with the aim of identifying its true nature.
6.1 Comparison of NaSt1 with other peculiar emission line objects
First, we will compare our observations of NaSt1 with known WR, Ofpe/WN9, LBV and B[e] stars, to which it has previously been compared, and symbiotic novae, to which it shows certain similarities.
6.1.1 Wolf-Rayet and Ofpe/WN9 stars
A Wolf-Rayet (WN10) classification for NaSt1 was suggested by Nassau & Stephenson (1963) and supported by Massey & Conti (1983), while van der Hucht et al. (1989) proposed an Ofpe/WN9 classification. WR stars represent the final state in the evolution of very massive stars prior to the supernova explosion. Their optical spectrum is characterised by broad, pure emission (and P Cygni) profiles of highly excited species resulting from a fast, extremely dense stellar wind. Ofpe/WN9 stars, reclassified as WN9–11 stars by Smith et al. (1994) and Crowther, Hillier & Smith (1995a), are intimately related to both classical WR stars and LBVs.
In Fig. 11, we compare our rectified WHT-ISIS spectrum of NaSt1 with the LMC star HDE 269582 (WN10, previously Ofpe/WN9; Crowther & Smith 1997). This confirms the quite different appearance of NaSt1, even at intermediate spectral resolution. Stellar He i–ii, H i and N iii features are observed in the WN10 star, including the P Cygni He i 5016 profile, providing evidence for a dense stellar wind outflow. The only nebular lines observed in WR stars are those weak features originating in low-excitation, ejecta-type circumstellar nebulae (e.g. Nota et al. 1996).
6.1.2 B[e] stars
van der Hucht et al. (1989) suggested a possible B[e] supergiant nature for NaSt1 – such luminous, massive objects appear to have a equatorial excretion disk plus a polar OB-type stellar wind. In the optical, their spectra are characterised by a plethora of low-excitation emission lines including the Balmer series plus narrow permitted and forbidden lines of singly ionized ions (e.g. Fe ii), as shown in Fig. 11 for the very luminous LMC B[e] star Hen S22. The presence of He ii 4686 emission in NaSt1 led van der Hucht et al. (1989, 1997) to tentatively suggest that it may be a high temperature counterpart of B[e] stars and hence they proposed a new O[e] classification.
In common with B[e] stars, NaSt1 shows significant mid-IR dust excess and [Fe ii] lines in its optical spectrum. However, NaSt1 additionally displays high excitation, permitted (He ii 4686) and forbidden ([Fe vii] 6087) emission lines and does not show the broad, stellar Balmer lines (compare H profiles in Fig. 11).

6.1.3 Symbiotic novae
The spectral appearance of NaSt1 shares some characteristics with symbiotic novae. These systems consist of a red giant, the ionized nebula and a hot ionizing source, with the red star generally directly observable in the near-infrared. Fig. 11 presents a comparison with the D-type (‘dusty’) symbiotic nova V1016 Cyg, which Schmid & Schild (1990) found to have an electron density of 106cm-3, comparable to NaSt1.
V1016 Cyg and NaSt1 show a strong nebular spectrum, including He ii 4686, H, [N ii], N iii, plus low and high-excitation forbidden Fe emission. Both systems show IR dust emission and a correlation between density and ionization potential (Schmid & Schild 1990). However, significant differences are also found: (i) there is no spectroscopic evidence for a red giant in NaSt1 at IR wavelengths; (ii) the He i-ii emission spectrum of NaSt1 is dramatically stronger; (iii) the characteristic symbiotic O vi Raman scattered lines are absent; (iv) [O iii] 5007 emission is extremely strong in V1016 Cyg, and indeed all dusty symbiotics, which is very weak in NaSt1. Therefore, while NaSt1 shows some similarities with dusty symbiotic novae, its nebular line strengths are anomalous, and its overall properties are distinct.
6.1.4 Carinae
From Sect. 5.2, the abundance pattern of NaSt1 most closely resembles Car. Consequently we include a spectroscopic comparison between NaSt1 and Car in Fig. 11. Car shows narrow emission lines of H i and He i with very broad wings, and He ii 4686 is absent. Highly ionized forbidden nebular lines are not observed in Car. Therefore, although its appearance is also unusual, Car bears little spectroscopic resemblance to NaSt1.
6.2 What is the nature of NaSt1?
From the objects discussed in the previous subsection, NaSt1 most closely resembles symbiotic novae from optical spectroscopy and Car from nebular abundances. We believe we can rule out a symbiotic nature on the basis of its He-rich, O-deficient chemistry and the spectroscopic absence of a red-giant component. Specifically, the CNO-cycle products in the ejected nebula are unique to a massive post-main sequence star. We also note that NaSt1 does not appear to be a strong X-ray emitter. Pollock (1987) suggested that NaSt1 was a possible X-ray source from Einstein data. NaSt1, however, lies fairly close (20′) to the well-known supernova remnant Kes 79 (G33.6+0.1). Higher quality ROSAT PSPC observations revealed that the majority of the X-ray emission near NaSt1 is associated with Kes 79 (Pollock, priv. comm.) and negligible emission is observed from NaSt1 itself.
The unusual nature of NaSt1 is further illustrated in Fig. 12 which compares its two–colour IR index (JH and HK) with other (potentially related) objects from our Galaxy (open symbols) and the LMC (filled-in). Included are ‘normal’ stars, B[e] stars, supergiants, WN6–11 stars, LBVs, ‘dusty’ late WC (WCL) stars, and D-type symbiotic novae. We also show the location of NaSt1 before and after correction for the high interstellar extinction. We find the IR characteristics of NaSt1 are extremely unusual. Most other dusty luminous objects, including B[e], WCL and symbiotics, show quite different IR characteristics. The only object known to possess similar IR properties, after correction for the interstellar reddening towards NaSt1, is Car.
6.3 A massive, evolved star cloaked by a dense ejecta nebula
Despite the absence of a stellar signature in NaSt1, our nebular analysis suggests that it contains a hot, luminous, evolved star, hidden from direct view by the dense nebular envelope. The composition of the nebula indicates that the star ejected its outer layers when CNO-equilibrium products were present on the surface. Comparison with the lower limit on the He/H ratio we derive of 0.64 and the surface He/H ratios derived for WR stars (Crowther et al. 1995a, Crowther & Smith 1997) suggests that the central star must have been a WN star at the time of eruption rather than an LBV-type star.
An early WN (WNE) star identification agrees with the high temperature we find for the ionizing source. These stars are highly evolved objects, with stellar temperatures greatly in excess of 30,000 K and hydrogen-deficient, CNO-processed stellar winds. Indeed, our estimate of the stellar luminosity lies in the range occupied by early WN stars – log ()=5.1–6.1 (Crowther, Smith & Hillier 1995b; Hamann & Koesterke 1998). Another possibility is that the remnant star would now have a more advanced chemical composition than a WN star if most of the stellar envelope was lost in the ejection, namely a WC-type star, also in accord with the temperature and luminosity we derive for the ionizing source.
Early-type WR stars, however, have very dense stellar winds, so how would the characteristic broad, stellar features not be directly observed? Perhaps its stellar wind has not yet pierced the dense ejected nebula. The dynamical age obtained from the nebular analysis is of the order of a few thousand years. This would imply a very recent ejection of a large amount of material, as evidenced from the very high characteristic electron density obtained of cm-3. The only spectral feature which shows any possible type of stellar wind outflow is the He i 20581 profile which has wings extending to 300 km s-1, and closely resembles the He i 1.0830m profile of the massive young stellar object (YSO) Sh 2-106IR, with a comparable outflow velocity (Drew, Bunn & Hoare 1993 and J. Drew, priv. comm.). This velocity is, however, much lower than early WR stars which have winds of 2000–3000 km s-1. This velocity is more characteristic of an LBV during its hot phase (e.g. AG Car; Smith, et al. 1994). Theoretically, we might reconcile a high stellar temperature and low wind velocity with a massive star that is extremely close to its Eddington limit. Indeed, low velocity, aspherical outflows are anticipated for stars close to the related ‘ limit’ which includes the effect of rotation (see Langer 1997).
The only LBV known which has an ejected nebula composed of heavily processed CNO material is Car. As discussed in Sect. 5.2, the advanced evolutionary state of this nebula has led Lamers et al. (1998) to propose that the eruptor was not the LBV but an unseen more evolved star. The IR two–colour index of NaSt1 in Fig. 12 shows strong similarities with Carinae, indicating comparable nebular dust conditions. It is possible that NaSt1 is a counterpart to Carinae with an unseen massive evolved central star that underwent a major instability and ejected its outer layers a few thousand years ago. Differences in the spectral appearances of NaSt1 and Car are probably attributable to geometry, age, and the hotter ionizing source in NaSt1 ( Car is cooler than 30kK from the absence of He ii 4686 emission). Unfortunately, we are unable to comment on details of the precise geometry of NaSt1 since we do not possess deep, high spatial resolution optical/IR imaging.
Whatever the true nature of NaSt1, its properties are extremely unusual. Is there any evidence for objects with similar characteristics? van der Hucht et al. (1984) and Williams et al. (1987) have discussed similarities between NaSt1 and LS4005 (WR85a). LS4005 also shows narrow ( km s-1) emission lines of N ii-iii, Fe ii-iii (both allowed and forbidden), with strong He i-ii features, and no absorption features present, and photometric variability (van der Hucht et al. 1989). LS4005 would certainly represent an excellent target for future high resolution spectroscopy and imaging.
6.4 Summary and future work
We have presented optical and IR spectroscopy, and imaging of NaSt1 which have revealed a heavily CNO-processed nebula. NaSt1 serves as a useful reminder that great care should be taken when selecting IR sources to be classification standards. While many authors have commented that NaSt1 bears little resemblance to other late-WN type stars at IR wavelengths, it has nevertheless remained as a classification standard.
We interpret the spectrum of NaSt1 as arising in a dense nebula, ejected by an evolved massive star. The H-deficient, CNO-processed nebula suggests that an unseen early WN or WC star provides the ionizing flux. The only object which shares some of the peculiar characteristics of NaSt1 is Carinae. NaSt1 appears to be a remarkable object, and hints at new insights into massive star evolution.
Acknowledgments
We would like to thank Mike Barlow, Steve Fossey, Jay Gallagher, Norbert Langer, Mario Livio, Xiao Wei Lui, Andy Pollock and Hans-Martin Schmid for many fruitful discussions. We also wish to thank Bruce Bohannan, You-Hua Chu, Hans-Martin Schmid, Lindsey Smith and Peter Tamblyn for generously forwarding additional observations. PAC acknowledges financial support from PPARC and the Royal Society.
We are especially grateful to Marten van Kerkwijk for obtaining the Keck HIRES observations for us, and the staff of the now defunct Royal Greenwich Observatory for obtaining service spectroscopy and imaging. The William Herschel Telescope is operated on the Island of La Palma by the Isaac Newton Group in the Spanish Observatorio del Roque de los Muchachos of the Instituto de Astrofisica de Canarias. The W.M. Keck Telescope is operated by Caltech and the University of California on Mauna Kea, Hawaii, while the U.K. Infrared Telescope is operated by the Joint Astronomy Centre on behalf of the Particle Physics and Astronomy Research Council also on Mauna Kea, Hawaii.
References
- [1] Baluteau J.-P., Zavagno A., Morisset C., Péquignot D., 1995, A&A 303, 175
- [2] Blum R.D., DePoy D.L., Sellgren K., 1995, ApJ 441, 603
- [3] Brand J., Blitz, L., 1993, A&A, 275, 67
- [4] Cappellaro E., Benetti S., Sabaddin F., Salvadori L., Torrato M., Zanin C., 1994, MNRAS, 267, 871
- [5] Crowther P.A., Smith L.J., 1997, A&A 320, 500
- [6] Crowther P.A., Hillier D.J., Smith L.J., 1995a, A&A 293, 172
- [7] Crowther P.A., Smith L.J., Hillier D.J., 1995b, A&A 302, 457
- [8] Daly P.N., Beard S.M., 1992, Starlink User Note 27 (Rutherford Appleton Laboratory)
- [9] Dame T.M., Thaddeus P., 1985, ApJ 297, 751
- [10] Davidson K., Humphreys R.M., 1997, ARAA, 35, 1
- [11] Drew J.E., Bunn J.C., Hoare M.G., 1993, MNRAS 265, 12
- [12] Dufour, R.J., Glover, T.W., Hester, J.J., Currie, D.G., van Orsow, D., Walter, D.K., 1997, in Luminous Blue Variables: Massive Stars in Transition, ed. A. Nota & H.J.G.L.M. Lamers (ASP Conf. Ser.), 120, p. 255
- [13] Figer D.F., McLean I.S., Najarro F., 1997, ApJ 486, 420
- [14] Gummersbach C.A., Zickgraf F.-J., Wolf B., 1995, A&A 302, 409
- [15] Hamann W.-R., Koesterke L., 1998, A&A, 333, 251
- [16] Henize K.G., 1967, ApJS 14, 125
- [17] Henize K.G., 1976, ApJS 30, 491
- [18] Herbig G.H., 1995, ARA&A 33, 19
- [19] Horne K., 1986, PASP 98, 609
- [20] Howarth I.D., Murray J., Mills D., Berry D.S., 1995, Starlink User Note, 50.16 (Rutherford Appleton Laboratory)
- [21] van der Hucht K.A., Conti P.S., Lundström I., Stenholm B., 1981, Space Sci. Rev. 28, 227
- [22] van der Hucht K.A., Williams P.M., Thé P.S., 1984, in: Observational Tests of the Stellar Evolution Theory, IAU Symp. 105, A. Maeder & A. Renzini (eds.), Kluwer p. 273
- [23] van der Hucht K.A., Williams P.M., van Genderen A.M., Mulder P., Zealey W.J., 1989, in: Physics of Luminous Blue Variables, Davidson, K., Moffat, A.F.J., Lamers, H.J.G.L.M., (eds)., Kluwer, Dordrecht, p. 301
- [24] van der Hucht K.A., Williams P.M., Moris P.M., van Genderen A.M., 1997, in: Luminous Blue Variables: Massive Stars in Transition, Nota, A., Lamers H.J.G.L.M. (eds)., ASP Conf. Series 120, p.211
- [25] Kaler J.B., Aller L.H., Epps, H.W., Czyzak S.J., 1976, ApJS 31, 163
- [26] Keyes C.D., Aller L.H., Feibelman W.A., 1990, PASP 102, 59
- [27] Kingdon J., Ferland G.J., 1995, ApJ 442, 714
- [28] Kingsburgh R.L., Barlow M.J,, 1994, MNRAS 271, 257
- [29] Lamers H.J.G.L.M., Livio M., Panagia N, Walborn N.A., 1998, ApJ, 505, L131
- [30] Langer N., 1997, in Nota A., Lamers, H.J.G.L.M. eds, Luminous Blue Variables, Massive Stars in Transition, ASP Conf. Series, Vol 120, p. 83
- [31] Le Bertre T., Lequeux J., 1993, A&A 274, 909
- [32] Livio M., Truran J.W., 1994, ApJ, 425, 797
- [33] Massey P., Conti P.S., 1983, PASP 95, 440
- [34] McGregor P.J., Hillier D.J, Hyland A.R., 1988, ApJ, 334, 639
- [35] Miller G.J., Chu Y.-H., 1993, ApJS 85, 137
- [36] Mills D., Webb J., 1994, Rutherford Appleton Laboratory, SUN 152.1
- [37] Morris P.W., Eenens P.R.J., Hanson M.M., Conti P.S., Blum R.D., 1996, ApJ, 470, 597
- [38] Munari U., Iudin B.F., Taranova O.G., Massone G., Marang F., Roberts G., Winkler H., Whitelock P.A., 1992, A&AS 93, 383
- [39] Nassau J.J., Stephenson C.B., 1963, Luminous Stars in the Northern Milky Way, IV, Hamburg-Bergedorf
- [40] Nussbaumer H., Schild H., Schmid H.-M., Vogel M., 1988, A&A, 198, 179
- [41] Nota A., Pasquali A., Drissen L., Leitherer C., Robert C., Moffat A.F.J., Schmutz W., 1996, ApJS 102, 383
- [42] Pollock A.M.T., 1987, ApJ 320, 283
- [43] Osterbrock D.E., 1989, Astrophysics of Gaseous Nebulae & Active Galactic Nuclei, University Science Books
- [44] Sabaddin F., Minello S., Bianchini A., 1977, A&A 60, 147
- [45] Schmid, H.-M., Schild H., 1990, MNRAS 246. 84
- [46] Shaver P.A., McGee R.X., Newton L.M., Danks A.C., Pottasch S.R., 1983, MNRAS, 204, 53
- [47] Shortridge, K., Meyerdierks, H., Currie, M., Clayton, M., 1997, Starlink User Note 86.13, Rutherford Appleton Laboratory
- [48] Shylaja B.S., Anandarao B.G., 1993, Astro. Space Sci. 205, 283
- [49] Smith L.F., 1968, MNRAS 140, 409
- [50] Smith L.J., Crowther P.A., Prinja, R.K., 1994, A&A, 281, 833
- [51] Smith L.J., Stroud M.P., Esteban C., Vílchez, J.M., 1997, MNRAS 290, 265
- [52] Smith L.J., Nota A., Pasquali A., Leitherer C., Clampin M., Crowther P., 1998, ApJ, 503, 278
- [53] Smits D.P., 1996, MNRAS 278, 683
- [54] Storey P.J., Hummer D.G., 1995, MNRAS 272, 41
- [55] Tamblyn P., Rieke G.H., Hanson M.M., Close L.M., McCarthy D.W. Jr, Rieke M.J., 1996, ApJ 456 206
- [56] Williams P.M., van der Hucht K.A., Thé P.S., 1987, A&A 182, 91