The discovery of a gas-rich bar in UGC 2855:
A galaxy in a pre-starburst phase?
Abstract
We present the first interferometric CO observations of the barred late-type galaxy UGC 2855 and its companion UGC 2866. UGC 2855 is shown to belong to the rare class of galaxies with a long ( kpc) continuous molecular bar. The velocity field along the bar is dominated by solid-body rotation and shows few perturbations. This, together with an almost constant and low 12CO/13CO line intensity ratio along the bar and in the center as well as only weak H emission, indicate that the gas in the bar is not subjected to strong shocks, but surprisingly quiescent. In the central , a high velocity feature consisting of a number of Giant Molecular Associations, is identified. We discuss possible scenarios of the nature of this structure in connection with the question of the presence of an Inner Lindblad Resonance (ILR) in the bar. We suggest that the bar of UGC 2855 is a young object, possibly has no ILR, and that the mass concentration toward the center of the galaxy is just beginning. In contrast, the companion UGC 2866 experiences a strong starburst. We compare the properties of the gas in the bar of UGC 2855 to those we find in NGC 7479. Despite superficial parallels, the two bars are very dissimilar objects in terms of 12CO/13CO line ratio, velocity field and H activity. NGC 7479 exhibits starburst characteristics, while we argue that UGC 2855 is in a pre-burst stage.
Key Words.:
Galaxies: evolution - galaxies: individual: UGC 2855, UGC 2866, - galaxies: ISM - galaxies: starburst - radio lines: galaxies1 Introduction
Barred galaxies may be the rule rather than the exception: It seems possible that as many as two thirds of all galaxies have bars (e.g. Noguchi 1996). However, most of these stellar bars are almost devoid of molecular gas. Long, continuous (i.e. non-nuclear) gas-rich bars that are roughly aligned with the stellar bar seem to be rare phenomena (e.g. Friedli 1998). Most prominent among the few known examples are the bars of NGC 7479 (total length kpc, Sempere et al. 1995b, Quillen et al. 1995, Aalto et al. 1998), NGC 1530 (total length more than 20 kpc, Downes et al. 1996) and NGC 2903 (total length kpc, Jackson et al. 1991). Centrally concentrated distributions of molecular gas are far more common in barred galaxies; a great variety of different morphologies can be found, ranging from circumnuclear rings and ‘twin peak’ distributions to central peaks (e.g. Kenney et al. 1992, Kenney 1996).
| Name | R.A. (1950.0)a) | Dec (1950.0)a) | Type | Size (blue) | Inclinationb) | ||
|---|---|---|---|---|---|---|---|
| UGC 2855 | SBcc) | 135c) | 46 22d) | L⊙e) | |||
| UGC 2866 | Early S?/H IIf) | 155d) | 11 09d) | L⊙g) |
a): Radio continuum peak position (Condon et al. (1996)
b): calculated from the axes ratio
c): from the RC3 catalogue (de Vaucouleurs et al. 1991)
d): from the UGC catalogue (Nilson 1973)
e): from Condon et al. (1996)
f): from Cohen & Volk 1989
g): from Zenner & Lenzen 1993
While the necessity of bars in general in triggering nuclear activity or enhanced star formation, up to starbursts, is somewhat controversial (Hawarden et al. 1996, Ho et al. 1997), they definitely provide a mechanism of funnelling gas from the outer parts of a galaxy to its central region (Athanassoula 1992). As a result of tidal strain, shocks and cloud-cloud collisions that should occur in the non-axisymmetric potential of a bar, gaseous bars also are a laboratory to study diffuse and possibly unbound gas (e.g. Das & Jog 1995). This is a type of interstellar medium (ISM) likely to be important in the bulge and central regions of many galaxies including the Milky Way (Dahmen et al. 1998), the properties of which are largely unexplored.
Since the triggering of bars is thought to be due to galaxy interactions in many, though not all, cases, good candidates for gaseous, ‘active’ bars are galaxies in the early stages of interaction, when the gas flow along the bar has just started. We therefore launched a project in which we search distant pairs of galaxies known to contain molecular gas and a stellar bar for gas along the bar.
In this paper, we report the discovery of one of the longest continuous molecular bars known, extending over kpc, in the galaxy UGC 2855. UGC 2855 and its companion UGC 2866, at a projected distance of 10′, have never been studied individually but only as parts of surveys (in molecular gas by Sofue et al. 1997, Elfhag et al. 1996, Aalto et al. 1995, Young et al. 1995). Both of them are, however, FIR-bright IRAS galaxies containing a large amount of molecular gas (Aalto et al. 1995). We sum up their few known properties in Table 1. Following Condon et al. (1996), a distance of 20 Mpc to both galaxies is adopted throughout this paper. Thus, an angular size of corresponds to 480 pc on a linear scale, and UGC 2855 and UGC 2866 have a (projected) distance to each other of kpc. Sofue et al. (1997), who included UGC 2855 in their sample of galaxies for which they obtained rotation curves from CO single dish observations, derive a distance of 28.77 Mpc from the Tully-Fisher relation. If this distance is correct, the length of the bar in UGC 2855 rises to 10 kpc.
2 Observations
2.1 Interferometric 12CO observations
Interferometric 12CO observations were obtained at the Owens Valley Radio Observatory (OVRO) millimeter array. The six 10.4 m telescopes are equipped with SIS receivers providing system temperatures of typically K (single sideband). Details of the observations are given in Table 2. With natural weighting, we obtained a roughly circular beam of size (PA 46∘ and sensitivity to extended structure up to 17′′. The quasar 2345–167 was observed as a phase and amplitude calibrator every minutes. Passband calibration was done using stronger sources, usually 0528+134 or 3C 454.4. These sources, calibrated against the planets Neptune and Uranus, were also taken for flux calibration. The tracks were calibrated using software developed for the OVRO array. After calibration, the data were inspected for quality, and low-coherence data points were edited out on a baseline-to-baseline basis.
| Source and Line | Date | Field Center | -coverage | Number of Fields | Primary Beam | Config.a) |
|---|---|---|---|---|---|---|
| UGC 2855; 12CO( | 5/96, 9/96 | 6k – 42 k | 3; spaced by | 65′′ | 3: C,L,H | |
| 5/97 | (15m – 115m) | 45′′ along bar | ||||
| 13CO | 5/98 | 5.7k – 82 k | 3; spaced by | 65′′ | 1: L | |
| (15m – 230m) | 45′′ along bar | |||||
| UGC 2866; 12CO | 5/96 | 6k – 44 k | 1 | 65′′ | 1: L | |
| 5/97 | (15m – 230m) |
: The array configurations at OVRO are labelled C (compact), L (low resolution) and H (high resolution)
For a beam size of , a brightness temperature () of 1 K corresponds to 0.304 Jy beam-1 at a wavelength of 2.6 mm. The spectral resolution of our data is 4 MHz or 10.04 , and the total velocity range covered by the autocorrelator is 1120 , centered on = 1200 .
Imaging was done using the NRAO AIPS package. To cover the long bar of UGC 2855 fully, we obtained a 3-field mosaic with a spacing of between the pointing centers. The fields were CLEANed individually and combined linearly, correcting for the attenuation of the primary beam, using the AIPS task LTESS.
To analyse the innermost structure (see Sect. 4.1), the beam size could be reduced to (PA 78∘) applying robust weighting (Briggs 1995), while a beam size of (PA –19∘) was reached when only the longer baseline data from the high resolution track were used. This (naturally weighted, since the signal-to-noise in the robustly weighted maps is too low) map includes baselines from 230 m to 35 m length, which means that structures larger than cannot be imaged. The increased resolution also goes along with a loss in sensitivity: The rms noise per channel increases from 0.11 K (34 mJy beam-1) in the naturally weighted map to 0.43 K (52 mJy beam-1) in the robustly weighted and 1.34 K (62 mJy beam-1) in the high-resolution-only maps.
The interferometric 12CO observations of UGC 2866 are summed up in Table 2. The naturally-weighted map of UGC 2866 has a beam size of (PA –68∘) and an rms noise of 0.20 K (38 mJy beam-1). The velocity resolution, velocity range and central velocity of these observations were the same as those of UGC 2855.
2.2 Interferometric 13CO observations
Data in the 13CO transition of the same three fields in UGC 2855 (see Table 2) that were mapped in 12CO were taken at OVRO in June 1998 under excellent weather conditions, using the same spectrometer configuration as for 12CO. The calibration and mapping procedure was identical to the 12CO measurements. The (naturally weighted) synthesised beam has a size of (PA ), and the sensitivity reached is 0.09 K (23 mJy beam-1).
2.3 Single-dish observations of UGC 2855
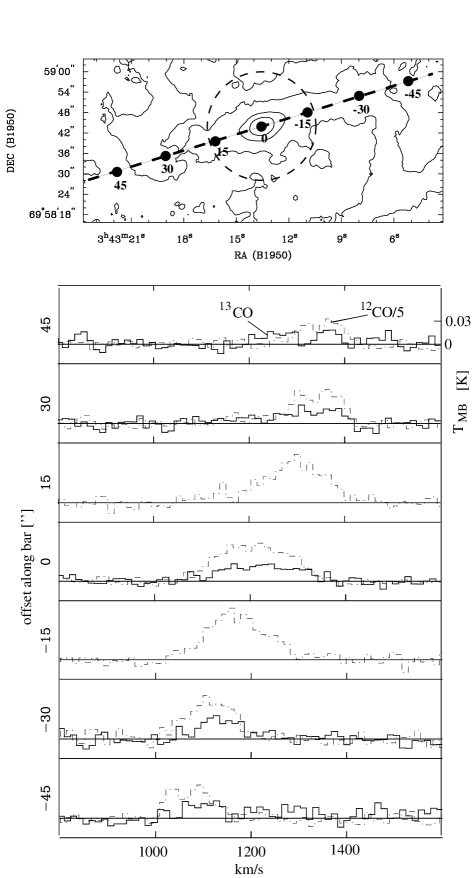
Single dish 12CO and 13CO data of UGC 2855 were obtained with the 20 m telescope at Onsala Space Observatory in December 1997 and January 1998. We observed 7 spectra along the bar in 12CO, spaced by 15′′ along the bar, and 5 positions in 13CO (see Fig. 3). The central position ( almost exactly coincided with the interferometric CO emission peak. The typical system temperature was 500 K – 600 K for 12CO and 200 K – 300 K for 13CO. The beam size is , and the spectra have been smoothed to a velocity resolution of . The Onsala spectra do not fully sample the entire area of the OVRO interferometer map and have pointing uncertainties of , preventing us from combining the single-dish data with the interferometry data into a single map.
2.4 H
An H image of UGC 2855 and UGC 2866 was taken using HoLiCam (Reif et al. 1995) at the 1.06 m telescope at Hoher List Observatory in October 1997. The conditions were not photometric, and the image provides relative information on fluxes only. However, no other deep H imaging of these galaxies is available at this time. The image was processed using the IRAF package.
3 Results
3.1 UGC 2855
UGC 2855 is a large spiral galaxy, almost the same size as the Milky Way, classified as SBc (RC3, de Vaucouleurs et al. 1991). At 20 Mpc distance, its linear diameter to the radius is 25 kpc. Assuming a Galactic extinction in the band of (Burstein & Heiles 1984), the absolute magnitude of UGC 2855 is , also comparable to the Milky Way. As it is typical for barred spirals, its main spiral arms start at the ends of the bar, and strong molecular emission can be traced in both the bar and the arms.
3.1.1 The distribution of 12CO
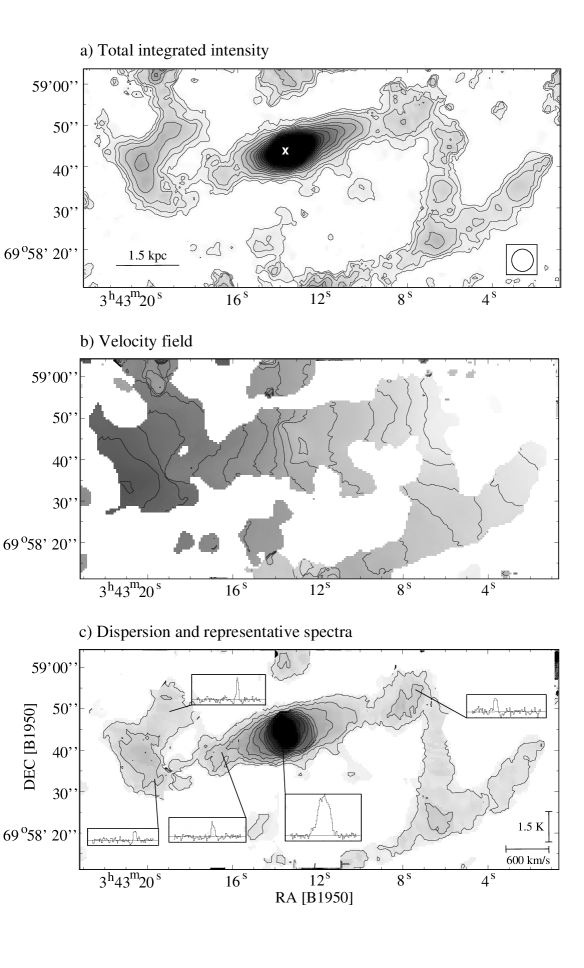
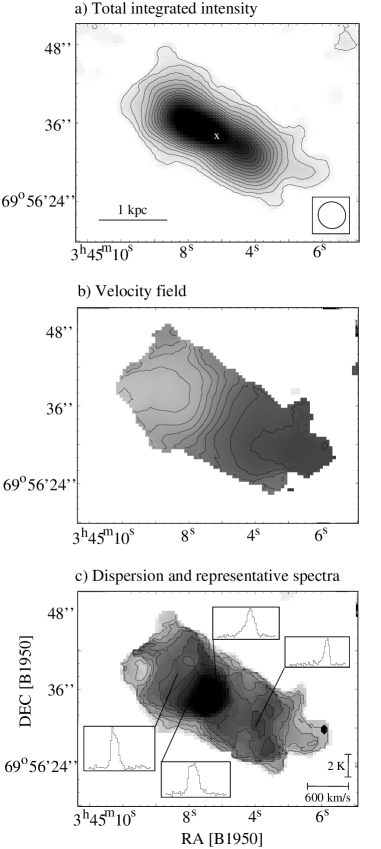
We present the total integrated intensity map, the velocity field and the map of the velocity dispersion from our interferometric 12CO observations in Fig. 1. From Fig. 1 a, it is clear that the bar in UGC 2855 is filled with molecular gas over its entire length. The position of the peak total intergrated intensity at and agrees almost exactly with the radio continuum peak ( and , Condon et al. 1996). The overall distribution of the molecular gas in the interferometer map is somewhat asymmetric: The northwestern part of the bar outside the center is brighter in CO by about a factor of 1.5 than its southeastern counterpart. This effect can be explained, at least partially, by the fact that the interferometer misses more flux in the southeast of the bar than in the northwest (see Sect. 3.1.2).
The bar major axis has a position angle of 110∘ and is thus aligned very closely with the line of nodes (the major axis) of the galaxy, which is at PA according to the I-band surface photometry of Héraudeau & Simien (1996). This implies that the bar is seen side-on, at its maximum length. Assuming this viewing geometry and an inclination of , the CO bar can be deprojected, following the formalism given by Martin (1995). The deprojected ratio of bar length to diameter is 0.3, while we determine the axis ratio of the minor and major bar axis to be 0.37. According to the classification of Martinet & Friedli (1997), the bar of UGC 2855 thus qualifies as both ‘long’ and ‘strong’.
The velocity field along the bar (panel b in Fig. 1) appears regular and suggests a solid body rotation. The isovelocity contours are roughly perpendicular to the bar major axis. The meaning of slight deviations from this behaviour will be explored further in Sect. 4.1.2.
The peak of the velocity dispersion (displayed in Fig. 1, panel c) coincides with the intensity peak. Along the bar, the dispersion drops by a factor of about 5 from to . At the bar ends, rises slightly to . The narrowness of the lines along the bar is also demonstrated by sample spectra in Fig. 1 c.
3.1.2 Line fluxes and the molecular mass
The total flux in the map is Jy . It is evident from optical images that the spiral arms extend far beyond our map. Thus, this CO flux is a lower limit only and demonstrates that UGC 2855 is a gas-rich galaxy. Assuming a galactic ‘standard’ (CO)–(H2) conversion factor (SCF, cm-2 (K )-1, e.g. Strong et al. 1988), this corresponds to a total H2 mass of M⊙. This conversion factor is suspect, especially in the centers of galaxies (Dahmen et al. 1998). It may vary greatly between galaxies and also within a galaxy, depending on the properties of the molecular gas, e.g. the amount of diffuse gas, and on the metallicity (Arimoto et al. 1996). We give a rough estimate of how far the SCF might overestimate the molecular mass by comparing it to the result we derive from the 13CO line intensity. We assume LTE, optically thin 13CO emission, a kinetic temperature of 20 K, a 12CO/13CO ratio of 30 (thought to be typical for centers of galaxies) and a 12CO/H2 ratio of . Then, the H2 column density derived from 13CO for the center of UGC 2855 is lower by a factor of 8 than the column density calculated using the SCF. Interestingly, this value is the same for the interferometric and the single-dish observations, even though the absolute values for the column densities are higher for the far smaller interferometer beam by a factor of more than 10. To force agreement between the column density derived from 13CO and the SCF, we would have to raise to 190 K. For positions off the center, the correction implied by 13CO is smaller by as much as a factor of two. Corroborating evidence from our galaxy as well as external galaxies (e.g. Wall et al. 1993) confirms that gas column densities determined from the SCF and 13CO generally agree better away from the nuclear regions. Of course, the estimates based on 13CO depends on the assumed value of : If there is a gradient in with galactocentric radius (with hotter gas closer to the nucleus), this effect may be cancelled. Thus, the assumptions made for the 13CO emission are vastly oversimplified, but the estimate demonstrates the range of uncertainty of the molecular masses.
Throughout this paper, we will give masses based on the SCF to facilitate comparisons with other work and also because a determination of a ‘correct’ conversion factor that goes beyond the estimate given above would require detailed information on the gas properties not yet available. It should be kept in mind, though, that the masses may be lower by almost an order of magnitude.
As a further complication, the interferometer is likely to filter out flux from an extended gas component due to missing zero spacing coverage. We find a shallow negative trough surrounding the strongest features in our map, indicating that the array may indeed miss some extended emission. To get a rough estimate of the amount of missing flux, we have compared the flux contained in single Onsala beams (see Fig. 3) to the flux in equivalent regions of the interferometer beam, weighted by the shape and size of the single dish beam (assumed to be gaussian). From this, toward the center and the northwestern part of the bar, we see at least 80% of the single dish dish flux in the interferometer map. For the southeastern part of the bar, there are indications that a somewhat lower amount of flux is picked up by the interferometer, but still at least 65% (and possibly as much as 80%) of the single dish flux is seen. These numbers imply that not much gas is distributed in a very diffuse component that has little structure on scales exceeding kpc. However, all pointing and calibration errors enter in this estimate, which therefore has to be considered to be very tentative. Clearly, in the mass estimates, the error introduced by the missing flux is dominated by the uncertainty of the conversion factor.
The total flux the interferometer detects along the bar, including the bar end regions, but excluding the beginning of the spiral arms, is 895 Jy . This corresponds to a molecular mass of M⊙, under the assumptions described above. The central beam contains a flux of 137 Jy ( M⊙).
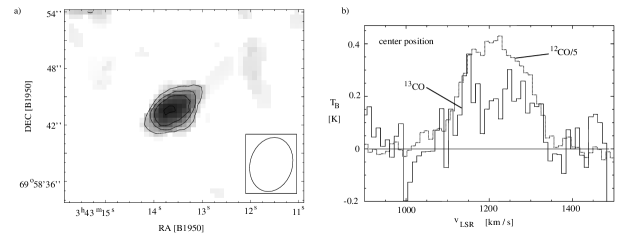
3.1.3 13CO
The results of the OVRO 13CO measurements are presented in Fig. 2. Panel a shows the total integrated intensity distribution. 13CO is only detected toward the center of UGC 2855. Assuming a constant 12CO/13CO line intensity ratio (see below), this is, however, expected, since the sensitivity in the 13CO map is not sufficient to detect emission away from the intensity peak. The positions of the 13CO peak and the 12CO peak are identical. To within the noise, the linewidth and the line shape of the two isotopomers also agree (Fig. 2, panel b). The observations taken at the OSO 20 m telescope (Fig. 3) confirm the good agreement between the line shapes of 12CO and 13CO.
3.1.4 H
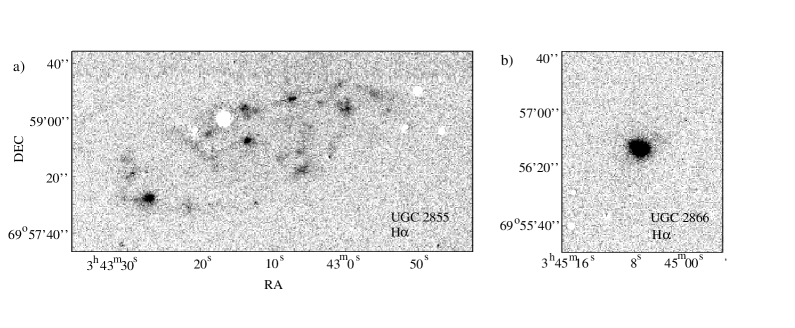
Figure 4 (panel a) shows our H image of UGC 2855. Since the image lacks an absolute scale, absolute H fluxes or star formation rates cannot be derived. However, it gives information on the relative strength of H emission and thus star formation activity, in the center, along the bar and in the spiral arms. H emission is clearly detected in the center, but the central peak is not the strongest one in the galaxy. The peak in the southeastern spiral arm, outside the limits of our CO map, is almost twice as strong as the central emission, and the emission from three more peaks, all at the very edge or outside our CO mosaic, has roughly the same strength as the central emission. This demonstrates that, while there is some central activity, the nucleus of UGC 2855 is not (yet?) in a starburst phase. Of course, the nuclear H emission may be subject to more extinction than the emission from the spiral arms (Phillips 1996). However, starburst galaxies show nuclear H emission that is clearly enhanced over that seen in their disks, despite having stronger extinction effects in their nuclei than in their disks (e.g. Contini et al. 1998, who find that the H luminosity in the starburst nuclei of their sample is higher by a factor of than in extranuclear H II regions; another example is UGC 2866, see Sect. 3.2).
Along the bar, in particular the southeastern part, faint H emission is detected. Even though the subtraction of the background is problematic, we estimate that the total emission (not corrected for extinction) from the bar and the emission from the central region are about equal.
3.2 The companion: UGC 2866
The picture presented by UGC 2866, the smaller, distant companion of UGC 2855, is very different. The classification of this galaxy is not clear: The UGC catalogue (Nilson 1973) tentatively calls it an early spiral, while it is (mis)classified as an elliptical by Hau et al. 1995. It is one of only 21 galaxies from the IRAS PSC that are stronger than 1.5 Jy at both 12m and 25m with IRAS LRS spectra allowing its identification as an H II galaxy in the sample of Cohen & Volk (1989). All the molecular gas of UGC 2866 seems to be concentrated in one feature of slightly more than 2 kpc length that has an oval, possibly bar-like appearance (Fig. 5 a). The emission peaks at and , unusually far () offset from the radio continuum peak at and (Condon 1996).
The generally smooth, almost classical ‘spider’ shape of the velocity field (Fig. 5 b) indicates gas that is predominantly in circular motion, though some deviations, especially close to the edges of the structure, are present. The velocity dispersion is, once more, highest in the center, but the drop along the major axis is less extreme than in UGC 2855. For an offset along the major axis of UGC 2855 of and , the dispersion drops from the central peak of 73 to 23 and 19 respectively, while the drop for corresponding offsets in UGC 2866 (central peak at 75 ) is only to 36 and 44 .
We detect a total flux of 543 Jy in our map of UGC 2866, which, again assuming a ‘standard’ conversion factor, translates to an H2-mass of M⊙, not much smaller than what is found in the bar of UGC 2855. The central beam contains M⊙ of H2. If the radiocontinuum peak is identified with the dynamical center of the galaxy, about 55% of the CO emission arises in the northeastern half, which also contains the intensity maximum.
The H emssion from UGC 2866 (Fig 4, panel b, a part of the same CCD frame as the image of UGC 2866) is very bright and very compact: it extends over only or pc. The intensity of the emission is more than 6 times higher than what is found toward the center of UGC 2855. The center position of H coincides with the CO peak in UGC 2866 to better than 1′′, i.e. to within the measuring uncertainty. The strength and compactness of H in UGC 2866 and the FIR properties (see below) indicate that this galaxy is experiencing a nuclear starburst.
4 Discussion
4.1 Gas surface densities
In the central beam, the surface density of UGC 2855 (corrected for an inclination of ) is M⊙ pc-2. In the inner part of the bar, this value drops to M⊙ pc-2. UGC 2866 has a central mass surface density of M⊙ pc-2 (for ). These numbers (remember, however, that they are based on the SCF) are high enough to place UGC 2855 and especially UGC 2866 in the range of IR-bright starburst galaxies (e.g. Scoville 1991), but only UGC 2866 clearly is a starburst. A significantly lower gas mass (as discussed in Sect. 3.1.2) would reduce ; however, a similar correction is likely to be also necessary for the sample of IR bright starbursts, so that UGC 2855 and UGC 2866 would remain in this group. Starburst properties depend on morphology and dynamics (e.g. Kenney 1997), but the central concentration found in UGC 2855 should be a fairly favorable environment. We will, however, speculate below that UGC 2855 may be in a preburst phase.
4.2 Kinematics of the gas: UGC 2855

4.2.1 Rigid rotation and a high velocity feature
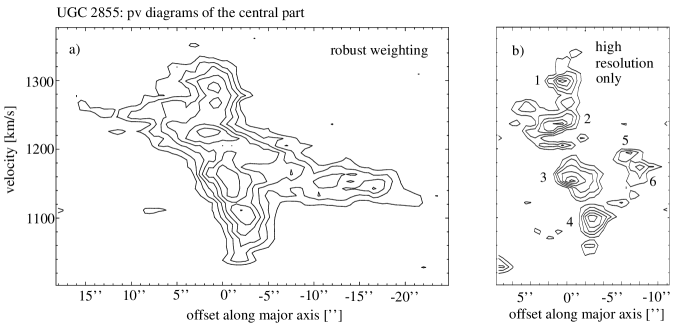
A position-velocity diagram of UGC 2855 along the major axis of the bar (Fig. 6) shows solid body rotation in the bar out to its end at a radius of kpc. Close to the center, extending to only a radius of 3′′ or 290 pc, there is another feature with a total velocity width of almost 300 . Figure 7 illustrates the clumpiness of this structure at higher resolution.
An important question to be asked of a galactic bar is whether an Inner Lindblad Resonance (ILR) exists and where it is located. The presence of an ILR affects the ease with which gas can reach the galactic nucleus: At an ILR, material is often trapped in a circumnuclear structure and prevented from further infall.
The general shape of the position-velocity diagram of UGC 2855 could be modelled in terms of a bar with an ILR. Models like those applied by García-Burillo & Guélin (1995) to NGC 891 match the pattern we see almost perfectly (see especially their Fig. 8). The best fit occurs if the bar of UGC 2855 is seen almost side-on, i.e. along its minor axis, the angle also implied by the orientation of the bar parallel to the major axis of the galaxy. In this model, the ‘high velocity feature’ represents gas on (anti-bar) orbits, while gas on bar-enforcing orbits causes the ‘main’ feature.
Despite the close match, caution is necessary in applying this model directly to UGC 2855. The modelling of NGC 891 assumed a weak bar, while the bar of UGC 2855 is strong. Strong bars, however, are not expected to have an ILR (Friedli 1998), and therefore orbits may not occur. A possible way out is an ILR that is located very close to the nucleus, so that the -to- coverage ratio remains very small. In this case, long, gas-rich bars with an ILR may still be possible (Ishizuki 1997). From the structure we see, we can thus place the ILR at an outermost radius of (290 pc). Still, even an ILR at radius might betray itself by the presence of gas on -orbits elongated along the minor bar axis. Often, galaxies with an ILR show circumnuclear rings with emission maxima (‘twin peaks’) where the and orbits intersect and gas accumulates (see Kenney et al. 1992, Downes et al. 1996, Sempere et al. 1995a for examples). No such structure along the minor bar axis is visible in UGC 2855.
Thus, the bar of UGC 2855 may not have an ILR at all. Since the high velocity pattern shows no forbidden velocities (which are, however, not expected for a viewing angle along the minor axis), it may also be a circularly rotating structure, i.e. a clumpy disk. This structure may be fed efficiently by gas falling in along the bar, especially if no ILR is present.
The end of the bar at kpc gives a firm lower limit to the location of the corotation radius (e.g. Elmegreen 1996). If corotation occurs close to the bar end, as is often assumed and indicated by numerical simulations (e.g. Athanassoula 1992), a pattern speed of the bar of 5.2 arcsec-1 or 53 kpc-1 is derived. However, Combes & Elmegreen (1993) argue that, especially in late-type galaxies, the length of the bar is determined by the scale length of the disk and corotation may be far outside the radius of the bar ends.
The rotation curve along the major axis, which coincides with the bar axis, does not represent the circular rotation curve of the galaxy and cannot be used to determine . Thus, a stringent determination of the location of the resonances has to await an evaluation of the potential of the galaxy, e.g. using a K-band image to obtain the mass distribution.
4.2.2 Velocity gradients
The isovelocity contours along the bar of UGC 2855 are almost perpendicular to the bar major axis. However, some deviations are found. Velocity differences, indicating streaming motions across the bar measured parallel to the minor bar axis, are typically 20 in the plane of the galaxy (assuming ). There are variations, especially between the two sides of the galaxy (see Table 3): The velocity gradient is generally higher in the southeastern part of the bar, reaching a maximum of 46 kpc-1 at an offset of 14′′ from the center.
| pos | gradient | pos | gradient | ||
|---|---|---|---|---|---|
| ′′ | ′′ | ||||
| –30 | 18 | 15 | +30 | 17 | 12 |
| –22 | 19 | 20 | +22 | 29 | 22 |
| –14 | 14 | 12 | +14 | 36 | 46 |
| –6 | 12 | 9 | +6 | 29 | 27 |
These velocity gradients perpendicular to the bar axis of UGC 2855 are comparatively small and smooth. One could suspect that, if there is a very sharp discontinuity, even the high resolution of our interferometric map might be insufficient to show it. However, the low dispersion we find in the region of the bar of UGC 2855 where the streaming motions reach a maximum implies that there is indeed no smoothed out, unresolved shock feature hidden.
A largely perpendicular orientation of the velocity contours with respect to the bar major axis is expected from simulations of gas streamlines in bar potentials if the bar is seen side-on. For this case, van Albada & Roberts (1981) predict, however, a very sharp, spikelike discontinuity in velocity across the bar, indicating the presence of a shock. In a large number of model runs Athanassoula (1992) almost always finds sharp velocity jumps, connected to dust lanes, shocks and gas density enhancements, usually on the leading side of the bar, no matter whether the bar has an ILR or not. Interestingly, the only model with no shock in her sequence is the one having the lowest central mass concentration (and no ILR). Since infall along a bar should increase the central mass with time, it seems likely that a situation like this prevails early in the evolution of a bar. This agrees with the expectations of a linear theory of swing amplification for the initialisation of a bar, which requires the bar to set out with no ILR (Toomre 1981).
The general shape of the velocity contours we observe agrees with the predictions of the “no-shock”-model, especially on the more undisturbed northwestern side of the bar, where there are even hints of the expected ‘bulges’ in the contours at offsets of about along the bar.
The only velocity discontinuity found along the bar occurs very locally, in a curved region at a major axis offset of about , close to the bar end. Here, a jump of close to 80 over little more than is seen, i.e. the discontinuity is unresolved and corresponds to a gradient of at least 600 kpc-1. It is noteworthy that this region is located on the more disturbed side of the bar.
4.2.3 Properties of the inner structure
If the inner high velocity structure is a circularly rotating disk, presumed to be aligned with the plane of the galaxy, i.e. seen at an inclination of 60∘, its dynamical mass will be M⊙ (assuming a radius of 290 pc and a circular velocity of 160 in the plane of the galaxy, estimated from Fig. 7). The total mass in the central region of UGC 2855 may thus be smaller than the mass in the inner 300 pc radius of the Milky Way ( M⊙, e.g. McGinn et al. 1989).
The H2 mass from the high resolution data in this area is M⊙. This rises to M⊙ if the naturally weighted map of the central region is evaluated. After the helium correction, M⊙ or more than half of the dynamical mass in the central 3′′ radius along the bar may thus be gaseous (for a lower gas mass, this percentage drops by a factor of up to 8).
The clumpiness of the high velocity feature (Fig. 7 b) allows the identification of 6 molecular cloud complexes above the level, labeled 1 to 6 in Fig. 7 b. The complexes 5 and 6 show a clear drop in velocity and are likely to belong to the main bar structure.
The diameters of these complexes, which can only be resolved as distinct entities in a pv-diagram, are of order 300 pc. With a velocity width of , they have virial masses of roughly M⊙. This matches the definition of Giant Molecular Associations (GMAs) coined by Vogel et al. (1988). We find an H2 (SCF) mass of typically M⊙ for these structures, which may suggest that they are bound objects.
It is interesting to note that no intensity peak at the center corresponds to the systemic velocity of 1200 . This explains the slight blueshift observed in the velocity field (Fig 1 b) at the center. It might also suggest an explanation for the moderate star formation even in the high surface density central region. The inner structure may be better described as a torus with a central hole of radius than as a centrally peaked disk. It it even conceivable that this structure is an inner bar, possibly with its own pattern speed (and an ILR at 0.5′′ radius). There is, in fact, a hint of a slight misalignment of the major axis of the inner structure with respect to the main bar: both the high resolution 12CO and the 13CO data are matched better by PA of than by the determined for the large scale bar.
4.3 UGC 2866

The position-velocity diagram along the major axis of UGC 2866 is displayed in Fig. 8. It confirms that all the molecular gas in this galaxy is part of one kinematic structure. It is, however, not possible to decide whether this structure is a bar or a circularly rotating disk. In the case of a rotating disk, inclined by 30∘, the dynamical mass is M⊙. However, if a circular disk was assumed, the measured axis ratio of the CO structure of would imply an inclination of . Thus, the value of deduced from the catalogued axis ratios seems too small. Alternatively, the observed discrepancy can be interpreted as pointing toward a bar morphology for the molecular structure.
4.4 Not all gaseous bars are equal: Evolutionary effects?
From the rarity of continuous gas-rich bars it can already be inferred that these phenomena have to be transient. This is true even though some caution is necessary: Only few galaxies have been fully mapped in molecular gas, and thus bars rich in molecular gas may be more frequent than is apparent today (Turner 1996). We found one gas-rich system with a long bar (UGC 2855) and another system the morphology of which is compatible with all gas being in bar-like structure (UGC 2866) among only three galaxies we have inspected so far. The ready success of our search for such systems suggests that such objects might not be extremely uncommon.
Evolutionary scenarios suggest that infall of matter along bars drives a change from a later to an earlier galaxy type, since the flow concentrates mass in the center, leading to a more pronounced bulge or nuclear region. UGC 2855, classified as SBc, does not seem to have a large central mass concentration (though we do not yet have K-band data to derive the mass distribution of the galaxy), so it may be at the beginning of the concentration process. In this case, the bar may be very young, in line with the notion that interaction with UGC 2866 has recently triggered its formation.
4.4.1 Gas and star formation properties: a comparison between UGC 2855 and NGC 7479
Two of the longest gas-rich bars known, the one of NGC 7479 and the one of UGC 2855 reported here, are very dissimilar objects. This is especially obvious when one inspects the H images: The bar of NGC 7479 is clearly outlined in H emission, indicating vigorous star formation all along it (Martin & Friedli 1997, Quillen et al. 1995). Dust lanes at the leading edge of the bar are widely regarded as indicators of a shock front (e.g. Athanassoula 1992). In contrast, the bar in UGC 2855 is only barely visible in H (Fig. 4 a). It is interesting to note that the part of the bar southeast of the nucleus, which is weaker in (interferometrically detected) CO, but more disturbed in velocity, is the region of the bar where faint H can be most clearly detected.
May the gas in the bar of UGC 2855 be in a more quiescent state than in the bar of NGC 7479? Clearly, the degree of star formation as indicated by H emission varies over a wide range in barred galaxies (Martin & Friedli 1997).
| Position | Telescope | ratio |
|---|---|---|
| UGC 2855 center | OVRO | 9.5(2.0) |
| UGC 2855 center | OSO 20m | 10.0(1.0) |
| UGC 2855 | OSO 20m | 8.2(5.0) |
| UGC 2855 | OSO 20m | 7.9(1.6) |
| UGC 2855 | OSO 20m | 5.1(4.0) |
| UGC 2855 | OSO 20m | 5.0(1.3) |
| NGC 7479 center | OVRO | 15 – 35 |
| NGC 7479 along bar | OVRO | |
| NGC 7479 bar ends | OVRO | 6 – 10? |
| galactic disk | — | |
| centers of ‘normal’ galaxies | — |
a) Polk et al. 1988; b) Aalto et al. 1995
12CO/13CO line ratios may give a hint here, since they allow insight into gas properties: In the cool ISM of the Galatic disk, where the 12CO line has a high optical depth, this ratio is (Polk et al. 1988). Centers of normal galaxies (including, at least on scales averaged over a large part of the Central Molecular Zone, our own Galactic center region) typically have 12CO/13CO ratios ranging from 10 – 20. A high ratio is () can indicate higher gas kinetic temperatures, the presence of diffuse molecular gas (e.g. Aalto et al. 1995), or, alternatively, higher gas densities, though, from non-LTE models, this effect alone cannot account for ratios exceeding . These relations can only serve as a rough guide, since they do not include abundance effects, and a multi-transition study including more than two lines is needed for a proper excitation analysis that allows us to distinguish between the possibilities listed above. Still, a varying 12CO/13CO line ratio is a clear indicator of changes in the gas properties.
In NGC 7479, large variations are found, with the ratio exceeding 20 along the bar, where the OVRO interferometer does not detect 13CO, and a very variable (15 – 35) ratio in the center (Aalto et al. 1998). Our interferometric and complimentary single dish measurements, which have detected 13CO in several positions along the bar, indicate a more constant line ratio of just below 10 along the bar in UGC 2855, with only a slight trend toward an increase (to 10) in the center. This might mean that the amount of diffuse or hot gas in the bar of UGC 2855 is lower than in NGC 7479 (see Table 4). The narrow line widths found in the bar of UGC 2855 support this notion. Of course, caution is required when interpreting these line ratios, since the 33′′ beam of the OSO single dish telescope picks up emission from the spiral arms. Still, the excellent agreement of the ratios between the interferometer and the single dish telescope in the center implies that not much diffuse emission missed by the interferometer is present there. This is confirmed by the flux comparison between interferometer and single dish data (Sect. 3.1.2).
It is suggestive (though only marginally significant) that the OSO 12CO/13CO line ratios in the northwestern part of the bar, which shows a more regular velocity field than the southeastern part, are slightly lower, possibly indicating even more quiescent, ‘disk-like’ gas properties. Along the same line of argument, more flux seems to be missing from the interferometer map in the southwestern bar, and more H emision is detected, indicating a larger amount of diffuse gas and less quiescent conditions in this region.
We would expect shocks along the bar to trap the diffuse gas and prevent it from moving into the center more effectively than the dense gas. Thus, the observation of lower 12CO/13CO line ratios along the bar of UGC 2855 than in the bar of NGC 7479 ties in very well with the indication of less or no shocks along its bar derived from its velocity field (Sect. 4.1.2).
The velocity field of NGC 7479 is distinctly different from the regular field of UGC 2855, where the contours are almost perpendicular to the bar major axis. In contrast, the velocity field in NGC 7479 appears far more disturbed. The velocity contours close to the center of NGC 7479 at high resolution are almost parallel to the bar axis (Aalto et al. 1999 in prep. the field shown by Sempere et al. (1995b) based on single dish observations does not show this clearly). Part of the difference between the two galaxies can be attributed to different viewing geometries, since the angle between the bar axis and the line of nodes in NGC 7479 () suggests that the bar is not seen entirely side on. Indeed, early optical work on the velocity fields of barred galaxies (Pence & Blackman 1984) as well as the numerical simulations (van Albada & Roberts 1981) already clearly indicate that ‘S shaped’ velocity contours, which are partially parallel to the bar axis, are best seen in galaxies where the orientation of the bar is close to 45∘ with respect to the line-of-sight.
Still, all evidence, both dynamical and excitational, points toward there being no large-scale shock present along the bar of UGC 2855, while the discontinuities in the velocity structure of NGC 7479 are consistent with a shock. This is also indicated by a shock-like feature discovered at the leading edge of the bar in NIR color maps by Quillen et al. (1995).
In the future, an optical image of UGC 2855 that allows the detection (or exclusion) of the presence of dust lanes will be helpful to finally decide the question of whether the gas in the bar of this galaxy indeed manages to escape being shocked.
The FIR color index is routinely used to indicate dust (color) temperatures. The value of 2.6 found for UGC 2855 suggests K, assuming a spectral emissivity index of 1.5 and 1.0 for the lower and upper temperature limits, respectively, and applying color corrections. for NGC 7479 may be slightly higher, with corresponding values K. Estimating dust temperatures using the 60 m flux is problematic since the 60 m flux can have a large contribution from stochastically-heated dust grains, thereby over-estimating the temperature of the thermal-equilibrium grains that dominate the mass of the dust (see e.g. Désert et al. 1990, Wall et al. 1996). This effect is likely to be most pronounced in large spirals like UGC 2855 and NGC 7479 where the IRAS flux encompasses more than the nucleus and the bar. Still, these color temperatures hint at more star formation activity in NGC 7479. Interestingly, UGC 2866 has, again under the conventional assumptions, a high of K. This appears to be consistent with the high degree of star formation activity indicated by the H emission.
4.4.2 The evolutionary state of the bar of UGC 2855
Is it possible to place the bar of UGC 2855 in an evolutionary scheme? Martinet & Friedli (1997) use the IRAS color index as an indicator of star formation activity, relate it to bar strength and length and calculate 3-dimensional self-consistent models of bar evolution to predict the variation of these parameters with time. In their scheme, UGC 2855, having , (barely) belongs to a the group of galaxies with less pronounced star formation. Since the bar is both long and strong, this places it in either an early, preburst stage ( Myr) or in a late, postburst state ( Myr). The central-to-bar H emission ratio suggests an early evolutionary stage in the models of Martin & Friedli (1997). However, these models are still unable to explain all observed bar properties and differ significantly depending on the initial parameters, e.g. the star formation efficiency and the mechanical energy released into the ISM.
On the side of the observations, it has also to be kept in mind that the large IRAS beam may pick up significant emission from the gas-rich spiral arms of UGC 2855, and that the H activity is generally low in the bar, making the ratio uncertain. Still, these indicators together with the high gas content of the bar and the moderate mass concentration in the center let us speculate that the bar in UGC 2855 may be young. Then, this presently inconspicious galaxy has the potential to become a spectacular starburst in the future.
5 Conclusions
The main results of our high resolution study of the stellar bar region of the SBc galaxy UGC 2855 and of its companion UGC 2866 are:
-
1.
The interferometric image of the 12CO transition of UGC 2855 reveals a continuous molecular bar of length kpc. UGC 2855 thus becomes one of only a few galaxies known to have dense gas distributed all along its stellar bar. The molecular mass detected in the bar is M⊙, if a standard CO-H2 conversion factor is assumed. The intensity distribution appears strongly centrally peaked.
-
2.
The velocity field of the gas along the bar is dominated by solid body rotation. Only slight perturbations, indicative of streaming motions across the bar, are found. The smooth changes and lack of discontinuities in the velocity field together with the narrow line widths suggest that the gas along the bar of UGC 2855 does not experience strong shocks.
-
3.
The 12CO/13CO ratio along the bar and in the center is almost constant at 5 – 10. This ratio, which is typical for the disks (5) and centers (10) of normal galaxies, also indicates quiescent conditions along the bar.
-
4.
Only weak H emission is detected along the bar of UGC 2855. The emission is stronger in the southeastern part of the bar, where the velocity field of the molecular gas is more disturbed. The center is clearly detected in H, but the strongest H peak is associated with a spiral arm. Higher extinction in the nucleus might change this ratio, but even then the central region would not dominate in H as it does in many starburst galaxies. Thus, while there is some central star formation activity, UGC 2855 is not (yet) a starburst galaxy, as is also indicated by the IRAS color index.
-
5.
A high velocity structure dominates the inner radius of the bar. This structure is responsible for the strong central intensity peak. It breaks up into a number of possibly virialised GMAs, the velocity of none of which coincides with the systemic velocity. This structure may be a clumpy disk, a torus or even an inner bar, in all cases fed by gas infalling along the main bar. In the simple case of a rotating disk, more than 50% of the dynamical mass ( M⊙, which is less than the mass in the corresponding inner region of the Galaxy) may be gaseous.
-
6.
In models, shocks along a bar can be avoided if the central mass concentration is low. Then, the bar has no ILR. Even though the velocity structure seen can also be explained in terms of a bar with an ILR, this is an attractive model for UGC 2855 since it naturally explains the quiescent gas along found along the bar, as well as the absence of any feature along the bar minor axis expected from gas on orbits.
-
7.
In contrast, the gas-rich bar of NGC 7479 shows a disturbed velocity field, varying 12CO/13CO line ratios and strong H emission both along the bar and in the center. This demonstrates that even among the small group of galaxies with gas-rich bars large differences are found.
-
8.
In evolutionary terms, we suggest that the bar of UGC 2855 is a very young object, where the process of central concentration is just starting. Then, this galaxy is likely to develop into a starburst in the future, a state that NGC 7479 has already reached.
-
9.
UGC 2866, the companion of UGC 2855, shows strong CO emission (corresponding to M⊙ with a standard conversion factor) in a continuous, possibly bar-like feature of about 1.5 kpc radius. Both the FIR colors and the very strong H emission concentrated in the inner 300 pc indicate that this galaxy is already experiencing a strong starburst.
-
10.
The activity in both UGC 2866 and UGC 2855 may have been triggered by interaction between the two galaxies. The response time in the small, compact galaxy, UGC 2866, may be shorter than in the large, open spiral UGC 2855, thus explaining the different level of activity seen at present.
Acknowledgements.
We thank John Black for first drawing our attention to a pair of galaxies that only seemed inconspicious. We are very grateful to Martin Altmann for taking the H image at Hoher List and helping with its processing. We also gratefully acknowlegde the support of the staff of OVRO and OSO. The OVRO mm-array is supported in part by NSF grant AST 9314079 and the K.T. and E.L. Norris Foundation.References
- (1) Aalto S., Booth R.S., Black J.H., Johansson L.E.B., 1995, A&A 300, 369
- (2) Aalto S., Hüttemeister S., Das M., Wall W.F., 1998, in: The central regions of the Galaxy and galaxies, ed. Y. Sofue (IAU Coll. 184), p. 251
- (3) Arimoto N, Sofue Y., Tsojimoto T., 1996, PASJ 48, 275
- (4) Athanassoula E., 1992, MNRAS 259, 345
- (5) Burstein D., Heiles C., 1984, ApJS 54, 33
- (6) Briggs D.S., 1995, PhD Thesis, The New Mexico Insitute of Mining and Technology
- (7) Cohen M., Volk K, 1989, AJ 98, 1563
- (8) Combes F., Elmegreen B., 1993, A&A 271, 391
- (9) Condon J.J., Helou G., Danders D.B., Soifer B.T., 1996, ApJS 103, 81
- (10) Contini T., Considère S., Davoust E., 1998, A&AS 130, 285
- (11) Dahmen G., Hüttemeister S., Wilson T.L., Mauersberger R., 1998, A&A 331, 959
- (12) Das M., Jog C.J., 1995, ApJ 451, 167
- (13) Désert F.-X., Boulanger F., Puget J.L., 1990, A&A 237, 215
- (14) Downes D., Reynaud D., Solomon P.M., Radford S.J.E., 1996, ApJ 461, 186
- (15) de Vaucouleurs G., de Vaucouleurs A., Corwin Jr. H.G., et al., 1991, Third Reference catalogue of Bright Galaxies (Springer, New York)
- (16) Elfhag T., Booth R.S., Höglund B. et al., 1996, A&AS 115, 439
- (17) Elmegreen B., 1996, in: Barred Galaxies, ed. R. Buta et al. (IAU Coll. 157), 197
- (18) Friedli D., 1998, in: The central regions of the Galaxy and galaxies, ed. Y. Sofue (IAU Coll. 184), 269
- (19) García-Burillo S., Guélin M., 1995, A&A 299, 657
- (20) Hau G.K.T., Fergusen H.C., Lahav O., Lynden-Bell D., 1995, MNRAS 277, 125
- (21) Hawarden T.G., Huang J.H., Gu Q.S., 1996, in: Barred Galaxies, ed. R. Buta et al. (IAU Coll. 157), 54
- (22) Héraudeau Ph., Simien F., 1996, A&AS 115, 111
- (23) Ho L.C., Fillipenko A.V., Sargent W.L.W., 1997, ApJ 487, 591
- (24) Ishizuki S., 1997, in: CO: 25 years of Millimeter Wave Spectroscopy, (IAU Coll. 170), ed. W.B. Latter et al., 317
- (25) Jackson J.M., Eckart A., Camaron M., et al., 1991, ApJ 375, 105
- (26) Kenney J.D.P., 1996, in: Barred Galaxies, (IAU Symp. 157) ed. R. Buta et al., 150
- (27) Kenney J.D.P., 1997, RevMexAA 6, 52
- (28) Kenney J.D.P., Wilson C.D., Scoville N.Z., et al., 1992, ApJ 395, L79
- (29) Martin P., 1995, AJ 109, 2428
- (30) Martin P., Friedli D., 1997, A&A 326, 449
- (31) Martinet L., Friedli D., 1997, A&A 323, 363
- (32) McGinn M.T., Sellgren K., Becklin E.E., Hall D.N.B., 1989, ApJ 338, 824
- (33) Nilson P., 1973, Uppsala Ganeral Catalogue of Galaxies, Acta Universitatis Upsaliensis, Nova Regiae Societatis Upsaliensis, Series V: A Vol. 1
- (34) Noguchi M, 1996, ApJ 469, 605
- (35) Pence W.D., Blackman C.P., 1984, MNRAS 210, 547
- (36) Phillips A.C., 1996, in: Barred Galaxies, ed. R. Buta et al. (IAU Coll. 157), 44
- (37) Polk K.S., Knapp G.R., Stark A.A., Wilson R.W., 1988, ApJ 332, 432
- (38) Quillen A.C., Frogel J.A., Kenney J.D.P., et al., 1995, ApJ 441, 549
- (39) Reif K., DeBoer K., Mebold U., et al., 1995, Mitt. Astron. Ges. 17, 42
- (40) Scoville N.Z., 1991, in: Dynamics of galaxies and their molecular cloud distributions (IAU Symp. 146), eds.: F. Combes, F. Casoli, 315
- (41) Sempere M.J., García-Burillo S., Combes F., Knapen J.H., 1995a, A&A 296, 45
- (42) Sempere M.J., Combes F., Casoli F., 1995b, A&A 299, 371
- (43) Sofue Y., Yoshinori T., Honma M., Tomita A., 1997, AJ 114, 2428
- (44) Strong A.W., Bloemen J.B.G.M., Dame T.M., et al., 1988, A&A 207, 1
- (45) Toomre A., 1981, in: The structure and evolution of normal galaxies, eds.: S.M. Fall, D. Lynden-Bell, Cambridge University press, 111
- (46) Turner J., 1996, in: Barred Galaxies (IAU Symp. 157), ed. R. Buta et al., 143
- (47) van Albada G.D., Roberts W.W.R., 1981, ApJ 246, 740
- (48) Vogel S.N., Kulkarni S.R., Scoville N.Z., 1988, Nat. 334, 402
- (49) Wall W.F., Jaffe D.T., Bash F.N., et al., 1993, ApJ 414, 98
- (50) Wall W.F., Reach W.T., Hauser M.G., et al., 1996, ApJ 456, 566
- (51) Young J.S., Xie S., Tacconi L., et al., 1995, ApJS 98, 219
- (52) Zenner S., Lenzen R., 1993, A&AS 101, 363