The Hubble Deep Field Reveals a Supernova at z0.95
Abstract
We report the discovery of a variable object in the Hubble Deep Field North (HDF-N) which has brightened, during the 8.5 days sampled by the data, by more than 0.9 mag in I814 and about 0.7 mag in V606, remaining stable in B450. Subsequent observations of the HDF-N show that two years later this object has dimmed back to about its original brightness in I814. The colors of this object, its brightness, its time behavior in the various filters and the evolution of its morphology are consistent with being a Type Ib supernova in a faint galaxy at 0.95.
keywords:
cosmology: observations — early universe — supernovae1 Introduction
The discovery of supernovae (SNe) in the early universe is of great interest because they can provide a wealth of information about cosmological parameters and the cosmic star formation history. It is now believed that the star formation activity in the universe very likely started in small objects which later on merged to form larger units (Couchman & Rees 1986, Ciardi & Ferrara 1997, Haiman et al. 1997, Tegmark et al. 1997, Ferrara 1998). Unless the IMF at high- is drastically different from the local one, some of the formed stars will end their lives as SNe. Detecting high- SNe would be of primary importance to clarify how reionization and rehating of the universe proceeded [Ciardi & Ferrara 1997], and, in general, to derive the star formation history of the universe (Sadat et al. 1998, Madau, Della Valle & Panagia 1998) and pose constraints on the IMF and chemical enrichment of the universe.
Great effort has been spent in this search [Garnavich et al. 1998, Perlmutter et al. 1998] and many SNe have been found up to a redshift of [Aldering 1998] when the universe had only about half of its present age. The HDF images [Williams et al. 1996] are the among the deepest taken to date and in principle could contain SNe up to 3. Two SNe111These two SNe are different objects with respect to the ones reported in this work were actually detected by Gilliland & Phillips (1998) and Gilliland, Nugent & Phillips (1999) by comparing the primary HDF-N data with second-epoch images taken two years after. The primary observations of this field were taken using four optical filters centered at 3000Å (U300), 4500Å (B450), 6060Å (V606) and 8140Å (I814) during a time span of about 10 days in December 1995. Although the distribution of the data along this period is not uniform, the overall time coverage is good enough to detect objects with significant variations on time scales of a few days. High redshift SNe cannot be identified near their maximum in such a short time span because they vary too slowly, but soon after the explosion they evolve fast enough to be detected.
How many SNe can be expected in the HDF-N? This number can be estimated using the computations by Marri & Ferrara (1998) and Marri et al. (1998) for future Next Generation Space Telescope (NGST) surveys. Scaling their results for a flat CDM+ with to the HDF-N area ( 5 sq. arcmin) and assuming a surveying time of days (see below), we obtain an expected number SNe from massive stars (SN types Ib/II). As a comparison, scaling the analytical estimates in Miralda-Escudé & Rees (1997) to the HDF-N, one obtains a similar expected rate of 0.17 SNe in the HDF-N. These values are large enough to encourage a new analysis of the HDF-N.
2 Object selection, photometry and morphology
The original observations of the HDF-N in each filter consisted of about 300 images taken in several (from 9 to 11, depending on the filter) positions on the sky (dither positions). We have divided these images into a few subsequent groups, three for V606 and I814 and two for B450. The U300 band, which is intrinsically less efficient, was not considered. The HDF-N was observed again two years later in U300 and I814 and the latter image (I4 in Table 1) is deep enough to be used for this project.
Where possible, images taken in the same position on the sky were not split into different groups so that we could make effective use of those combined by the HDF working team [Williams et al. 1996] for each dither position, and made available on the web. Some dither positions in V606 and I814 contain images too widely separated in time and therefore have been split. In this case the frames were reduced by the automatic pipeline provided by the ST-ECF web site. In all cases warm and bad pixels were rejected using the standard routines.
Given the small number of images, between 3 and 6, present in some of the final groups, it was not possible to use the drizzle algorithm [Fruchter et al. 1997] often used for the WFPC2 data reduction. We have chosen to resample all the images to a pixel of 0.05 arcsec (half of the original WF pixel scale) and use the IRAF task IMCOMBINE to make the final combinations while rejecting deviant pixels. This procedure is more efficient than drizzle in rejecting any residual warm and bad pixel; this is especially true for the final V606 and I814 images which contain 5 dither images each. Table 1 lists the properties of the resulting images with their time coverage and limit magnitude.
| Filter | Image | Dither pos.222Dither positions as in Williams et al. 1996. When present, A and B refer to the first and second part of the split positions | Exp. time | Time range | Limit3333 limit for point sources | 2-584.2 | |
|---|---|---|---|---|---|---|---|
| (hours) | (days) | Mag | SNR444Signal-to-noise ratio of the photometry | ||||
| F450W | Total | 33.5 | 0.00–9.21 | 29.72 | 28.73 | 5.1 | |
| B1 | 6A+9+4+5+3+8+1+2 | 28.2 | 0.00–3.15 | 29.64 | 28.75 | 7.5 | |
| B2 | 7+6B | 5.3 | 8.34–9.21 | 28.72 | 28.41 | 3.8 | |
| F606W | Total | 30.3 | 1.48–10.07 | 30.07 | 28.78 | 7.2 | |
| V1 | 3+2+6A+4A | 5.6 | 1.48–5.56 | 29.16 | 29.14 | 3.1 | |
| V2 | 9A+5A+7+1+11+10 | 14.7 | 6.43–8.51 | 29.68 | 28.93 | 6.0 | |
| V3 | 8+6B+4B+9B+5B | 10.0 | 8.57–10.07 | 29.47 | 28.53 | 7.2 | |
| F814W | Total | 34.3 | 3.21–10.10 | 29.46 | 28.63 | 4.8 | |
| I1 | 2+1+6 | 10.0 | 3.21–4.35 | 28.80 | 28.80 | 2.8 | |
| I2 | 4A+9+3+5A | 14.5 | 4.69–6.30 | 29.00 | 28.76 | 3.8 | |
| I3 | 8+7+11+4B+5B | 9.8 | 6.63–10.10 | 28.79 | 28.05 | 6.0 | |
| I4 | 15.6 | 735–738 | 29.00 | 29.00 | 2.9 | ||
Two tests were performed to check the data reduction results: i) the flux of a few compact sources from the list in Méndez et al. (1996) was measured in each of the resulting images to verify the constancy of the photometry; ii) as discussed, for example, in Ferguson (1998), the effective limiting magnitude depends on the object size as much as on its total magnitude. The detection limits for point sources in the images were measured by adding stars and detecting them using FOCAS [Valdes 1982]: the derived values for the 80% completeness level are in good agreement (within 0.1 mag) with the values in Williams et al. (1996) once their 10 limits in an aperture of 0.5 arcsec are scaled for the exposure time and to about 3 in 0.30 arcsec, an aperture yielding the highest SNR for point source photometry (eg., Thompson 1995). These values are listed in Table 1; all magnitudes are in the AB system.
The three combined V606 images (V1, V2 and V3), showing the best sensitivity (3 limits between 29.1 and 29.7) and time coverage (about 8.5 days), were examined for variable objects having a monotonic trend, either brightening or dimming. A few interesting objects were selected; the most remarkable one is in chip 2 of the WF camera and is present in the Williams et al. (1996) catalog with the entry number 584.2. The J2000 coordinates of this object (2-584.2) are 12:36:49.357 +62:14:37.50. In the total images, this object has flat B450, V606 and I814 colors and is undetected in U300; however it cannot be classified as a U300 drop-out being too faint to show a strong enough break between U300 and B450.
Table 1 and Fig. 1 show the time evolution of the photometry of 2-584.2. Its magnitudes in the various images were measured inside a circular aperture of 0.3 arcsec, corresponding to about twice the PSF FWHM, and corrected to an infinite aperture. This object shows a strong brightening both in V606 and I814, while the photometry in the B450 band is consistent with a constant value. The errors shown in Fig. 2 are derived under the assumption of Poisson noise inside the photometric aperture.

We have computed the statistical significance of the detected variation. For the V606 band we consider the two differences V2–V1 and V3–V2; in the I814 band, as the object shows no significant variation among I1, I2 and I4, we coadd these three images and compare the result with I3. By comparing the differences in the photometry with the quadratic sum of the errors, we find a joint probability for these three variations to arise from noise of 1.2. In the HDF-N there are about 1200 objects between I814=27 and I814=29 [Williams et al. 1996]; therefore we expect one such spurious event only every 70 Hubble Deep Fields.
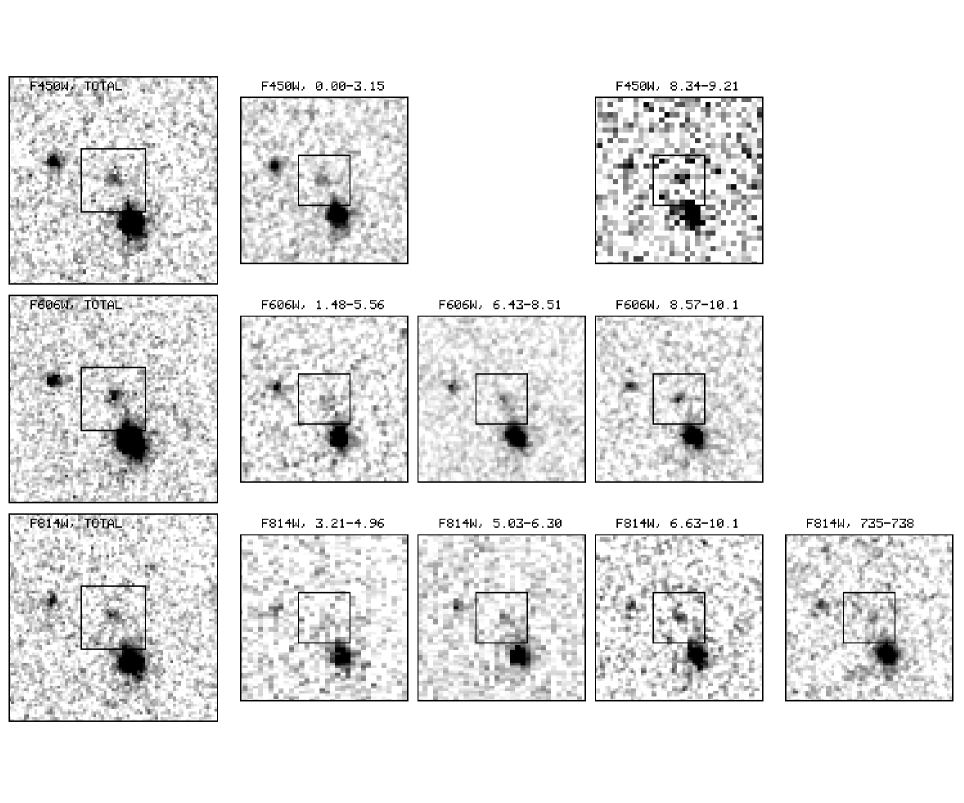
Fig. 2 shows the images of this object in the various bands 555 Images of 2-584.2 can also be found at http://www.arcetri.astro.it/filippo/sn/sn.html and its brightening in V606 and I814. In the total images the object is marginally resolved in B450 and V606, whereas in I814 it is consistent with a point source. The images also give the impression of a sharpening of 2-584.2 with time: the object seems more extended at the beginning of the observations than at the end, as if a bright core were emerging in V606 and I814. Its faintness prevents us from studying its morphology in detail; nevertheless, its extension can be roughly measured by fitting circular gaussians to each image. The results of this procedure supports the visual impression of a sharpening of the object with time: the FWHM of the best-fitting gaussian goes from 033008 to 018002 in V606 and from 040010 to 019002 in I814 while the value expected for point sources is about 015.
3 The light curve
Among the objects that could show variability at this high galactic latitude and faint flux level, AGNs and SNe are the most plausible candidates. The shape of detected time variation and the possible development of a bright core in an underlying galaxy strongly suggest the identification of 2-584.2 with a SN observed soon after its explosion.
The expected evolution of the apparent magnitude of a SN can be derived from template light curves, spectra and absolute magnitude (as discussed below) once its distance is known and K-corrections (due to the narrowing of the filter passband in the restframe of the source and redshifting of the emitted photons from the source to the observer) are computed. For high redshift objects the time in the observer frame, , is related to the time in the supernova rest frame by ; this produces a time dilation of the high redshift SN light curve.
Once the SN template is given, four parameters are left to simultaneously fit the data in the various filters: the SN redshift, , the time of the maximum light, , the color excess due to dust, E(B-V), and the cosmological matter density parameter, (we assume ). Some uncertainty remains associated with this fit as pre-maximum light curves and spectra (particularly in the UV) are generally not very well determined because they are available only for a handful of objects. The SN flux must then be added to the host galaxy flux in each filter. The observed time variation of 2-584.2 shows that the SN becomes quickly dominant in V606 and I814 while the galaxy produces most of the B450 flux.
We now consider in turn the possibility that the detected variable source is a Type Ia (SNIa), a Type II (SNII) or a Type Ib (SNIb) supernova. SNIa have been shown to be reliable standard candles, as their intrinsic luminosities can be accurately determined [Phillips 1993]. Pre-maximum optical (CTIO) and UV (IUE) spectra of SN1990N [Leibundgut 1991], show that the flux drops off sharply below Å; therefore, as soon as , their B450 flux in negligible as the cut off is redshifted into this band, while the mere detection of variation in the V606 band puts the upper limit . The luminosity of a SNIa evolves in time according to a light curve [Leibundgut 1988, Doggett & Branch 1985] which shows a fast rise to the maximum (3.6 mag in 15 days), with slight differences between the (rest frame) B- and V-band. When fitting the data for 2-584.2 with the time-dilated, K-corrected light curves, we find impossible to simultaneously match the V606 and I814 data points (in this case the B450 data only give information on the galaxy magnitude), as shown in Fig. 1. Since the object is relatively faint, this implies high SNIa redshifts () for which colors cannot be reproduced by using appropriate K-corrections. We conclude that identification of 2-584.2 with a SNIa can be safely ruled out.
We repeat the same procedure for SNII. These objects cannot be used as standard candles as their peak abolute luminosities are known to cover a wide range, from to [Patat et al. 1994]. SNII are usually divided into two classes [Doggett & Branch 1985], one (SNII-P) showing a slow pre-maximum brightening and a plateau in the after-maximum decline, the other (SNII-L) a faster brightening and a linear decline. In both cases the pre-maximum spectra can be approximated by a black-body with a temperature K [Kirshner 1990] without any UV cut-off. By comparing the expected light curves with the data (see Fig. 1) we can safely exclude both classes because (i) their brightening is too slow and (ii) their blue spectrum makes them too luminous in B450.
SNIb yield a good agreement with the data. These objects closely resemble SNIa in terms of time evolution and spectra but are typically 1-2 mag fainter [Wheeler & Levreault 1985, Kirshner 1990] and show a larger spread in the maximum brightness. While SNIa are found in all types of galaxies and derive from old stars, the SNIb are only detected near regions of active star formation and their progenitors should be young massive stars. As shown in Figure 1, both the time evolution of 2-584.2 increasing from B450 to V606 to I814 and its apparent magnitudes are easily reproduced by SNIb light curves [Kirshner 1990]: acceptable fits can be obtained for which makes this object one of the most distant SN observed to date, while the best agreement is found for , = days ( rest-frame days after the end of the observations), low values and moderate reddening E(B-V) [Seaton 1978]. This values of the reddening, corresponding up to about 0.29 mag of extinction in V606 and 0.22 in I814, could also be accounted for by a SNIb fainter than the average and without extinction. Lower values for the fitting redshift tend to select low values of and low extinction, viceversa for higher redshifts. The galaxy, showing flat B450-V606 and V606-I814 colors and luminosites indicating a SFR of about 0.2 M⊙/yr [Madau et al. 1998], is consistent with a star forming dwarf. About 20% of the flux in the I814 image taken two year later (I4) is still due to the SN.
We therefore conclude that: (i) SNIa are too bright and red and SNII are too slow and blue to be viable candidates for 2-584.2; (ii) a SNIb naturally reproduces the time evolution, brightness and colors of the variable object. This type of study, when applied to high sensitivity, long time span future observations, could produce a significant sample of high- SNe that can be succesfully used to constrain the star formation history and the geometry of our universe.
Acknowledgments
We are indebted to P. Hoeflich and B. Leibundgut for providing
supernova spectra and light curves, and to R. McCray, M. Salvati, L.
Pozzetti and N. Panagia for useful discussions.
We also thank the referee, R. Ellis, for insightful comments.
We thank STScI/ST-ECF for the implementation of their data
archive and for support during this work.
FM acknowledges a partial support from ASI grant ARS-96-66;
AF acknowledges partial support as a Visiting Fellow at JILA.
References
- [Aldering 1998] Aldering, G., 1998, IAU Circ. 7046
- [Ciardi & Ferrara 1997] Ciardi, B., & Ferrara, A. 1997, ApJ, 483, L5
- [Couchman & Rees 1986] Couchman, H. M. P. & Rees, M. J. 1986, MNRAS, 221, 53
- [Doggett & Branch 1985] Doggett, J. D. & Branch, D. 1985, AJ 90, 2303
- [Ferguson 1998] Ferguson, H. C. 1998, STSci May Symposium ”The Hubble Deep Field”, astro-ph/9801058
- [Ferrara 1998] Ferrara, A. 1998, ApJ, 499, L17
- [Garnavich et al. 1998] Garnavich, P. et al. 1998, ApJ 493, L53
- [Gilliland, Nugent & Phillips 1999] Gilliland, R. L., Nugent, P. E., & Phillips, M. M., 1999 astro-ph/9903229
- [Gilliland & Phillips 1998] Gilliland, R. L., & Phillips, M. M., 1998 IAU Circ. 6810
- [Haiman et al. 1997] Haiman, Z., Rees, M. J., & Loeb, A. 1997, ApJ, 484, 985
- [Fruchter et al. 1997] Fruchter, A. S., Hook, R. N., Busko, I. C., & Mutchier, M. 1997, The 1997 HST Calibration Workshop with a new generation of instruments, S. Casertano, R. Jedrzejewski, C. D. Keyes, and M. Stevens eds. Baltimore, Space Telescope Science Institute (1997) QB 500.268 C35, 518
- [Kirshner 1990] Kirshner, R. P. 1990, in ”Supernovae”, ed. A. G. Petschek, (Springer: New York), 59
- [Leibundgut 1988] Leibundgut, B, 1988, PhD Thesis, University of Basel
- [Leibundgut 1991] Leibundgut, B., et al. 1991, ApJ 371 L23
- [Madau et al. 1998] Madau, P., Pozzetti, L., and Dickinson, M., 1989, ApJ 498 106
- [1] Madau, P., Della Valle, M., Panagia, N., 1998, MNRAS 297, 17P
- [Marri & Ferrara 1998] Marri, S., & Ferrara, A. 1998, ApJ, in press (astro-ph/9806053)
- [Marri et al. 1998] Marri, S., Ferrara, A. & Pozzetti, L. 1998, ApJ, submitted
- [Miralda & Rees 1997] Miralda-Escudé, J. & Rees, M. J. 1997, ApJ 478, L57
- [Méndez et al. 1996] Méndez, R.A., Minniti, D., De Marchi, G., Baker, A., & Couch, W.J. 1996, MNRAS 283, 666
- [Patat et al. 1994] Patat, F., Barbon, R., Cappellaro, E. & Turatto, M. 1994, å282, 731
- [Perlmutter et al. 1998] Perlmutter, S., et al. 1998, Nature 391, 51
- [Phillips 1993] Phillips, M. M. 1993 ApJ 413, L105
- [2] Sadat, R., Blanchard, A., Guiderdoni, B. & Silk, J. 1998, å331, L69
- [Seaton 1978] Seaton, M., J. 1979, MNRAS 187, 73P
- [Thompson 1995] Thompson D., 1995, PhD. Thesis, Caltech.
- [Tegmark et al. 1995] Tegmark, M., Silk, J., Rees, M.J., Blanchard, A., Abel, T. & Palla, F. 1997, ApJ, 474, 1
- [Valdes 1982] Valdes, F. 1982 KPNO Internal Publication
- [Wheeler & Levreault 1985] Wheeler, J. C., Levreault, R., 1985, ApJ 294, L17
- [Williams et al. 1996] Williams, R.E. et al. 1996, AJ 112, 1335