An X-ray Selected Galaxy Cluster at 11affiliation: Based in part on observations obtained at the W.M. Keck Observatory 22affiliation: Based in part on observations obtained at the Kitt Peak National Observatory
Abstract
We report the discovery of an X-ray luminous galaxy cluster at . RXJ0848.9+4452 was selected as an X-ray cluster candidate in the ROSAT Deep Cluster Survey, on the basis of its spatial extent. Deep optical and near-IR imaging have revealed a galaxy overdensity around the peak of the X-ray emission, with a significant excess of red objects with colors typical of elliptical galaxies at . Spectroscopic observations at the Keck II telescope have secured 6 galaxy redshifts in the range (), within a 35 arcsec radius around the peak X–ray emission. This system lies only 4.2 arcmin away ( comoving Mpc, ) from the galaxy cluster ClG J0848+4453, which was identified by Stanford et al. (1997) at in a near-IR field galaxy survey, and is also known to be X-ray luminous. Assuming that the X-ray emission is entirely due to hot intra-cluster gas, both these systems have similar rest frame luminosities ergs s-1 (0.5–2.0 keV band). In combination with our spectrophotometric data for the entire 30 arcmin2 field, this suggests the presence of a superstructure, consisting of two collapsed, possibly virialized clusters, the first detected to date at .
To appear in The Astronomical Journal
1 Introduction
Over the last few years significant progress has been made in the search for distant galaxy clusters as well as in the study of their galaxy populations. The existence of massive, virialized systems at very high redshifts has a direct bearing on theories of structure formation (e.g., Eke et al. 1996). Finding clusters at redshift has become routine in serendipitous searches in the X-ray, based on deep ROSAT-PSPC observations. Near-infrared surveys are now reaching the necessary depth and area to push these searches to redshifts (e.g., Stanford et al. 1997). These studies have provided new constraints on both the evolution of the cluster abundance out to (see Rosati 1998 for a review) and the evolution of early-type galaxies over a substantial look-back time (e.g., Stanford 1998).
The study of the spectrophotometric properties of cluster galaxies at large redshifts provides a powerful means of discriminating between scenarios for the formation of elliptical galaxies. Predictions of the color-magnitude distribution of cluster early-types based on hierarchical models of galaxy formation (Kauffmann 1996; Kauffmann & Charlot 1998) differ at from models in which ellipticals formed at high- in a monolithic collapse (Eggen et al. 1962). This is the result of different star formation histories predicted in the two scenarios. In the former, star formation activity is modulated by interactions and merging up to relatively late times, whereas in the single burst scenario the original stellar population evolves passively for a large fraction of the Hubble time. The evolution of the IR-optical colors, the slope of the color-magnitude relation, and the amount of its scatter are important diagnostics for constraining the mode and epoch of formation of the E/S0 galaxies (Bower, Lucey, & Ellis 1992; Kodama & Arimoto 1997; Ellis et al. 1997; Stanford, Eisenhardt, & Dickinson 1998). All these studies, which to date have mainly concentrated on clusters at , suggest that early-type galaxies form at , with a high degree of synchronism in their initial epoch of star formation activity. Identifying clusters at provides a valuable sample of galaxies at early cosmic epoch. The rest frame ultraviolet spectra can be used to age date the stellar populations, providing another measure of the formation epoch of early-type galaxies (e.g., Dunlop et al. 1996; Spinrad et al. 1997).
Near-infrared imaging is essential at these large redshifts to compensate the k-correction which significantly dims the dominant population of early-type cluster galaxies at observed optical wavelengths. Stanford et al. 1997 (hereafter S97) have shown that optical-infrared colors can be used to considerably enhance the contrast of the cluster galaxies against the field galaxy population and, at the same time, to estimate the cluster redshift. By using this method S97 detected a red clump of galaxies with a narrow color distribution in a field galaxy survey covering arcmin2 (Elston et al. 1999). Follow-up spectroscopy with the Keck telescope secured 10 galaxy redshifts at with a velocity dispersion of km/s. An a posteriori analysis of a deep ROSAT-PSPC archival pointing revealed a corresponding low-surface brightness X-ray emission at the cluster position, most likely the result of hot intra-cluster gas with an X-ray luminosity of , i.e. typical of a moderately rich cluster. This system, ClG J0848+4453, is currently the most distant X-ray emitting cluster found serendipitously in a field survey. Targeted searches for clusters around high-redshift AGN have led to several positive identifications (e.g., Crawford & Fabian 1996; Pascarelle et al. 1996; Dickinson 1997; Hall & Green 1998). Follow-up deep ROSAT imaging has also revealed the existence of diffuse X-ray emission around several 3CR sources out to (Dickinson et al. 1999). The rarity of powerful radio galaxies, however, make these studies unsuitable for assessing the cluster abundance, and perhaps unrepresentative of normal cluster environments.
X-ray imaging is also a well established method to search for bona-fide distant clusters (e.g., Gioia et al. 1990, Gioia & Luppino, 1994). With the advent of the ROSAT-PSPC, with its unprecedented sensitivity and spatial resolution, archival searches for extended X-ray sources have become a very efficient method to construct large, homogeneous samples of galaxy clusters out to at least (e.g., Rosati et al. 1995, 1998; Scharf et al. 1997; Collins et al. 1997; Vihklinin et al. 1998). The ROSAT Deep Cluster Survey (RDCS) (Rosati et al. 1998 (R98)), has shown no evidence of a decline in the space density of galaxy clusters of X-ray luminosity over a wide redshift range, . The fact that the bulk of the X-ray cluster population is not evolving significantly out to this large redshift increases the chances of finding clusters beyond redshift one, since clusters ( in the [0.5-2.0] keV band, roughly the Coma cluster) can be detected at as extended X-ray sources in deep ROSAT pointed observations, provided that the X-ray surface brightness profile does not evolve significantly (see also Hasinger et al. 1999).
To improve the success rate of identifying very high redshift clusters from deep X-ray surveys, we have begun a program of near-IR imaging of unidentified faint candidates in the RDCS. In this paper, we describe the imaging and spectroscopic follow-up observations of the first of these X-ray faint candidates, RXJ0848.9+4452, which has led to the discovery of a cluster at . The corresponding X-ray source is located in the same PSPC field (the “Lynx field”) as the cluster discovered by S97, and lies only 4.2 arcmin away from ClG J0848+4453 at . By combining these new data with the spectrophotometric data of S97, we find strong evidence for the existence of a superstructure at consisting of two collapsed, possibly virialized clusters. Unless otherwise stated, we adopt the parameters km s-1 Mpc-1, .
2 The X-ray Selection and Analysis
The RDCS was designed to compile a large, X-ray flux-limited sample of galaxy clusters, selected via a serendipitous search for extended X-ray sources in ROSAT-PSPC deep pointed observations (Rosati et al. 1995, 1998). The depth and the solid angle of the survey were chosen to probe an adequate range of X-ray luminosities over a large redshift baseline. Approximately 160 candidates were selected down to the flux limit of (where ), over a total area of 50 deg2, using a wavelet-based detection technique. This technique is particularly efficient in discriminating between point-like and extended, low surface brightness sources (Rosati et al. 1995).
Optical follow-up observations for the cluster candidates consisted primarily of optical imaging in the -band, followed by multi-object spectroscopy with 4m class telescopes at NOAO and ESO. To date, more than 100 new clusters or groups have been spectroscopically confirmed, and about a quarter of these lie at . The spectroscopic identification is 85% complete to . To this limiting flux the completeness level and the selection function are well understood. At fainter fluxes the effective sky coverage pregressively decreases. In addition, the X-ray identification becomes more difficult due to the increasing confusion and the low signal-to-noise ratio of the X-ray sources which makes it more difficult to discriminate between point-like and extended sources. Below the completeness level can be as low as 50%. However, it is in these lowest flux bins that the most distant clusters of the survey are expected to lie. If one assumes that the evolutionary trend in the cluster population continues past , the observed X-ray luminosity function, , of R98 can be extrapolated to predict that up to a dozen clusters at remain to be identified in the RDCS, which covers about 15 deg2 at . This prediction conservatively takes into account the evolution of the bright end (), in keeping with the results of Henry et al. (1992), and the survey incompleteness near the flux limit.
To date, moderately deep -band imaging of several candidates with has shown only marginally significant galaxy overdensities in the best cases. Some of these candidates could be X-ray sources of a different nature, rather than galaxy clusters. To increase the efficiency of cluster identification, we have initiated a program of and -band imaging of these faint unidentified candidates in the deepest archival fields of the RDCS. The Lynx field, centered at (J2000), was observed for 64.3 ksec with the PSPC in two pointings (rp90009A00,A01). The X-ray data were processed as described in Rosati et al. 1995. The object detection and classification yielded 3 cluster candidates in the central area of the detector () (see Table 1). The brightest one was identified as a cluster at , using the CryoCam spectrograph at the KPNO 4m telescope. A 1200 second band image of the two faint remaining candidates, obtained at the KPNO 4m prime focus, failed to show a strong enhancement in the projected galaxy density at either of the peaks of the X-ray emission.
A 28 arcmin2 region in the Lynx field was also part of a deep multicolor optical-IR survey by Elston et al. (1999). The faintest source in Table 1, RXJ0848.6+4453, was identified by S97 as the X-ray counterpart of ClG J0848+4453 at . In the following, we will focus on RXJ0848.9+4452, the cluster candidate which lies at the extreme southeast corner of the Lynx field in the Elston et al. near-IR survey.
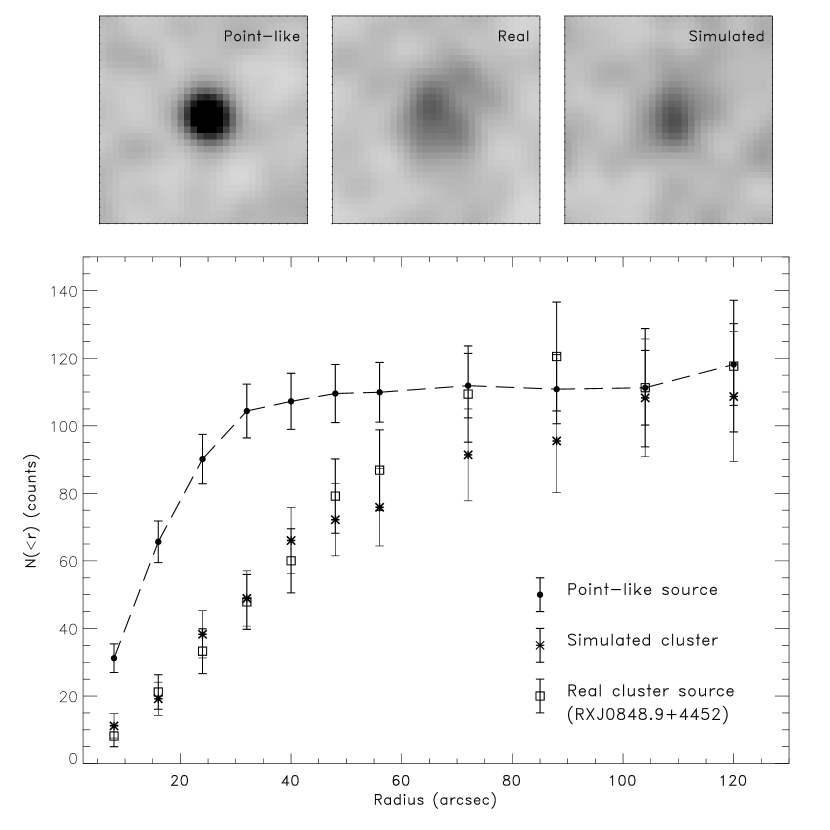
In Figure 1, we show a comparison between the bidimensional and radial cumulative X-ray surface brightness of RXJ0848.9+4452 with a nearby point-like source scaled down by a factor 1.8 to account for the flux ratio of the two sources. The latter is located 2 arcmin north () and has been identified as a QSO at in spectroscopic observations carried out at the KPNO 4m telescope. We use this point-like source to register the PSPC X-ray image onto the optical images. This resulted in a 10″ shift from the nominal position, which is not unusual for aspect solution errors of the PSPC. The statistical residual error in the position of the X-ray centroid is about 5″ . The conversion factor from counts to unabsorbed X-ray flux was calculated using the galactic HI column density in the Lynx field, , and assuming a thermal spectrum with keV for the source. The source counts are integrated over an aperture of Mpc radius. This aperture encircles of the total flux for the profile parameters given below.
The first and second top panels in Figure 1 are cut-outs extracted from the PSPC image in the [0.5-2.0] keV band with 8″ pixels. The third panel shows a simulated cluster which has been obtained assuming a King profile with core radius of 200 kpc, , and the observed X-ray flux of . The X-ray surface brightness count distribution is then redshifted to and overlaid onto the measured Poissonian background in the Lynx field of 0.37 counts/pixel. This simulation shows that, within the errors due to the low signal-to-noise, typical cluster parameters match the surface brightness distribution of RXJ0848.9+4452. Furthermore, the growth curves show that the cluster candidate source is clearly extended when compared with a nearby point-like source, as also revealed by the statistical characterization provided by the wavelet algorithm (Table 1).
Given the limited resolution of the PSPC and the faintness of the X-ray source, we cannot rule out the possibility from the X-ray properties alone that the X-ray emission is the result of source confusion, or is partially contaminated by one or more AGN. The X-ray spectral information on the X-ray source is very poor, although no emission is detected below 0.5 keV, consistent with a thermal cluster spectrum. As we will discuss below, however, the optical-IR imaging and spectroscopic follow-up observations suggest that the diffuse X-ray emission is most likely due to hot intracluster gas trapped in a gravitationally bound structure.
3 Imaging and Spectroscopy
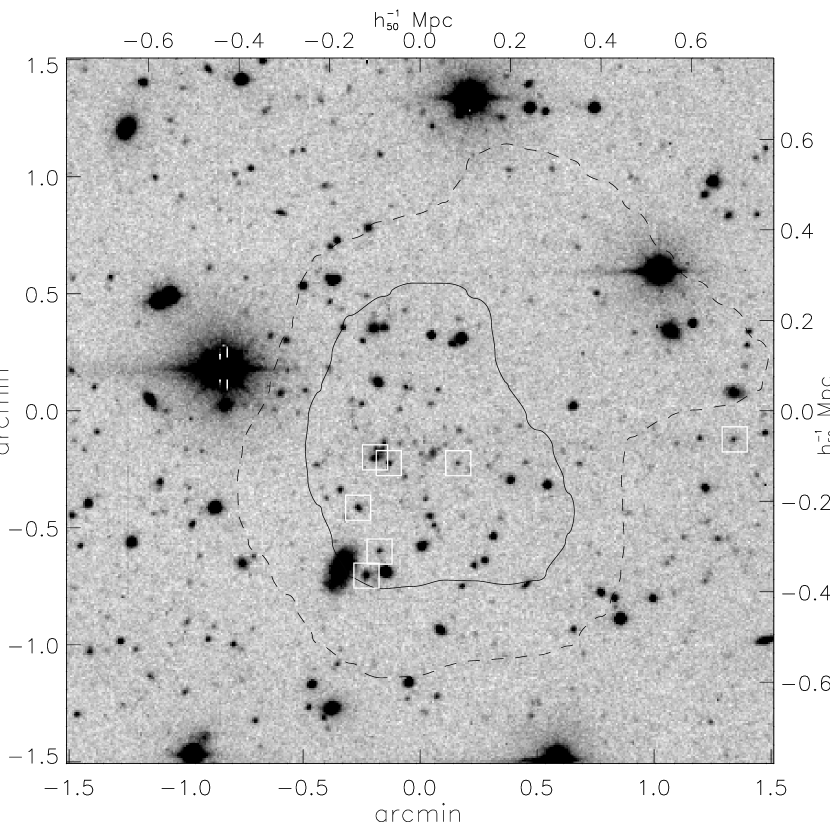
Deep optical imaging of the Lynx field in bands was carried out by Elston et al. (1999) at the 4m telescope of the Kitt Peak National Observatory using the PFCCD/T2KB which covers arcmin with 0.48″ pixels. A deep -band image, taken as part of this survey, is shown in Figure 2 with the X-ray contours overlaid. Although an overdensity of galaxies with is visible around the X-ray peak ( significant above the background counts), optical data alone cannot distinguish between possible cluster galaxies and the field galaxy population.
3.1 Followup IR imaging
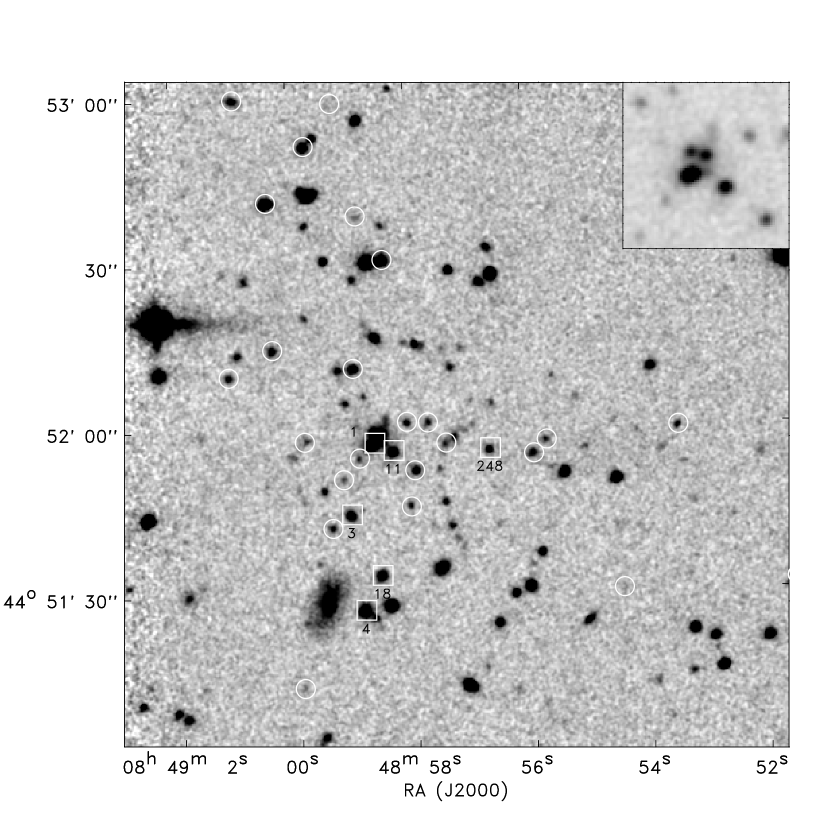
Since the area around RXJ0848.9+4452 was only partially covered by the near-IR survey of Elston et al., we obtained and imaging at the Palomar 200” telescope with the Prime-Focus Infrared Camera (Jarrett et al. 1994). This camera provides a 2.1′ field of view with 0.494″ pixels. The source was observed on 23 March 1998 through cirrus and in photometric conditions on 24 March 1998. The flux scale was calibrated using observations of three UKIRT standard stars at similar airmass which bracketed the RXJ0848.9+4452 observations on 24 March 1998. The data were taken using a sequence of dither motions in both axes with a typical amplitude of 15″, and a dwell time between dithers of 40 seconds at and from 15 to 30 seconds at . The data were linearized using an empirically measured linearity curve taken during the observing run, and reduced using DIMSUM111 Deep Infrared Mosaicing Software, a package of IRAF scripts available at ftp://iraf.noao.edu/contrib/dimsumV2. The total integration times and FWHM’s of the resulting images are 3360 s and 1.1” at , and 5600 s and 0.9” at . The image of the RXJ0848.9+4452 field is shown in Figure 3.
A catalog of objects in the -band image was obtained using FOCAS (Valdes et al. 1982), as revised by Adelberger (1996). The -band image was smoothed by a small amount to match the 1.1 arcsec seeing in the -band image. Objects were detected with the requirement that contiguous pixels covering an area of 0.94 arcsec2 must be 3 above the background. All detected objects were inspected visually to eliminate false detections. The catalog is 90% complete to in a 2 arcsec aperture. The catalog was then applied to the band images, which had been geometrically transformed to the -band image, to obtain matched aperture photometry in those bands.
Figure 4 shows the resulting color-magnitude diagrams for all objects in a 2 arcmin2 area around RXJ0848.9+4452. The top panel shows that the color distribution of objects falling within a circular area of 35″ radius, centered on the X-ray source, is significantly skewed toward the red, with a maximum at . This spatial segregation of red objects around the X-ray centroid is more evident in Figure 3, where the objects belonging to the red sequence, , are marked on the band image of the central area. This overdensity of red objects is comparable with that found by S97 around ClG J0848+4453. There are 21 objects with down to which fall within a circular area of radius 60″ around RXJ0848.9+4452, i.e a density of 6.7 arcmin-2, in contrast to the average density of 3.3 arcmin-2 over the entire arcmin2 area of the Elston et al. survey (Eisenhardt et al. 1998). The vs diagram for ClG J0848+4453 is shown for comparison in the bottom panel of Fig. 4. A zeropoint error that results in the colors of ClG J0848+4453 becoming bluer by 0.1 mag was recently discovered in the JK photometry reported in S97. This error has been corrected in the lower panel of Fig. 4.
3.2 Keck Spectroscopy
Spectroscopic observations of selected galaxies in a 2′ region around RXJ0848.9+4452 were obtained using the Low Resolution Imaging Spectrometer (LRIS; Oke et al. 1995) on the Keck II telescope. Objects were assigned slits based on their colors and optical-IR magnitudes. Spectra were obtained using the 400 l mm-1 grating which is blazed at 8500Å, covering the Å region. The dispersion of 1.8 Å pixel-1 resulted in a spectral resolution of 9 Å as measured by the FWHM of emission lines in arc lamp spectra. Usually each mask was observed for 5-6 1800 s exposures, with small spatial offsets along the long axis of the slitlets. Three slitmasks in the Lynx field were used to obtain spectra on 20-21 January 1998 UT, 18 February 1998 UT, and 28-29 March 1998 UT.
The slitmask data were separated into individual slitlet spectra and then reduced using standard longslit techniques. The exposures for each slitlet were reduced separately and then coadded. One–dimensional spectra were extracted for each of the targeted objects. Wavelength calibration of the 1-D spectra was obtained from arc lamp exposures taken immediately after the object exposures. A relative flux calibration was obtained from a longslit observation of the standard stars HZ 44 and G191B2B (Massey et al. 1988, 1990) with the 400 l mm-1 grating. While these spectra do not straightforwardly yield an absolute flux calibration of the slit mask data, the relative calibration of the spectral shapes is accurate.
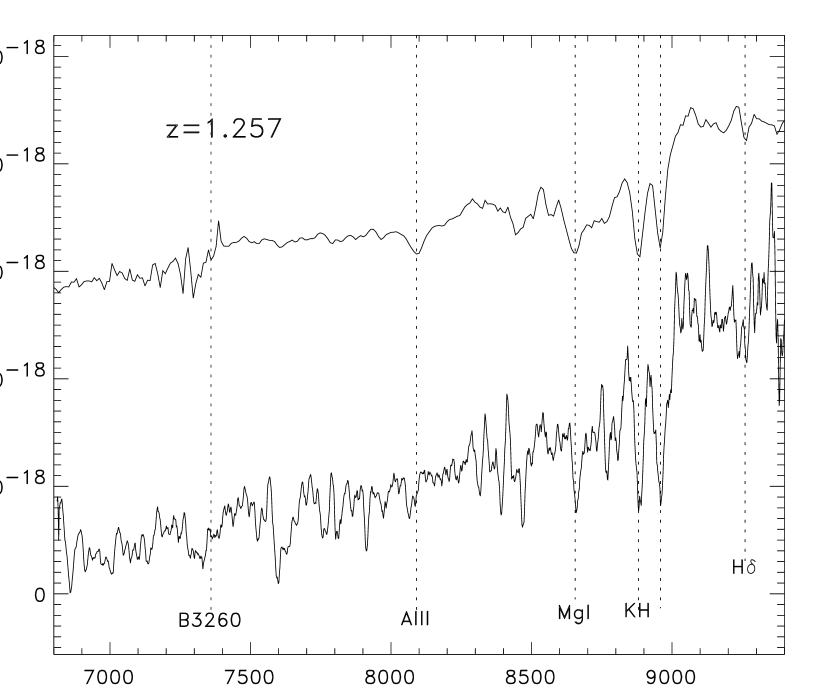
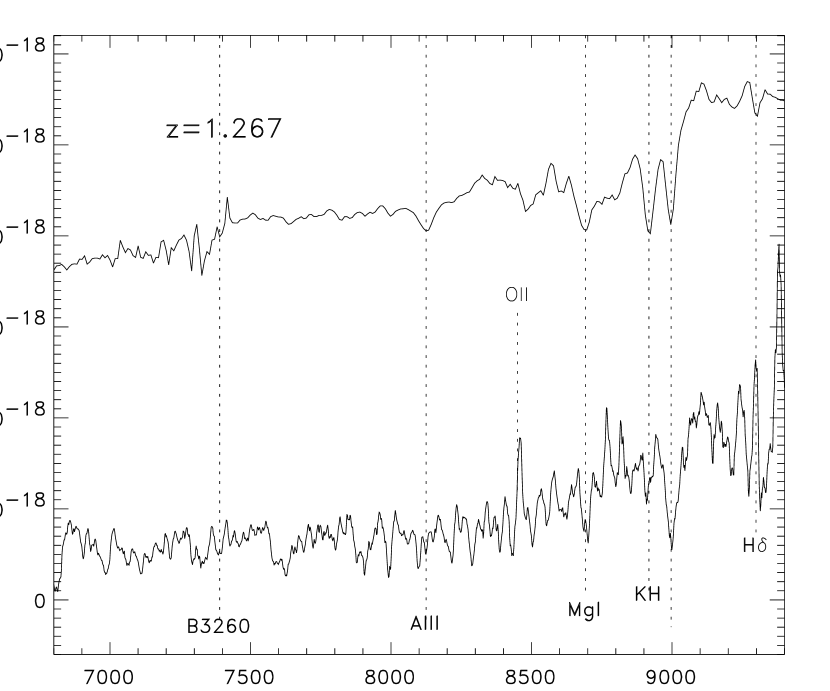
Redshifts were calculated by cross-correlating the spectra with an E template from Kinney et al. (1996) using the IRAF Package RVSAO/XCSAO (Kurtz et al. 1991). The redshift measurement was based on matching major absorption features, such as Ca II H+K, Mg I 3830 and 2852, and Mg II . The cross correlation is also sensitive to spectral breaks such as D4000 and B2900. Only one object (ID #4) shows weak [OII] emission, and the remaining galaxies have spectra similar to the local E template. Two examples of spectra (ID #1,#4), rebinned by a factor of 9, are shown in Figure 5.
Five galaxies were found to have redshifts in the range (an additional galaxy, ID #248, has a less certain redshift), i.e. a relative velocity km/s. This range covers twice the velocity dispersion estimated by S97 for ClG J0848+4453.
4 Discussion
The spectrophotometric properties of all the targets around RXJ0848.6+4453 are summarized in Table 2. Two additional galaxies (not listed in the Table, one visible in fig. 2) found by S97 at and lie within 2′ of the central condensation (marked by object #1). Our spectrophotometric data, combined with the evidence of a significant enhancement in the density of red galaxies against the field, coinciding with the diffuse X-ray emission, strongly suggest the presence of a gravitationally bound structure at . Assuming that the X-ray emission is not contaminated by faint AGN and is entirely due to hot intra-cluster gas trapped in the potential well of this structure, we obtain an X-ray luminosity of in the rest frame [0.5–2.0] keV band (the k-correction amounts to 1.25 for a thermal spectrum at keV), typical of a moderately rich cluster.
4.1 A Superstructure at
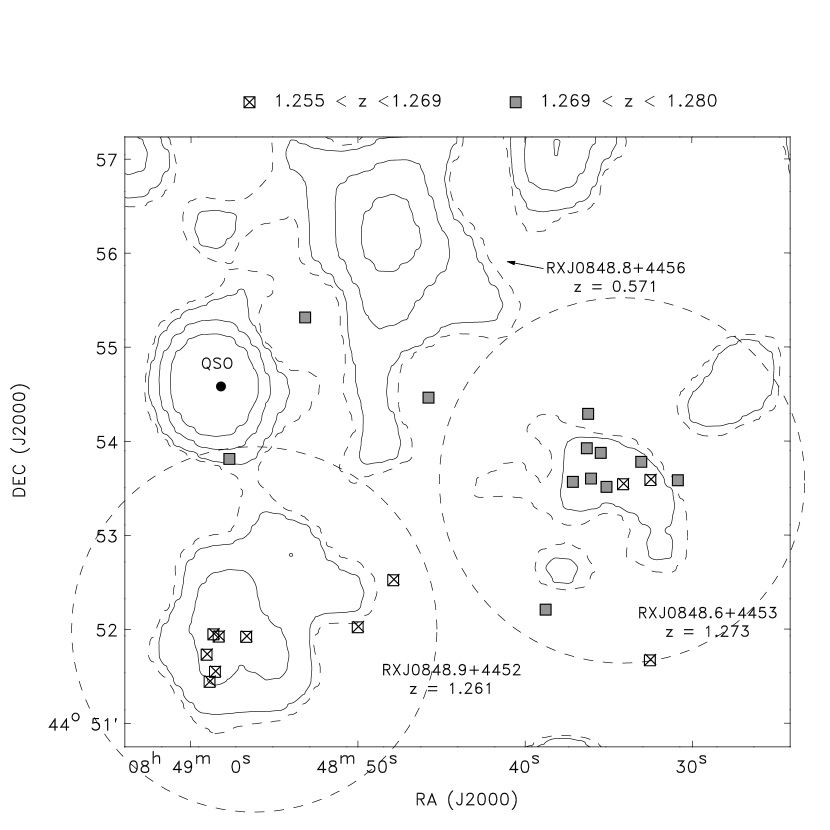
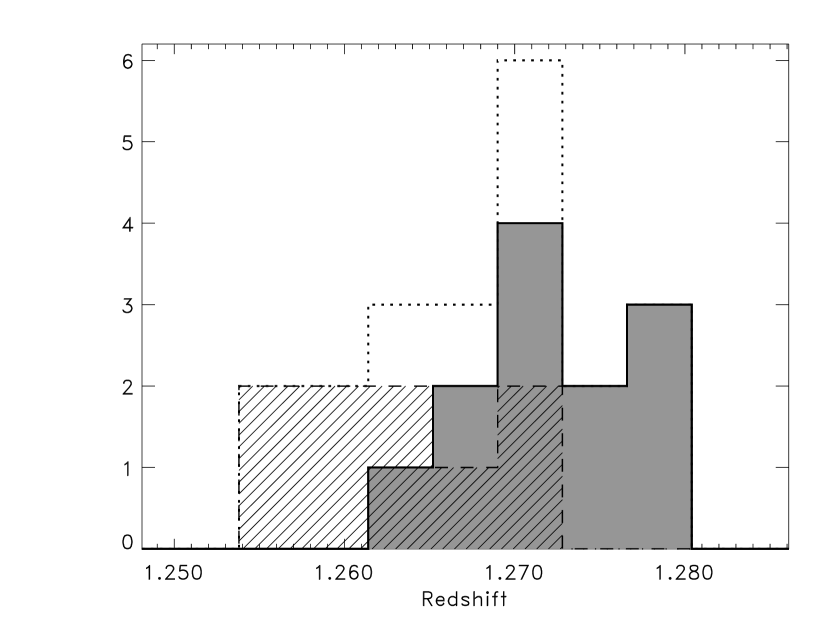
We show in Figure 6 a map of the identified X-ray sources in a 40 arcmin2 area of the Lynx field, as well as the galaxies with spectroscopic redshifts in the range , which include the spectroscopic data presented by S97. A composite image of the same area is shown in Fig. 7. The redshift histogram of all the spectroscopic members in the two clusters is shown in Figure 8. RXJ0848.9+4452 lies only 4.2′ away from ClG J0848+4453 (alias RXJ0848.6+4453), i.e. at a projected physical distance of Mpc at that redshift ( comoving Mpc). These data provide evidence for the presence of a superstructure at consisting of two collapsed systems, which are likely in an advanced dynamical state, considering that X-ray emitting gas had the time to thermalize in their potential wells.
Inspection of Figure 6 also shows some evidence of a kinematical segregation of the spectroscopic members in the two systems, which requires confirmation with additional spectroscopy. A relative radial velocity of km/s has been found in similar X-ray clusters pairs found at (Hughes et al. 1995, Connolly et al. 1996) and in the RDCS at lower redshifts.
The X-ray properties of the two systems are similar, although the new cluster has an X-ray luminosity about twice that of ClG J0848+4453 (Table 1). If the estimate of the X-ray fluxes are not affected by source confusion, the higher X-ray luminosity of RXJ0848.9+4452, together with its near-IR appearance showing a more compact distribution of red galaxies compared with its companion, suggests that it may be in a more advanced dynamical state. Detailed analysis of the morphology of the X-ray emission is not possible with the current ROSAT-PSPC data and signal-to-noise. A deep ACIS exposure scheduled with AXAF in A01 will be able to unambiguously establish the presence of X-ray emitting gas, characterize the thermal state of these two clusters, and permit a measurement of the gas temperatures and metal abundances. Without these additional data it is difficult to obtain a reliable estimate of the cluster mass. Using a larger number of spectroscopic members, S97 estimated the velocity dispersion of ClG J0848+4453 to be km/s, which translates into a mass . If the mass of RXJ0848.9+4452 is not less than the latter (based on its higher ), one would conclude that the mass of the supercluster is . This estimate is very uncertain however, because we do not know the virialization state of the two systems.
The existence of a superstructure at such large look-back times, when compared with recent results of strong clustering of galaxies at much higher redshift (Steidel et al. 1997), can provide some clues on the epoch of cluster formation. Strong concentrations of Lyman break galaxies (LBG) are now found to be ubiquitous in the field at (Steidel et al. 1998a), with one prominent peak in the redshift distribution every arcmin2 (Steidel et al. 1998a; Giavalisco, private communication). Galaxies belonging to these peaks are not spatially concentrated on the sky and hence are believed to be non-virialized structures prior to collapse. Using the effective survey volume of the LBG survey (Steidel et al. 1998b), we can then estimate the comoving space density of these concentrations at to be and for and 1 respectively (). The comoving volume explored by our X-ray cluster search in the Lynx field (0.2 deg2) for clusters of is and thus, it is reasonable to argue that the cluster pair we have identified at is the evolved version of two (or more) LBG concentrations at , well after the collapse, and possibly in the process of merging. Several clusters identified at in the RDCS or other X-ray surveys (e.g., Gioia et al. 1998) show a filamentary structure, often with two cores (both in optical and X-ray) separated by approximately 1 Mpc comoving. By comparing the space density of LBG concentrations with the local cluster abundance, Steidel et al. (1997), and Governato et al. (1998) on more quantitative grounds, have argued that these high redshift concentrations are likely the progenitors of local rich clusters. In this respect, we note that the space density of local X-ray clusters more luminous than the Lynx clusters is (e.g., Ebeling et al. 1997).
4.2 The cluster galaxy population
The color-magnitude diagrams in Figure 4 show the presence of a red envelope which in lower clusters is dominated by early-type galaxies (SED98). Also plotted in the panels are estimates of the no–evolution color–magnitude locus for early–type galaxies. The dashed lines were calculated as described in SED98 using photometry of early–type galaxies from a dataset covering the central 1 Mpc of the Coma cluster (Eisenhardt et al. 1999). These data enable us to determine, by interpolation, the colors that Coma galaxies would appear to have if the cluster could be placed at and observed through the filters used on RXJ0848.9+4452. The same physical apertures were used to measure colors in Coma and in the two distant clusters.
The colors of the spectroscopic members are broadly similar to those member galaxies in ClG J0848+4453, with the exception of ID#3 which is considerably bluer in the observed colors. As discussed in S97, the optical-IR colors are consistent with a passively evolving elliptical model constructed from a 0.1 Gyr burst population with solar metallicity and a Salpeter IMF formed at for , . The colors of the red sequences as well as the spectral energy distributions of the galaxies in the two clusters are also similar, as would be expected if the constituent stellar populations formed at such high redshifts with little subsequent activity either due to merging or starbursts.
To more fully address the evolution of galaxy popoulations at these high redshifts, a larger sample of member galaxies which is complete to a given K-band magnitude is needed, along with morphological information. This would extend the sample to include bluer, star-forming galaxies which are found to be numerous in clusters at (Postman et al. 1998), and which are within reach of optical and near-IR spectrometers on 8-10m class telescopes.
5 Conclusions
Near-infrared imaging of a faint extended X-ray source (RXJ0848.9+4452) detected in a deep ROSAT-PSPC observation of the Lynx field has revealed a significant overdensity of red objects with and colors typical of ellipticals at . Spectroscopic observations with Keck-LRIS have secured redshifts for 6 galaxies in the range within a 35″ radius region around the peak of the X-ray emission. These data indicate the presence of a moderately rich galaxy cluster at with rest frame X-ray luminosity ergs s-1 (0.5–2.0 keV band). RXJ0848.9+4452 is the highest redshift X-ray selected cluster found to date.
An interesting circumstance is that this system lies only 4.2 arcmin away from ClG J0848+4453, an IR-selected cluster previously discovered by Stanford et al. (1997) at , also known to be X-ray luminous with half the of RXJ0848.9+4452. Ten spectroscopic members are known to date in ClG J0848+4453 and several others have been found in a 28 arcmin2 field surrounding these two systems. We therefore find evidence of a high redshift superstructure, consisting of two separate systems, in an advanced stage of collapse as elucidated by the X-ray data. The two cluster cores are separated by comoving Mpc. Furthermore, the redshift distribution of all the spectroscopic members suggests a velocity difference between the two clusters km/s, leading us to speculate that these systems are in the process of merging.
The member galaxies in the two clusters form a homogeneous population with similar colors, the difference in the median value of being less than 0.05 mag. This supports the conclusion of S97 and SED98 who found that the spectrophotometric properties of these red galaxies are consistent with passively-evolving ellipticals formed at high redshift.
This work shows that the combination of near-IR imaging and the X-ray selection from deep X-ray pointings can lead to the identification of bona-fide clusters at . The additional advantage of this approach is that the X-ray selection allows the search volume to be estimated and thus the cluster space density to be effectively evaluated, along with the cluster mass function once the cluster mass is measured. The current limitation of this approach is due to the limited resolution and sensitivity of current X-ray observations which require pushing these studies to flux levels where confusion becomes important and the effective sky coverage becomes very small. With the advent of AXAF and XMM, the use of this strategy for cluster searches at promises to be extremely effective, possibly with a success rate of identification as high as the one obtained with the ROSAT-PSPC at . A census of galaxy clusters at will be a major breakthrough toward our understanding of the formation of both clusters and their constituent galaxy populations.
References
- (1)
- (2) Adelberger, K. 1996, personal communication
- (3)
- (4) Bower, R., Lucey, J.R., & Ellis, R.S. 1992, MNRAS, 254, 589
- (5)
- (6) Collins, C.A., Burke, D.J., Romer, A.K., Sharples, R.M., & Nichol, R.C. 1997, ApJ, 479, L11
- (7)
- (8) Connolly, A. et al. 1996, ApJ, 473, L69
- (9)
- (10) Crawford, C.S. & Fabian, A.C. 1996, MNRAS, 282, 1483
- (11)
- (12) Dickinson, M. 1997, in “The Hubble Space Telescope and the high redshift universe”, eds. N.R. Tanvir, A. Aragón–Salamanca & J.V. Wall, (Singapore: World Scientific), p. 207
- (13)
- (14) Dickinson, M., Mushotzky R.F., Spinrad, H., McCarthy, P.J., & van Breugel, W. 1999, ApJ, submitted
- (15)
- (16) Dunlop, J., Peacock, J., Spinrad, H., Dey, A., Jimenez, R., Stern, D., Windhorst, R. 1996, Nature, 381, 581
- (17)
- (18) Ebeling, H., Edge, A.C., Fabian, A.C., Allen, S.W., Craford, C.S, & Böhringer H. 1997, 479, L101
- (19)
- (20) Eggen, O.J., Lynden-Bell, D., Sandage, A.R. 1962, ApJ, 136, 748
- (21)
- (22) Eisenhardt, P., Elston, R., Stanford, S.A., Dickinson, M., Spinrad, H., Stern, D., and Dey, A. 1998, in ”The Birth of Galaxies,” Proceedings of the Xth Recontres de Blois, eds. B. Guiderdoni et al., Paris: Editions Frontieres, in press
- (23)
- (24) Eisenhardt, P.R. et al. 1999, in preparation
- (25)
- (26) Ellis, R.S., Smail, I., Dressler, A., Couch, W.J., Oemler, A., Butcher, H., & Sharples, R.M. 1997, ApJ, 483, 582
- (27)
- (28) Elston, R., Eisenhardt, P.R., & Stanford, S.A. 1999, in preparation
- (29)
- (30) Eke, V.R., Cole, S., & Frenk, C.S. 1996, MNRAS, 282, 263
- (31)
- (32) Gioia, I.M., Henry, J.P., Maccacaro, T., Morris, S.L., Stocke, J.T., & Wolter, A. 1990, ApJ, 356, L35
- (33)
- (34) Gioia, I.M. & Luppino, G.A. 1994, ApJS, 94, 583
- (35)
- (36) Gioia, I.M. 1998, in Looking Deep in the Southern Sky, eds. R. Morganti, W.J. Couch, 181
- (37)
- (38) Governato, F. et al. Nature, 392, 359
- (39)
- (40) Hasinger et al. 1999, A&A Letters, in press (astro-ph/9810347)
- (41)
- (42) Hall, P.B & Green, R.F. 1998, ApJ, 507, 558
- (43)
- (44) Henry, J.P., Gioia, I.M., Maccacaro, T., Morris, S.L., Stocke, J.T., & Wolter A. 1992, ApJ, 386, 408
- (45)
- (46) Hughes, J.P., Birkinshaw, M., Huchra, J.P. 1995 ApJ, 448, L93
- (47)
- (48) Jarrett, T.H., Beichman, C.A., Van Buren, D., Gautier, N., Jorquera, C., & Bruce, C. 1994, ExA 3, 133
- (49)
- (50) Kauffmann, G. 1996, MNRAS, 281, 487
- (51)
- (52) Kauffmann, G. & Charlot, S. 1998, MNRAS, 297, 23
- (53)
- (54) Kinney, A., Calzetti, D., Bohlin, R.C., McQuade, K., Storchi-Bergmann, T., & Henrique, R. 1996, ApJ, 467, 38
- (55)
- (56) Kodama, T. & Arimoto, N. 1997, MNRAS, 320, 41
- (57)
- (58) Kurtz, M.J. et al. 1991, in Astronomical Data Analysis Software and Systems I, ASP Conf.Ser., eds. D.M.Worrall, C.Biemesderfer, and J.Barnes, 25, 432
- (59)
- (60) Massey, P., Strobel, K., Barnes, J.V., & Anderson, E. 1988, ApJ, 328, 315
- (61) Massey, P. & Gronwall, C. 1990, ApJ, 358, 344
- (62)
- (63) Oke, J.B. et al. 1995, PASP, 107, 3750
- (64)
- (65) Pascarelle, S.M., Windhorst, R.A., Driver, S.P., Ostrander, E.J., & Keel, W.C. 1996, ApJ, 456, 21
- (66)
- (67) Postman, M., Lubin, L.M., Oke, J.B. 1998, AJ, 560, 116
- (68)
- (69) Rosati, P., Della Ceca, R., Burg, R., Norman, C., & Giacconi, R. 1995, ApJ, 445, L11
- (70)
- (71) Rosati P., Della Ceca R., Norman C., & Giacconi R. 1998, ApJ, 492, L21 (R98)
- (72)
- (73) Rosati P. 1998, in “Wide Field Surveys in Cosmology”, 219, eds. S.Colombi, Y.Mellier, B.Raban (astro-ph/9810054)
- (74)
- (75) Spinrad, H., Dey, A., Stern, D., Dunlop, J., Peacock, J., Jimenez, R., & Windhorst, R. 1997, ApJ, 484, 581
- (76)
- (77) Scharf, C.A., Jones, L.R., Ebeling H., Perlman, E., Malkan, M., & Wegner, G. 1997, ApJ, 477, 79
- (78)
- (79) Stanford, S.A. 1998, in “The Birth of Galaxies”, Recontres de Blois, ed. B. Guiderdoni
- (80)
- (81) Stanford, S.A., Eisenhardt, P.R., & Dickinson, M. 1998, ApJ, 492, 461 (SED98)
- (82)
- (83) Stanford, S.A., Elston, R., Eisenhardt, P.R., Spinrad, H., Stern, D., & Dey, A. 1997, AJ, 114, 2232 (S97)
- (84)
- (85) Steidel, C.C., Adelberger, K.L., Dickinson, M., Giavalisco, M., Pettini, M., & Kellogg, M. 1997, ApJ, 492, 428
- (86)
- (87) Steidel, C.C., Adelberger, K.L., Giavalisco, M., Dickinson, M., Pettini, M., & Kellogg, M. 1998a, Phil. Trans. R. Soc. Lond. A, in press, (astro-ph/9895267)
- (88)
- (89) Steidel, C.C., Adelberger, K.L., Giavalisco, M., Dickinson, M., & Pettini, M. 1998b, ApJ, in press (astro-ph/9811399)
- (90)
- (91) Valdes, F. 1982, Proc. SPIE, 331, 465
- (92)
- (93) Vikhlinin et al. 1998, ApJ, 498, L21
- (94)

| ROSAT ID | RAaaJ2000 coordinates | DEC | bbOff-axis angle in arcmin | CountsccSource net counts in the [0.5-2.0] keV band | ddUnabsorbed X-ray flux in units of , in the [0.5-2.0] keV band in an aperture of 2′ radius. | eeStatistical significance of the source extent provided by wavelet algorithm | Redshift | ffX-ray luminosity in units of , in the rest frame [0.5-2.0] keV band ( assumed). |
|---|---|---|---|---|---|---|---|---|
| RXJ0848.8+4456 | 08:48:46.9 | +44:56:22 | 7.4 | 3.5 | 0.571 | |||
| RXJ0848.9+4452 | 08:48:56.2 | +44:52:00 | 3.2 | 5.0 | 1.261 | |||
| RXJ0848.6+4453ggalias ClG J0848+4453, Stanford et al. 1997 | 08:48:34.2 | +44:53:35 | 7.5 | 3.0 | 1.273 |
| ID | R.A. | Dec. | ||||||
|---|---|---|---|---|---|---|---|---|
| 1 | 08:48:58.66 | +44:51:57.2 | 1.257 | 0.001 | 16.72 | 1.86 | 4.16 | 5.91 |
| 11 | 08:48:58.33 | +44:51:55.8 | 1.266 | 0.004 | 17.94 | 1.83 | 4.21 | 5.90 |
| 3 | 08:48:59.07 | +44:51:44.3 | 1.261 | 0.003 | 18.38 | 1.60 | 3.64 | 5.10 |
| 18 | 08:48:58.57 | +44:51:33.3 | 1.257 | 0.003 | 18.3 | 1.85 | 4.38 | 6.03 |
| 4 | 08:48:58.87 | +44:51:26.9 | 1.267 | 0.003 | 17.61 | 1.92 | 4.08 | 5.26 |
| 248 | 08:48:55.94 | +44:51:55.1 | 1.254 | 0.005 | 19.25 | 1.67 | 4.37 | 5.60 |
| 20 | 08:49:02.11 | +44:51:09.0 | 0.818 | 0.003 | 18.78 | 1.63 | 3.50 | 4.68 |
| 8 | 08:48:56.03 | +44:51:30.9 | 1.144 | 0.003 | 17.72 | 1.76 | 3.78 | 5.55 |
| 2 | 08:48:57.28 | +44:51:58.2 | 19.09 | 1.60 | 3.02 | 4.06 | ||
| 228 | 08:48:56.68 | +44:51:55.8 | 19.15 | 1.99 | 4.62 | 5.76 |