1 Introduction
All known star formation is thought to occur in molecular clouds. The association of molecular clouds with star formation is so strong that it is generally assumed that wherever there are young stars, one will always be able to find molecular gas, even when there is evidence to the contrary (e.g. the TW Hya association; Rucinski & Krautter 1983). Indeed, when sufficiently sensitive observations are made, the association of star formation with molecular clouds is observed in all environments, galactic or extragalactic. Evidence for star formation in molecular clouds has even been observed as far back as z = 4.7 (Omont et al. 1996), and sensitive new instruments such as the Millimeter Array and the Square Kilometer Array should make it possible to detect star forming molecular clouds at the earliest times.
The general goal of molecular cloud studies is to determine how the interstellar medium produces molecular clouds, especially the Giant Molecular Clouds (GMCs; M M⊙) which are responsible for the vast majority of all star formation, and how the molecular clouds in turn produce stars and clusters. We take the view that once a core within a molecular cloud can no longer support itself against gravity, beginning the inexorable process of collapse into a single star or binary, the study of the molecular gas falls into a different regime. The inexorability of the star formation process also occurs at the GMC level; there is only one GMC of dozens known within about 3 kpc of the Sun with scant evidence of star formation (see §3.3).
We wish to obtain answers to the four fundamental questions below:
1) How do GMCs form?
2) How do single stars (and binaries) form?
3) How do clusters form?
4) What determines the Initial Mass Function (IMF)?
We will begin below by discussing some of the observational progress that has been made in answering the first question. We will deal with the second question only in passing; it will be dealt with extensively by articles in this volume by Shu et al., Lada, Myers, and others. We will address steps leading to the answers to the third and fourth questions by looking for clues from the analysis of the structure of molecular clouds.
This review is meant primarily to address the progress made in the study of molecular clouds since the first Crete meeting on star formation, The Physics of Star Formation and Early Evolution (Blitz 1991), which discusses work on the subject through 1990. Other useful reviews include the article in this volume by McKee, which gives a good theoretical picture of the physics of molecular clouds, and the article in Protostars and Planets IV by Williams, Blitz & McKee (1999) which discusses progress in molecular cloud studies since Protostars and Planets III (Blitz 1993).
2 Formation of Molecular Clouds
2.1 Galaxy Scale Issues
The physics of the formation of GMCs is one of the major unsolved problems of the interstellar medium. Although many papers have been written on the subject, especially in the late 1970s and early 1980s, it is not yet known what the dominant formation mechanism is, or even what the relative importance of gravity, radiation and magnetic fields are in the cloud formation process. For example, GMCs are known to be self-gravitating because their mean internal pressures exceed that of the general ISM by about an order of magnitude (e.g. Blitz 1991). Since they are known to be at least as old as the oldest stars identified to have formed from them (e.g. 20 My in the case of Orion; Blaauw 1964), they must be stable for at least that long. It is then reasonable to conclude that gravity is one of the key elements in the formation of self-gravitating, relatively stable clouds. However, molecular clouds found at high galactic latitude (high latitude clouds; HLCs) also generally have turbulent pressures greater than the mean mid-plane ISM pressure, but have masses a few orders of magnitude smaller than the GMCs. Typically they are far from being self-gravitating (Magnani, Blitz & Mundy 1985; Reach, Wall & Odegard 1998) and gravity cannot have been a factor in their formation. Is gravity important only in forming clouds that exceed a certain minimum mass?
Mechanisms proposed for molecular cloud formation can be divided into three general categories: collisional agglomeration of smaller clouds (e.g. Kwan 1979; Scoville & Hersh 1979; Stark 1979; Cowie 1980; Kwan & Valdez 1983), gravi-thermal instability (e.g. Parker 1966; Mouschovias, Shu & Woodward 1974; Shu 1974; Elmegreen 1982a,b), and the pressurized accumulation in shocks, either in supernovae (Öpik 1954; Herbst & Assousa 1977) or in Galactic shocks (e.g. Woodward 1976). These mechanisms were reviewed by Elmegreen (1990; and references therein) who concluded that the most likely formation mechanism is the gravi-thermal instability applied to the cloudy ISM [his italics]. However, direct evidence has been very hard to come by and it has not been possible to apply the ideas to other galaxies or even to other parts of the Milky Way such as the Galactic Center. There may be clues in the angular momentum distribution of GMCs (Blitz 1993) but this has received little attention; it is not known, for example, whether GMCs in the disk rotate faster than they do in the solar vicinity, as expected from gravitationally formed clouds in a differentially rotating disk, or whether the counter-rotating clouds in the local neighborhood are pathological, or common throughout the disk. In one of the few papers on the subject, Phillips (1999) has analyzed the role of angular momentum in GMC support and formation: isolated clouds tend have angular velocity vectors perpendicular to the Galactic plane suggesting that their spin arises from Galactic shear, but internal structures have more randomly oriented spin axes due, possibly to turbulence, or dynamical interactions.
Nevertheless, two questions regarding molecular clouds which give us important clues for how GMCs form, have been settled in the last decade: 1) GMCs have lifetimes of 2 y, considerably shorter than a Galactic rotation period; 2) In galaxies with strong, well-defined spiral arms, molecular clouds are generally confined to the arms.
The question of cloud lifetimes, while hotly debated in the early 1980s, seems to have been settled by two sets of observations. The first is a good calibration of the H2/HI surface density ratio, (H2)/(HI), everywhere in the Milky Way (Dame 1993). This result coupled with a downward revision of the I(CO)/N(H2) ratio from the EGRET experiment on GRO (Hunter et al. 1997), implies that there is no radius in the Milky Way where (H2)/(HI) is significantly greater than 1. Thus the mass flow arguments suggesting long cloud lifetimes ( y; e.g. Solomon and Sanders 1980) are no longer applicable in the disk (see however §2.3 below for a discussion of the Galactic Center). The second is that the depletion time for the molecular gas due to star formation over the entire Galaxy is about 108 yr independent of radius (Lacey & Fall 1985; Blitz 1995), setting a strict upper limit to the lifetime of the molecular gas (rather than just the molecular clouds) in the Galaxy.
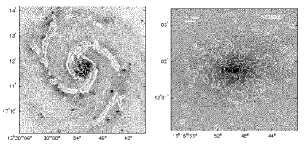
The degree of confinement of the molecular gas to the spiral arms has long been understood to be a direct test of GMC lifetimes, and the work of Cohen et al. (1980) has recently been improved with more sensitive data from the same telescope by Digel et al. (1996) and the new FCRAO outer Galaxy CO survey (Heyer & Terebey 1998). The CO integrated intensity contrast between the arm and interarm regions in the outer Galaxy is at least a factor of 28, indicating that the gas that enters a molecular arm is overwhelmingly atomic. Some of the results are discussed in greater detail below. With the improvement in resolution and sensitivity of the millimeter-wave interferometers it has now become possible to determine the degree of confinement of the molecular gas to the spiral arms in a wide variety of other galaxies. Figure 1a shows an image of the CO emission from M51 with the BIMA Array. This image contains data from all spatial scales down to the resolution limit and therefore contains all of the CO flux within the region surveyed. In M51, as in most of the other galaxies with strong spiral arms in the BIMA galaxy survey, the CO is closely confined to the spiral arms. However, in NGC 5055 (Figure 1b), there is a much smaller tendency for the CO to lie in spiral arms. The optical image shows no large scale spiral structure at all, though near infrared images show weak underlying spiral arms (Thornley 1996). Nevertheless NGC 5055 does show evidence for spirality, short incoherent spiral arm segments, that may play a role in GMC formation. Based on H images of the galaxy, It appears that the molecular clouds in NGC 5055 are not significantly different in their star forming properties from those in the Milky Way (Thornley 1996), because the star formation rate does not appear to be suppressed with respect to that measured in our own Galaxy.
We do not know, however, whether the physical properties of the individual molecular clouds in NGC 5055 differ from those in the Milky Way; the combination of sensitivity and resolution needed to find out will probably require the MMA. So, while the role of spiral arms in GMC formation is amply demonstrated in M51, M100, the Milky Way (see below) and other galaxies, it is unclear to what degree the spiral arms are necessary for GMC formation. Furthermore, there are some grand design spirals such as M81 that are weak in CO, so much so that it is not known to what degree the molecular clouds are confined to the spiral arms. More sensitive observations can settle the issue in M81 with present instruments.
2.2 The Chaff
We now wish to address the question of GMC formation in the disk of the Milky Way. In particular, recent observational progress has made it possible to address directly the role of molecular cloud agglomeration in the formation of GMCs.
New sensitive surveys of the molecular gas in the second Galactic quadrant with the FCRAO telescope (Heyer et al. 1998) and around one GMC (Mon OB1; Oliver, Masheder & Thaddeus 1996) have shown that there is a great deal of low surface brightness (i.e. low surface density) molecular gas in the spiral arms in the Galaxy and in the vicinity of GMCs. This gas bears a striking resemblance to the HLCs discovered in the mid-1980s (Blitz, Magnani & Mundy 1984). We may ask, is this molecular “chaff” seen in the high sensitivity surveys the same as the HLCs and can this molecular gas agglomerate to form the GMCs in the Milky Way?
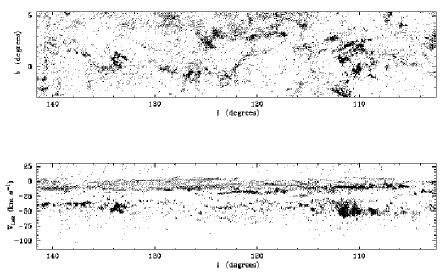
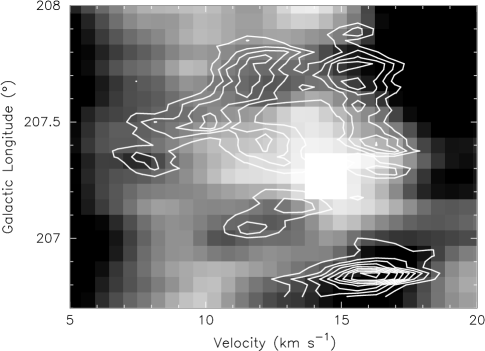
We first note that like the HLCs, most of the low column density gas in the Oliver et al. study is not self-gravitating; the dynamical masses typically exceed the luminous masses by more than an order of magnitude. The derived luminous masses of the clouds that compose the Mon OB 1 chaff are higher than the typical HLC masses, but this may be because Oliver et al. artificially placed all the clouds at a distance of about 1 kpc even though the clouds might be at any distance along the line of sight from 0 to about 1 – 1.5 kpc. The Oliver et al. map bears a striking resemblance to the FCRAO maps of Heyer et al. (1998), suggesting that the chaff permeates the entire outer Galaxy but with a decreased surface density between the arms. An example of the FCRAO survey in the range is shown in Figure 2a. A longitude-velocity plot over the same range is shown in Figure 2b.
Heyer & Terebey (1998) have determined the molecular cloud spectrum () for more than 1500 clouds in the Perseus Arm and found a power law exponent of , similar to the value found for inner Galaxy clouds (e.g. Sanders, Scoville, & Solomon 1985). Furthermore, their measurements included clouds with masses as low as 100 M⊙, well into the mass range of HLCs. This measurement has several implications. First, it suggests that the chaff (M M⊙) is part of the same population as the self-gravitating GMCs, and may very well share the same formation process: there is no obvious change in slope of the mass spectrum at the point where the clouds are no longer self-gravitating. Second, Heyer (1999) argues that, like the low column density clouds near MonOB1, the clouds that make up the chaff are not self-gravitating. Third, the slope implies that as for GMCs, most of the mass in chaff is contributed by the highest mass clouds. Thus even though Oliver et al. have probably erred on the masses of many individual clouds as the result of incorrect distance assumptions, the total estimated mass is probably not too much in error.
Oliver et al. (1996), find that the total mass of chaff near Mon OB1 is 3 M⊙. This is contained within a Galactic surface area of about 1 – 2 pc2, thus the surface density of the chaff is 0.15 – 0.3 M⊙ pc-2. The surface density of the HLCs is found to be 0.1 – 0.2 M⊙ pc-2 (Magnani, Blitz & Mundy 1985; Magnani, Lada, & Blitz 1986; Reach et al. 1998; Magnani, Hartmann & Thaddeus 1999), close to the Oliver et al. determination. The HLCs thus have the same surface density as the chaff, and they are each non-self-gravitating clouds of comparable mass. The chaff therefore appears to be the Galaxy-wide identification of what were first identified as high-latitude molecular clouds.
Figure 2 suggests that we may extrapolate the Oliver et al. values to the Galaxy as a whole. Assuming a constant surface density, we find that the total mass of the chaff is 7.5 – 15 M⊙, and that the total mass in GMCs is M⊙ (Dame 1993 – scaled to the Hunter 1997 recalibration of I(CO)/N(H2)). This difference implies that there is not enough mass in small molecular clouds to form the GMCs through collisional agglomeration. That is, if the number of GMCs is roughly in steady state and the formation time equals the dissolution time, then, averaged over the Galaxy, there would have to be approximately equal gas masses in GMCs and in the chaff. As Cowie (1980) showed, this need only to be true in the spiral arms, since orbit crowding can enhance the surface density of small clouds in the arms. However, the mass of chaff is well below that of the GMCs by about an order of magnitude, even in the spiral arms. It therefore appears that GMCs in the disk of the Milky Way must form by condensation from the HI, rather than from pre-existing molecular gas.
What does this imply for GMC formation and evolution? First, the short lifetime of molecular clouds implies that molecular gas recycles through the ISM fairly rapidly, and that the instantaneous recycling approximation often used in Galactic chemical evolution calculations is a good one. Second, it suggests that the collisional agglomeration of pre-existing molecular clouds as a formation mechanism for GMCs seems to be untenable in any form. Third, although spiral shock induced formation of GMCs seems to be indicated in many galaxies, it does not explain why there is extensive molecular gas and star formation in galaxies with weak or absent spiral arms. The formation of molecular clouds therefore seems to occur by condensation from the HI in conjunction with some other mechanism. This conclusion has already been discussed previously (e.g. Elmegreen 1990, Blitz 1991, 1993); the radius from which the H2 forms in the solar vicinity is about 150 pc for a typical GMC with radius pc. Although these conclusions seem secure within the Galactic disk, and are probably also true even at the peak of the molecular ring, the situation is dramatically different for GMCS near the Galactic Center where the ratio (H2)/(HI) 100 (e.g. Liszt & Burton 1996).
2.3 The Association of Atomic and Molecular Gas
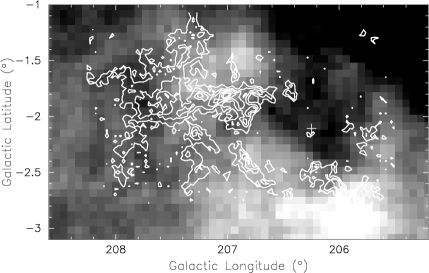
HI envelopes around molecular clouds are quite common (e.g., Moriarty-Schieven, Andersson & Wannier 1997; Williams & Maddalena 1996). Figure 3 shows an example of such a cloud around the Rosette Molecular Cloud (Williams, Blitz, & Stark 1995). In the solar vicinity the mass of the molecular envelopes seem to be about the same as the mass of molecular gas in a GMC (Blitz 1990), but the atomic gas is considerably more extended. These envelopes may be remnants of the atomic clouds that condensed to form the GMCs or may be the photodissociated gas from the GMCs, since the extinction is AV, just what is needed to shield the CO from the interstellar UV field. Most probably, they are a combination of both. In the solar vicinity, the separation between the HI envelopes is considerably larger than their diameters: the mean distance between GMCs is about 500 pc, and the molecular cloud/HI envelope complexes have diameters of about pc (Blitz 1990). The complexes are thus distinct from the background HI, indeed that is how they are identified.
In the inner Galaxy the situation is somewhat different. Near the peak of the molecular ring, the surface density of molecular gas is about equal to that of the atomic gas (Dame – 1993 modified by the new calibration of Hunter et al. 1997). If the GMCs in the ring have atomic envelopes with the HI mass equal to the H2 mass, as is true locally, then all of the atomic gas in the molecular ring would be associated with GMC envelopes, leaving little atomic gas for a true intercloud medium. This may not be a problem, however: the molecular gas surface density is a factor of 5 – 6 greater in the molecular ring than locally so the mean distance between GMCs pc, about the same as the diameter of the CO/HI GMC complexes. It may be that the envelopes merge and form a general background within which the GMCs are located. This might explain why it has been more difficult to associate atomic hydrogen clouds with GMCs in the molecular ring than it is locally.
Within several hundred parsecs of the Galactic center, the situation is drastically different. First, the gas is almost entirely molecular; only about 1% of the surface density of the gas is atomic (e.g. Liszt & Burton 1996). In this region of the Galaxy, gas that becomes neutral must quickly become molecular, and if the formation and dissolution of molecular clouds goes through an atomic phase, that phase must be very brief.
The relation of the atomic to molecular gas must also be very different in the central 300 pc of the Galaxy because of the large interstellar gas pressure due to the deep stellar potential of the bulge/bar. In the bulge, the interstellar gas pressure is both predicted and measured to be almost three orders of magnitude greater than it is locally (Spergel & Blitz 1992), and both the atomic and molecular gas are highly overpressured compared to the solar vicinity. The HI is particularly problematic because at a pressure P/k Kcm-3, and a maximum temperature of 104 K, the mean density of the atomic gas near the center must be cm-3, a density that is as high as the typical molecular gas density in local GMCs. How can this be? Apparently, the HI can only exist as either very small dense knots, in which case it would be difficult to avoid turning molecular, or as thin, high density sheets on the surfaces of the molecular clouds at the center. Because the molecular gas already has a low volume filling fraction, the ionized gas must make up almost all of the volume in the bulge/bar. This picture of the relationship between the atomic and molecular gas has not been directly verified by observation, but a combination of VLA observations with archival molecular cloud data should be able to do so.
The effect on star formation of this high pressure is hard to predict without better knowledge of the power law relating the density and pressure of the gas. For example, for a perfect gas, the Jeans mass of clumps is
The large increase in pressure at the Galactic center suggests that the typical self-gravitating mass would significantly decrease at the center. However, since the molecular clouds are known to be both hotter and more turbulent at the center (Güsten 1989), the strong dependence of the Jeans mass on the velocity dispersion of the gas can be more than offset by the increase in pressure. The largest uncertainly in applying Equation (1), is knowing what to take for for the individual star forming cores.
Astonishingly, even though the gas pressure is apparently quite high, the rate of star formation in the nuclear region (which can only be estimated for the massive stars) does not seem to be significantly different from that of the Galactic disk (Güsten 1989). This is remarkable given that the surface pressure on the molecular clouds is nearly three orders of magnitude greater than locally. If true, it suggests that the star forming properties of a GMC may be determined only locally within a cloud and that the ambient conditions may have to be even more extreme than those at the Galactic Center to have a significant effect on the IMF. If so, it will be necessary to look at the internal structure of a GMC to see how it organizes itself to form stars. We turn to that question in the following section.
3 CLOUD STRUCTURE
3.1 Categorization
Although molecular clouds are, by definition, regions in which the gas is primarily molecular by mass, much of the volume of such a cloud is not molecular. That is, the filling fraction of molecular gas is low, (Blitz 1993), and the cloud is highly structured with large density variations from one location to another. The structure (in volume density, column density, and velocity) of molecular clouds reflects the conditions from which they form, acts as a signpost to their evolution, and may, at sufficiently high densities, be related to the mass scale of stars and the slope of the IMF.
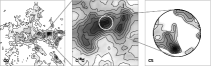
In this section, we discuss techniques to analyze cloud structure and the results and implications of such analyses. First, we define an operational categorization into clouds, clumps, and cores. The scales of interest are illustrated in Figure 4. This categorization is not inconsistent with the fractal models for cloud structure that are discussed in §3.4, although we argue that gravity introduces scales that limit the range of validity of the fractal description.
Clouds are regions in which the gas is primarily molecular as stated above. Almost all known molecular clouds in the Galaxy are detectable in CO. Giant molecular clouds, with masses , are generally gravitationally bound, and may contain several sites of star formation. However, there are also many small molecular clouds with masses , such as the unbound high latitude clouds discovered by Blitz, Magnani, & Mundy (1984), the chaff discussed in §2.2, and the small gravitationally bound molecular clouds in the Galactic plane cataloged by Clemens & Barvainis (1988). A small number of low mass stars are observed to form in some of these clouds but their contribution to the total star formation rate in the Galaxy is negligible (Magnani et al. 1995). Heyer et al. (1999) suggest that most of the clouds with M M⊙ are not self-gravitating; the Clemens & Barvainis clouds are presumably a small but unknown fraction of mass of the low mass chaff.
Clumps are coherent regions in space, generally identified from spectral line maps of molecular emission. Star-forming clumps are the massive clumps out of which stellar clusters form. Although most clusters are unbound, the gas out of which they form is bound (Williams et al. 1995). Clumps may be blended together at low intensities, particularly in low density molecular tracers such as CO and its isotopes. In this case, several techniques exist to decompose the emission into its constituent clumps (§3.2).
Cores are regions out of which single stars (or multiple systems such as binaries) form and are necessarily gravitationally bound. Not all material that goes into forming a star must come from the core; some may be accreted from the surrounding clump or cloud as the protostar moves through it (Bonnell et al. 1997).
3.2 Structure analysis techniques
Molecular cloud structure can be mapped via radio spectroscopy of molecular lines (e.g., Bally et al. 1987), continuum emission from dust (e.g., Wood, Myers, & Daugherty 1994), or stellar absorption by dust (Lada et al. 1994). The first gives kinematical as well as spatial information and results in a three dimensional cube of data, whereas the latter two result in two dimensional datasets. Many different techniques have been developed to analyze these data which we discuss briefly here.
Stutzki & Güsten (1990) and Williams, de Geus, & Blitz (1994) use the most direct approach and decompose the data into a set of discrete clumps, the first based on recursive tri-axial gaussian fits, and the latter by identifying peaks of emission and then tracing contours to lower levels. The resulting clumps can be considered to be the “building blocks” of the cloud and may be analyzed in any number of ways to determine a size-linewidth relation, mass spectrum, and variations in cloud conditions as a function of position (Williams et al. 1995). There are caveats associated with each method of clump deconvolution, however. Since the structures in a spectral line map of a molecular cloud are not, in general, gaussian, the recursive fitting method of Stutzki & Güsten (1990) will tend to find and subsequently fit residuals around each clump, which results in a mass spectrum that is steeper than the true distribution. On the other hand, the contour tracing method of Williams et al. (1994) has a tendency to blend small features with larger structures and results in a mass spectrum that is flatter than the true distribution.
Heyer & Schloerb (1997) use principal component analysis to identify differences in line profiles over a map. A series of eigenvectors and eigenimages are created which identify ever smaller velocity fluctuations and their spatial distribution, resulting in the determination of a size-linewidth relation. Langer, Wilson, & Anderson (1993) use Laplacian pyramid transforms (a generalization of the Fourier transform) to measure the power on different size scales in a map; as an application, they determine the mass spectrum in the B5 molecular cloud. Recently, Stutzki et al. (1998) have described a closely related Allan-variance technique to characterize the fractal structure of 2-dimensional maps. Houlahan & Scalo (1992) define an algorithm that constructs a structure tree for a map; this retains the spatial relation of the individual components within the map but loses information regarding their shapes and sizes. It is most useful for displaying and ordering the hierarchical nature of the structures in a cloud.
Adams (1992) discusses a topological approach to quantify the difference between maps. Various “output functions” (e.g., distribution of density, volume, and number of components as a function of column density; see Wiseman & Adams 1994) are calculated for each cloud dataset and a suitably defined metric is used to determine the distance between these functions and therefore to quantify how similar clouds are, or to rank a set of clouds.
A completely different technique was pioneered by Lada et al. (1994). They determine a dust column density in the dark cloud IC 5146 by star counts in the near-infrared and mapped cloud structure over a much greater dynamic range ( mag) than a single spectral line map. The effective resolution, , is determined by the sensitivity of the observations.
The most striking result of applying these various analysis tools to molecular cloud datasets is the identification of self-similar structures characterized by power law relationships between, most famously, the size and linewidth of features (Larson 1981), and the number of objects of a given mass (e.g., Loren 1989). Indeed, mass spectra are observed to follow a power law with nearly the same exponent, , where from clouds with masses up to in the outer Galaxy to features in nearby high-latitude clouds with masses as small as (Heyer & Terebey 1998; Kramer et al. 1998a; Heithausen et al. 1998). Since a power law does not have a characteristic scale, the implication is that clouds and their internal structure are scale-free. This is a powerful motivation for a fractal description of the molecular ISM (Falgarone et al. 1991, Elmegreen 1997a). On the other hand, molecular cloud maps do have clearly identifiable features, especially in spectral line maps when a velocity axis can be used to separate kinematically distinct features along a line of sight (Blitz 1993). These features are commonly called clumps, but there are also filaments (e.g., Nagahama et al. 1998), and rings, cavities, and shells (e.g., Carpenter et al. 1995). Both the discrete (clump) and fractal description of clouds can be used as tools of analysis and both reveal much about cloud physics and star formation. We discuss each in turn in the following subsections.
3.3 Clumps
Clump decomposition methods such as those described above by Stutzki & Güsten (1990) and Williams et al. (1994) can be readily visualized and have an appealing simplicity. In addition, as for all automated techniques, these algorithms offer an unbiased way to analyze datasets, and are still a valid and useful tool for cloud comparisons even if one does not subscribe to the notion of clumps within clouds as a physical reality (Scalo 1990).
In a comparative study of two clouds, Williams et al. (1994) searched for differences in cloud structure between star forming and non-star forming GMCs. The datasets they analyzed were maps of (1–0) emission with similar spatial (0.7 pc) and velocity resolution (0.68 km s-1) but the two clouds, although of similar mass , have very different levels of star formation activity. The first, the Rosette molecular cloud, is associated with an HII region powered by a cluster of 17 O and B stars and also contains a number of bright infrared sources from ongoing star formation deeper within the cloud (Cox, Deharveng, & Leene 1990). The second cloud, G216-2.5, originally discovered by Maddalena & Thaddeus (1985), contains no IRAS sources from sites of embedded star formation and has an exceptionally low far-infrared luminosity to mass ratio (Blitz 1990), , compared to more typical values of order unity (see Williams & Blitz 1998).
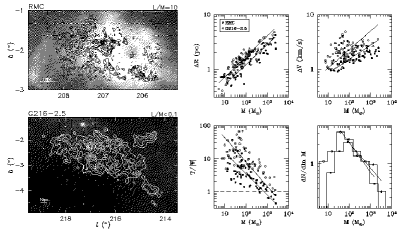
Almost 100 clumps were cataloged in each cloud, and sizes, linewidths, and masses were calculated for each. These basic quantities were found to be related by power laws with the same index for the two clouds, but with different offsets (Figure 5) in the sense that for a given mass, clumps in the non-star forming cloud are larger, and have greater linewidths than in the star forming cloud. The similarity of the power law indices suggests that, on these scales, few pc, and at the low average densities, cm-3, of the observed clumps, the principal difference between the star forming and non-star forming cloud is the change of scale rather than the collective nature of the structures in each cloud.
Figure 5 shows that the kinetic energy of each clump in G216-2.5 exceeds its gravitational potential energy, and therefore no clump in the cloud is self-gravitating (although the cloud as a whole is bound). On the other hand, Williams et al. (1995) show that, for the Rosette molecular cloud, star formation occurs only in the gravitationally bound clumps in the cloud. Therefore, the lack of bound clumps in G216-2.5 may explain why there is little or no star formation currently taking place within it.
Even in the Rosette cloud, most clumps are not gravitationally bound (and do not form stars). These unbound clumps have similar density profiles, , as the bound clumps (Williams et al. 1995), but contain relatively little dense gas as traced by CO(3–2) or CS(2–1) (Williams & Blitz 1998). The unbound clumps are “pressure confined” in that their internal kinetic pressure, which is primarily turbulent, is comparable to the mean pressure of the ambient GMC (Blitz 1991; Bertoldi & McKee 1992). Simulations suggest that these clumps are transient structures (Ostriker, Gammie, & Stone 1999).
The nature of the interclump medium remains unclear: Blitz & Stark (1986) found low intensity broad line wings in their CO and 13CO(1–0) observations of the Rosette molecular cloud which, they postulated, resulted from a pervasive low density molecular interclump medium, but Schneider et al. (1996) found that the line wings are also apparent in the transitions with a line ratio similar to the core emission possibly indicating a density not much different from the bulk of the cloud, and therefore not interclump. On the other hand, substantial HI envelopes exist around molecular clouds (Blitz 1990, 1993) and may also pervade the volume between the clumps within a cloud (Figure 6). The turbulent pressures of the atomic and molecular components, , where is the density and is the velocity dispersion, are comparable (Williams et al. 1995) and show that the HI can indeed confine the CO clumps.
Cloud, clump, and core density profiles are reflections of the physics that shape their evolution, but the density profiles of clouds and clumps have received scant attention. For clouds, which often are quite amorphous without a clear central peak, the density profile is often difficult to define observationally. For clumps, Williams et al. (1995) showed that surface density profiles of pressure bound, gravitationally bound, and star-forming clumps all have similar power law indices close to 1. Formally, the fits range from -0.8 to -1.2, but these differences appear to be only marginally significant. For a spherical cloud of infinite extent, implies , suggesting that the (turbulent) pressure support is spatially constant. However, McLaughlin & Pudritz (1996) argued that for finite spheres, the volume density distribution can be considerably flatter than that inferred for infinite clumps. Density distributions inferred from observations also require consideration of beam-convolution effects. It is nevertheless astonishing that both strongly self-gravitating clumps and those bound by external pressure have such similar, perhaps identical density distributions. Why this should be so is unclear.
3.4 Fractal Structures
An alternate description of the ISM is based on fractals. High spatial dynamic range observations of molecular clouds, whether by millimeter spectroscopy (e.g., Falgarone et al. 1998), IRAS (Bazell & Désert 1988), or using the Hubble Space Telescope (e.g., O’Dell & Wong 1996; Hester et al. 1996) show exceedingly complex patterns that appear to defy a simple description in terms of clouds, clumps and cores; Scalo (1990) has argued that such loaded names arose from lower dynamic range observations and a general human tendency to categorize continuous forms into discrete units.
As we have discussed above, it seems that however one analyzes a molecular cloud dataset, one finds self-similar structures. Moreover, the highly supersonic linewidths that are observed in molecular clouds probably imply turbulent motions (see discussion in Falgarone & Phillips 1990), for which one would naturally expect a fractal structure (Mandelbrot 1982).
The fractal dimension of a cloud boundary, , can be determined from the perimeter-area relation of a map, . Many studies of the molecular ISM find a similar dimension, (Falgarone et al. 1991 and references therein). In the absence of noise, demonstrates that cloud boundaries are fractal. That is invariant from cloud to cloud (star-forming or quiescent, gravitationally bound or not) is perhaps related to the similarity in the mass spectrum index in many different molecular clouds (Kramer et al. 1998a; Heithausen et al. 1998). Fractal models have been used to explain both the observed mass spectrum of structures (Elmegreen & Falgarone 1996) and the stellar IMF (Elmegreen 1997b).
Conclusions about physical processes in molecular clouds that are drawn from the perimeter-size relation should be treated with caution, however, since in column density maps such as from IRAS observations or integrated intensity spectral line maps, the observed structures are projections of an inherently three-dimensional distribution which, for sufficiently high filling factor, results in multiple overlapping of unrelated objects. Such overlapping is found to mimic the observed fractal perimeter-size relation in Monte-Carlo simulations of clumpy media by Witt & Gordon (1996). That is, in an inhomogeneous cloud the overlap of discrete objects from projection can be a fractal even if the individual objects are not. Furthermore, noise can produce a non-integral exponent in the perimeter-area relation giving the appearance of a fractal, but the degree to which noise affects the published results has not yet been investigated.
Probability density functions (PDFs) may be used to describe the distribution of physical quantities (such as density and velocity) in a region of space without resorting to concepts of discrete objects such as clouds, clumps and cores. Falgarone & Phillips (1990), for example, have analyzed the PDF of the velocity field of several clouds at different scales. The low-level, broad line wings that are observed in non-star forming regions show that the probability of rare, high-velocity motions in the gas are greater than predicted by a normal (gaussian) probability distribution. This intermittent behavior is expected in a turbulent medium, and the detailed analysis of Falgarone & Phillips shows that the deviations from the predictions for Kolmogorov turbulence are small. Miesch & Scalo (1995) calculate velocity centroid PDFs from observations of star-forming regions and also report non-gaussian behavior. Lis et al. (1996) compare their results with a similar analysis applied to simulations of compressible turbulence; such work may be a promising avenue for exploring the role of turbulence in molecular clouds.
Detailed simulations of 3-D hydromagnetic turbulence including gravity have now become possible and may ultimately help to determine how the structure in molecular clouds forms. The best simulations to date are those by Ostriker et al. (1999) and the next few years should show a great deal of progress in the application of codes to molecular clouds. The utility of the clump finding algorithms such as Clumpfind (Williams et al. 1994) applied to both the simulations and the observations will be a good test of how closely the simulations match reality.
3.5 Departures from self-similarity
The universal self-similarity that is observed in all types of cloud, over a wide range in mass and star forming activity is remarkable, but a consequence of this universality is that it does not differentiate between clouds with different rates of star formation (or those that are not forming stars at all) and therefore it cannot be expected to explain the detailed processes by which a star forms. Star formation must be preceded by a departure from structural self-similarity.
There have long been suggestions that the thermal Jeans mass gives a scale that determines the characteristic mass of stars (Larson 1985). In order to determine whether such a scale is important in molecular clouds, Blitz & Williams (1997) examined how the structural properties of a large scale, high resolution map of the Taurus molecular cloud obtained by Mizuno et al. (1995) varied as the resolution was degraded by an order of magnitude. In their work, they use the temperature PDF of the dataset to compare the cloud properties as a function of resolution. This is the most basic statistic and requires minimal interpretation of the data. In Figure 7 we show the temperature PDF for the Taurus dataset at two resolutions and four other maps of molecular clouds.

To compare the different cloud PDFs, Figure 7 shows temperatures that have been normalized by the peak, , of each map. Each PDF has also been truncated at to show only those points with high signal-to-noise. Within the Poisson errors (not shown for clarity), the PDFs of the different clouds are all the same, except for the higher resolution Taurus PDF for which there is a lower relative probability of having lines of sight with . The low intensities of the emission imply that the optical depth is small along all lines of sight in the map, and is not responsible for this effect. Rather, from examination of the integrated intensity maps, Blitz & Williams (1997) show that this is due to a steepening of the column density profiles at small size scales (see also Abergel et al. 1994).
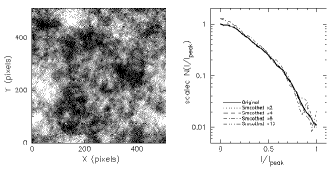
There are two immediate implications from Figure 7. First, the common exponential shape for the temperature PDF is another manifestation of the self similar nature of cloud structure. It is a simple quantity to calculate and may provide a quick and useful test of the fidelity of cloud simulations. Second, since the behavior of the Taurus dataset changes as it is smoothed, it cannot be described by a single fractal dimension over all scales represented in the map since the intensity PDF for a fractal is invariant under smoothing (Figure 8). There is other evidence for departures from self-similarity at similar size scales. Goodman et al. (1998) examine in detail the nature of the size-linewidth relation in dense cores as linewidths approach a constant, slightly greater than thermal, value in a central “coherent” region pc diameter (Myers 1983). Also, Larson (1995) finds that the two-point angular correlation function of T Tauri stars in Taurus departs from a single power law at a size scale of 0.04 pc (see also Simon 1997).
For gas of density cm-3, these size scales correspond to masses of order , close to the thermal Jeans mass at a temperature K. It is important to note that the above evidence for characteristic scales comes from studies of gravitationally bound, star forming regions: self-similarity in unbound clouds continues to much smaller scales. Figure 7 shows that the temperature PDF of the unbound, high latitude cloud MBM12 is identical, at a resolution of 0.03 pc, to the other lower resolution PDFs of star forming GMCs. Similarly, the mass spectra of other high latitude clouds follow power laws, with , down to extremely low masses, (Kramer et al. 1998a; Heithausen et al. 1998). It appears to be the action of gravity that creates the observed departures from self-similarity. Note, however, that if the Jeans mass is physically relevant to the structure of molecular clouds, then clouds must be magnetically supercritical (i.e., magnetic fields cannot prevent dynamical collapse) since, as explained in the chapter by Shu et al., the Jeans mass has no meaning in subcritical clouds (such clouds are supported by magnetic fields against gravitational collapse no matter how highly compressed).
4 THE RELATION BETWEEN CLOUD STRUCTURE AND THE IMF
The spectrum, lifetime, and end state of a star are primarily determined by its mass. Consequently, the problem of understanding how the mass of a star is determined during its formation, and the origin of the IMF, has a very wide application in many fields from galaxy evolution to the habitability of extrasolar planets. The form of the IMF is typically assumed to be invariant, but since it is directly measureable only locally, knowing how it comes about can help us predict how it might vary under different astrophysical environments.
Many explanations for the form of the IMF use as their starting point the mass spectrum of clouds and clumps as revealed by molecular line emission, with . Most such structures, however, are not forming stars: the majority of stars form in clusters in a few of the most massive clumps in a cloud. An understanding of the origin of the IMF can only come about with a more complete picture of the formation of star-forming clumps and the fragmentation of these clumps down to individual star forming cores.
The cores that form an individual star (or multiple stellar system) have typical average densities cm-3 and can be observed in high excitation lines or transitions of molecules with large dipole moments (Benson & Myers 1989), or via dust continuum emission at millimeter and sub-millimeter wavelengths (Kramer et al. 1998b). Because of their high densities, the surface filling fraction of cores is low, even in cluster forming environments. Therefore searches for cores have generally followed signs of star formation activity, e.g. IRAS emission, outflows, etc. and there have been few unbiased searches (e.g. Myers & Benson 1983). However, increases in instrument speed have now made it possible to survey millimeter continuum emission over relatively large areas of the sky. There have been two very recent results in this regard, the first by Motte, André, & Neri (1998) at 1.3 mm using the array bolometer on the IRAM 30 m telescope, and the second by Testi & Sargent (1998) at 3 mm using the OVRO interferometer.
Motte et al. (1998) mapped the Ophiuchus cloud, the closest rich cluster forming region and Testi & Sargent (1998) mapped the Serpens molecular cloud, a more distant, but richer star forming region. In each case, the large scale, high resolution observations reveal a large number of embedded young protostars and also starless, dense condensations. Both studies find that the mass spectrum of the cores is significantly steeper, (where ) than clump mass spectra, . The core mass spectra approach the slope, , of the stellar (Salpeter) IMF. These intriguing results suggest that the masses of stars that form in a cloud are directly linked to its structure. However, these investigations could not determine whether the clumps are self-gravitating, a necessary condition to show that these continuum cores actually form stars. Recall, for example, that the lowest mass molecular clouds, as well as the low mass clumps within a GMC are not, in general, self-gravitating. Surveys of other cluster forming regions should be made and these studies should be followed up with spectral line observations to determine whether the starless cores are self-gravitating, or even collapsing (Williams & Myers 1999), and therefore likely progenitors of future stars.
It is worth noting also that, since the filling fraction of the cores is much lower than that of the lower density CO clumps, the projection effects that we cautioned about above and simulated by Witt & Gordon (1996) are much less severe. Thus, it is not entirely clear that the observed departure from self-similarity is due to real physical processes such as gravity and/or the dissipation of turbulence, or is simply a result of the lower filling fraction.
As high resolution studies of individual cores in cluster environments become more commonplace, the relationship between stellar mass and core mass will be determined more precisely. If the core mass spectrum is indeed similar to the stellar IMF, then the fraction of a cores mass that goes into a star (the star formation efficiency of the core) must be approximately independent of mass and the stellar IMF is determined principally by the cloud fragmentation processes. By measuring the core mass spectrum in different clusters in a variety of different molecular clouds, the influence of the large scale structure and environment on the IMF can be quantified.
5 Summary
Considerable progress has been made in addressing many of the issues concerning molecular clouds since the first Crete conference and new results tentatively suggest a direct link between cloud structure and the IMF.
It seems clear that molecular clouds form through the condensation of HI since very little molecular gas exists between the spiral arms. Collisional agglomeration in any form appears to be ruled out because of the small total mass of low mass clouds (the chaff). However, many details of the formation process, such as the role of Galactic shocks and magnetic fields for instance, remain to be understood.
A close association between atomic and molecular gas is evident in the solar neighborhood and detailed maps suggest that the interclump medium within clouds is predominantly atomic. In the Galactic Center, however, the formation of molecular clouds and their association with the atomic gas must be very different because the pressure is more than 2 orders of magnitude higher, and the atomic mass fraction more than 2 orders of magnitude lower, than at the solar circle. Understanding cloud and star formation in this environment is a step toward understanding how stars form in even more extreme environments such as starbursts.
The structure within clouds reflects their formation from an inhomogeneous atomic ISM and, at moderate densities, cm-3, is self-similar up to a scale set by self-gravity. In this regime, scaling laws such as clump mass spectra have similar power law indices independent of the star-forming nature of the cloud.
At higher densities, and smaller sizes, as linewidths approach their thermal value, structures depart from the same self-similar description. This departure may mark the boundary between cloud evolution and star formation. Clusters of individual star forming cores, with a mass spectrum that approaches the Salpeter IMF, are observed in the Ophiuchus and Serpens clouds. The study of the structure, dynamics, and distribution of these cores will lead to a better understanding of the relationship between the structure and evolution of molecular clouds and the initial mass function of stars.
Funding has been provided by a grant from the NSF. JPW is supported by a Jansky fellowship. We thank Tamara Helfer for providing Figure 1, Mark Heyer for Figure 2, and Loris Magnani for results prior to publication. We would also like to acknowledge discussions with Mark Heyer, Tam Helfer, Chris McKee, Tom Sodroski and Michele Thornley, about various topics covered in this review.
References
- [1] Abergel, A., Boulanger, F., Mizuno, A., & Fukui, Y. 1994, ApJ Lett., 423, L59.
- [2] Adams, F.C. 1992, ApJ, 387, 572
- [3] Bally, J., Stark, A.A., Wilson, R.W., & Langer, W.D. 1987, ApJ Lett., 312, L45
- [4] Bazell, D., & Désert, F.X. 1988, ApJ, 333, 353
- [5] Benson, P.J., & Myers, P.C. 1989, ApJ Suppl., 71, 89
- [6] Bertoldi, F., & McKee, C.F. 1992, ApJ, 395, 140
- [7] Blaauw, A. 1964, Ann. Rev. Astron. Astrophys., 2, 213
- [8] Blitz, L. 1990, The Evolution of the Interstellar Medium, ed. L. Blitz, (ASP Press: San Francisco), 273
- [9] Blitz, L. 1991, The Physics of Star Formation and Early Stellar Evolution, ed. C. J. Lada & N. D. Kylafis (Dordrecht: Kluwer), 3
- [10] Blitz, L. 1993, Protostars and Planets III, eds. E.H. Levy and J.I. Lunine, (Tucson: Univ. of Arizona Press), 125
- [11] Blitz, L. 1995 in CO: 25 Years of Millimeter-wave Spectroscopy eds. W.B Latter et al., (Kluwer:Dordrecht), 11
- [12] Blitz, L. Magnani, L. and Mundy, L. 1984, ApJ Lett., 282, L9
- [13] Blitz, L., & Stark, A.A. 1986, ApJ Lett., 300, L89
- [14] Blitz, L., & Williams, J.P. 1997, ApJ Lett., 488, L145
- [15] Bonnell, I.A., Bate, M.R., Clarke, C.J., & Pringle, J.E. 1997, MNRAS, 285, 201
- [16] Carpenter, J.M., Snell, R.L., & Schloerb, F.P. 1995, ApJ, 445, 246
- [17] Clemens, D.P., & Barvainis, R. 1988, ApJ Suppl., 68, 257
- [18] Cohen, R.S., Cong, H.-I., Dame, T.M. & Thaddeus, P. 1980, ApJ Lett., 239, L53
- [19] Cowie, L.L. 1980, ApJ, 236, 868
- [20] Cox, P., Deharveng, L. & Leene, A. 1990, A&A, 230, 181
- [21] Dame, T.M. 1993, in Back to the Galaxy, S.S. Holt & F. Verter, eds. (AIP Press:New York), 267
- [22] Digel, S.W., Lyder, D.A., Philbrick, A.J., Puche, D., & Thaddeus, P. 1996, ApJ, 458, 561
- [23] Elmegreen, B.G. 1982a, ApJ, 253, 634
- [24] Elmegreen, B.G. 1982b, ApJ, 253, 655
- [25] Elmegreen, B.G. 1990, in The Evolution of the Interstellar Medium, ed. L. Blitz, (ASP Press: San Francisco), 247
- [26] Elmegreen, B.G. 1997a, ApJ, 477, 196
- [27] Elmegreen, B.G. 1997b, ApJ, 486, 944
- [28] Elmegreen, B.G., & Falgarone, E. 1996, ApJ, 471, 816
- [29] Falgarone, E., Panis, J.-F., Heithausen, A., Pérault, M., Stutzki, J., Puget, J.-L., & Bensch, F. 1998, A&A, 331, 669
- [30] Falgarone, E., & Phillips, T.G. 1990, ApJ, 359, 344
- [31] Falgarone, E., Phillips, T.G., & Walker C.K. 1991, ApJ, 378, 186
- [32] Goodman, A.A., Barranco, J.A., Wilner, D.J., & Heyer, M.H. 1998, ApJ, 504, 223
- [33] Güsten, R. 1989, in The Center of the Galaxy, ed. M. Morris, (Kluwer:Dordrecht), 89
- [34] Herbst, W. & Assousa, G.E. 1977, ApJ, 217, 473
- [35] Heyer, M.H., & Schloerb, F.P. 1997, ApJ, 475, 173
- [36] Heyer, M.H., & Terebey, S. 1998, ApJ, 502, 265
- [37] Heyer, M.H., Brunt, C., Snell, R.L., Howe, J.E., and Schloerb, P. 1998, ApJ Suppl., 115, 241
- [38] Heyer, M.H. 1999, inNew Perspectives of the Interstellar Medium, eds: A.R.Taylor & T.L. Landecker, ASP Conference Series, in press.
- [39] Heithausen, A., Bensch, F., Stutzki, J., Falgarone, E., & Panis, J.-F. 1998, ApJ Lett., 331, L65
- [40] Hester, J.J., et al. 1996, AJ, 111, 2349
- [41] Houlahan, P., & Scalo, J. 1992, ApJ, 393, 172
- [42] Hunter, S.D. et al. 1997, ApJ, 481, 205
- [43] Kramer, C., Stutzki, J., Röhrig, R., Corneliussen, U. 1998a, A&A 329, 249
- [44] Kramer, C., Alves, J., Lada, C., Lada, E., Sievers, A., Ungerechts, H., & Walmsley, M. 1998b, A&A Lett., 329, L33
- [45] Kuchar, T.A., & Bania, T.M. 1993, ApJ, 414, 664
- [46] Kwan, J. 1979, Apj, 229, 567
- [47] Kwan, J. & Valdez, F. 1983, 271, 604
- [48] Lacey, C.G. & Fall, S.M. 1985, ApJ 290, 154
- [49] Lada, C.J., Lada, E.A., Clemens, D.P., & Bally, J. 1994, ApJ, 429, 694
- [50] Langer, W.D., Wilson, R.W., Anderson, C.H. 1993, ApJ Lett., 408, L45
- [51] Larson, R.B. 1995, MNRAS, 272, 213
- [52] Larson, R.B. 1985, MNRAS, 214, 379
- [53] Larson, R.B. 1981, MNRAS, 194, 809
- [54] Lis, D.C., Pety, J., Phillips, T.G., & Falgarone, E. 1996, ApJ, 463, 623
- [55] Liszt, H.S. & Burton, W.B. 1996, in Unsolved Problems of the Milky Way, eds. L. Blitz, & P. Teuben, (Kluwer:Dordrecht), 297
- [56] Loren, R.B. 1989, ApJ, 338, 902
- [57] Maddalena, R., & Thaddeus, P., 1985, ApJ, 294, 231
- [58] Magnani, L., Blitz, L. & Mundy 1985, ApJ, 295, 402
- [59] Magnani, L., Lada, E.A. & Blitz, L. 1986, ApJ, 301, 395
- [60] Magnani, L., Caillault, J.-P., Buchalter, A., & Beichman, C.A. 1995, ApJ Suppl., 96, 159
- [61] Magnani, L. Hartmann, D. & Thaddeus, P. 1999, in preparation
- [62] Mandelbrot, B.B. 1982, The Fractal Geometry of Nature (San Francisco: Freeman)
- [63] McLaughlin, D.E., and Pudritz, R.E. 1996, ApJ, 469, 194
- [64] Miesch, M.S., & Scalo, J.M. 1995, ApJ, 429, 645
- [65] Mizuno, A., Onishi, T., Yonekura, Y., Nagahama, T., Ogawa, H., & Fukui, Y. 1995, ApJ Lett., 445, L161
- [66] Moriarty-Schieven, G.H., Andersson, B.-G., & Wannier, P.G. 1997, ApJ, 475, 642
- [67] Motte, F., André, Ph., & Neri, R. 1998, A&A, 336, 150
- [68] Mouschovias, T., Shu, F. & Woodward, P. 1974, A&A, 33, 73
- [69] Myers, P.C. 1983, ApJ, 270, 105
- [70] Myers, P.C., & Benson P.J. 1983, ApJ, 266, 309
- [71] Nagahama, T., Mizuno, A., Ogawa, H., & Fukui, Y. 1998, AJ, 116, 336
- [72] O’Dell, C.R., & Wong, S.K. 1996, AJ, 111, 846
- [73] Oliver, R.J., Masheder, M.R.W. & Thaddeus, P. 1996, A&A, 315, 578
- [74] Omont, A., Pettijean, P., Guilloteau, S., McMahon, R.G., Solomon, P.M. & Pecontal, E., 1996, Nature, 382, 428
- [75] Öpik, E. 1953, Irish AJ, 2, 219
- [76] Ostriker, E.C., Gammie, C.F., & Stone, J.M. 1999, ApJ, in press
- [77] Parker, E.N. 1966, ApJ, 145, 811
- [78] Phillips, J.P.. 1999, A&A Suppl., 134, 241
- [79] Reach, W.T., Wall, W.F. & Odegard, N, 1998, ApJ, 507, 507
- [80] Rucinski, S.M., & Krautter, J. 1983, A&A, 121, 217
- [81] Sanders, D.B., Scoville, N.Z. & Solomon, P.M. 1985, ApJ, 289, 323
- [82] Scalo, J. 1990, Physical Processes in Fragmentation and Star Formation, eds. R. Capuzzo-Dolcetta et al. (Dordrecht: Kluwer) 151
- [83] Schneider, N., Stutzki, J., Winnewisser, G., & Blitz, L. 1996, ApJ Lett., 468, 119
- [84] Scoville, N.Z. & Hersh, K. 1979, ApJ, 229, 578
- [85] Shu, F. 1974, A&A, 33, 55
- [86] Simon, M. 1997, ApJ Lett., 482, 181
- [87] Solomon, P.M. & Sanders, D.B. 1980 in Giant Molecular clouds, eds. P.M. Solomon & M.G. Edmunds, (Pergammon: Oxford) 41
- [88] Spergel, D.N. & Blitz, L. 1992, Nature, 357, 665
- [89] Stark, A.A. 1979, Ph.D. Dissertation, Princeton University
- [90] Stutzki, J., Bensch, F., Heithausen, A., Ossenkopf, V., & Zielinsky, M. 1998, A&A, 336, 697
- [91] Stutzki, J., & Güsten, R., 1990, ApJ, 356, 513
- [92] Testi, L., & Sargent, A.I. 1998, ApJ Lett., 508, 91
- [93] Thornley, M.D. 1996, ApJ Lett., 469, L45
- [94] Williams, J.P., & Blitz, L. 1998, ApJ, 494, 657
- [95] Williams, J.P., Blitz, L., & Stark, A.A. 1995, ApJ, 451, 252
- [96] Williams, J.P., de Geus, E.J., & Blitz, L. 1994, ApJ, 428, 693
- [97] Williams, J.P., Blitz, L. & McKee, C. F. 1999, in Protostars and Planets IV eds. V. Mannings & A. Boss, (University of Arizona Press), in press
- [98] Williams, J.P., & Maddalena, R.J. 1996, ApJ, 464, 247
- [99] Williams, J.P., & Myers, P.C. 1999, ApJ Lett., submitted
- [100] Wiseman, J.J., & Adams, F.C. 1994, ApJ, 435, 708
- [101] Witt, N.A., & Gordon, K.D. 1996, ApJ, 463, 681
- [102] Wood, D.O.S., Myers, P.C., & Daugherty, D.A. 1994, ApJ Suppl., 95, 457
- [103] Woodward, P.R. 1976, ApJ, 207, 466