Black holes in Active Galactic Nuclei: observations
Abstract
This paper summarizes the observations which provide the best evidence for the presence of black holes in active galactic nuclei. This includes: X–ray variability; kinematical studies using optical emission lines as well as the distribution of megamaser spots; and the shape of the Fe K X–ray emission line. It also presents the current status of our understanding of jet-dominated active galaxies (blazars), and briefly reviews the currently popular AGN “Unification Schemes” based on orientation effects. Finally, it reviews the observations of the X–ray and –ray continuum, which, at least for the radio-quiet objects, is likely to be the primary form of their radiative output, and summarizes the best current models for the radiative processes responsible for the high-energy electromagnetic emission in radio-quiet AGN, as well as in jet-dominated blazars.
To appear in Theory of Black Hole Accretion Disks,
M. Abramowicz, G. Bjornsson, & J. Pringle, Eds. (Cambridge University Press)
1. Introduction
Perhaps the most exciting astronomical observation leading to our current understanding of black holes has been the discovery of quasars. These celestial objects, originally found in the early sixties as point-like radio emitters, were identified with apparently stellar sources, possessing somewhat unusual spectra, with prominent emission lines. The identification by [Schmidt (1963)] of these lines as redshifted systems implied that quasars are distant and extremely luminous, commonly producing erg s-1; this is a hundred times or more in excess of the total luminosity of all the stars in a galaxy. Sensitive imaging of the nebulosities which often surround them implied that quasars are nuclei of galaxies, and thus are higher-luminosity counterparts of the compact nuclei of Seyferts, studied some twenty years before the discovery of quasars as unusual emission line objects: hereafter, we assume that they are respectively the lower and higher luminosity end of the same population. A variety of scenarios were advanced to explain their nature, and this included multiple supernovae or massive spinning stars, but the proposal that quasars are powered by an accretion of surrounding matter onto a black hole, advanced in the mid-60s by [Salpeter (1964)] and [Zeldovich & Novikov (1964)], became the paradigm that we are developing and testing today. While this is a viable and very attractive paradigm, only the last few years brought a solid evidence for it, allowing also to measure the mass of the central object. It is important to note here that quasars are much more numerous at a redshift 2 than they are locally, meaning that a substantial fraction of galaxies must have undergone the quasar phase. It is thus likely that many otherwise normal local galaxies harbor supermassive black holes, “dead quasars.” In fact, as we discuss below, there is a number of relatively anonymous galaxies that show no signs of nuclear activity, but do show evidence for such black holes.
We present the observational evidence for black holes in AGN in Section 2; in Section 3, we discuss the effects of the orientation of the accretion disk surrounding the back hole on the appearance of the nucleus. In Section 4, we discuss the jet-dominated AGN known as blazars. In Section 5, we review the observations of AGN in X–rays and –rays, the bands that sample the regions closest to the black hole, and in Section 6, we review the radiation processes proposed to explain the emission in these bands.
2. Lines of Evidence for Presence of Black Holes in Active Galaxies
There are two general lines of argument that are used to “prove” the existence of black holes in AGN. The first attempts to measure the total mass within a volume, and argues that no other form besides a black hole can have these parameters. This is done either via estimation of the volume from variability data (via the light travel time arguments) and mass from the luminosity (via the Eddington limit); alternatively, this can be determined by a measurement of velocity of matter at a specified distance from the central object, essentially using Kepler’s laws. The second method, discussed in more detail in Chapter 5.3 (by A. Fabian), relies on the distortion of the emission line shapes caused by strong gravity resulting from the presence of a black hole, and we cover it here only briefly.
2.1. X–ray Variability
The variability of active galaxies generally shows the highest amplitude and the shortest time scales in the X–ray and –ray bands, which happen to be clearly separated from the optical / UV bands by the strong absorption of the interstellar medium in our own Galaxy. This rapid variability as well as other lines of argument indicate that the X–ray / –ray radiation arises the closest to the central source, and in many cases, is the primary source of energy in active galaxies. While the total bolometric luminosity of quasars is often dominated by the optical and UV flux (see, e. g., Laor et al. 1997; for a recent review, see Ulrich, Maraschi, & Urry 1997), the bulk of this flux probably arises in more distant regions from the central source than the X–rays and –rays. The optical and UV radiation arising in the innermost regions of the nucleus, on the other hand, is most likely a result of reprocessing of X–ray / –ray photons. This – as well as the author’s personal interest in X–rays – is the reason why this chapter focuses primarily on the high energy emission from quasars.
In general, the X–ray variability of quasars is aperiodic. While a measurement of periodic variability would give us a clue to the circumnuclear environment and thus the nature of the black hole, besides the ill-fated NGC 6814 (cf. Madejski et al. 1993), no strict periodicity was reported for any AGN. However, there were two reports of quasi-periodic variation of flux of active galaxies: NGC 5548 (Papadakis & Lawrence 1993) and NGC 4051 (Papadakis & Lawrence 1995) inferred from the EXOSAT data, but the quality of the data is only modest, and these still need to be confirmed. More statistically significant is the quasi-periodic variability of of IRAS 18325-5926 by [Iwasawa et al. (1998)], but this is inferred from only a few ( 10) cycles, and requires confirmation via further monitoring before drawing any detailed conclusions. Nonetheless, we understand relatively little about the details of variability of active galaxies, although the recent light curves are sufficiently good to discriminate if the time series are linear or non-linear; this is discussed later in this chapter.
In any case, this rapid variability implies a compact source size. This is of course the standard causality argument: no stationary source of isotropic radiation can vary faster than the time it takes for light to cross it. In the X–ray band, the power spectrum of variability generally is rather flat at long time scales, and above some characteristic frequency, it shows a power-law behavior, such that the variable power drops with decreasing time scale (see, e.g., McHardy 1989); the Fourier phases of these light curves show no coherence (cf. Krolik, Done, & Madejski 1993). As it was pointed by many authors, for this form of variability, the doubling time scale has no definitive meaning, but for the lack of better data, it suffices for the illustrative purposes: it is certainly valid as an order-of-magnitude relationship between the source radius and the time scale for doubling of the source flux such that . Again, for quasars, this is particularly true in the X–ray band, where the variability is most rapid: even the early X–ray data gave us a clue that quasars are very compact. For example, an X–ray light curve for the Seyfert galaxy NGC 5506 (by no means an extreme object) as observed by the ME detector onboard the EXOSAT satellite shown on Fig. 1 illustrates it well. This, and other observations of it, with redshift and a 2 - 10 keV X–ray flux of erg cm-2 s-1, imply a luminosity of erg s-1, corresponding to an Eddington mass of at least . This corresponds to a Schwarzschild radius of cm. The X–ray data show a doubling time of s, corresponding to cm, which, for a black hole, would imply that the X–ray emission arises from a region of radius . This example is by no means extreme – we made a number of assumptions that are probably even too conservative: more realistic assumptions imply a mass of , and . A number of more extreme cases – including very luminous objects – were reported recently on the basis of the ROSAT data by [Boller, Brandt, & Fink (1996)]. These are generally for the so-called “narrow-line Seyfert 1s,” and we will return to those objects later. In brief, a doubling time scale of s for a source with erg s-1 is not uncommon, implying that the bulk of the X–ray emission arises around 10 - 100 . However, the use of the observed variability time scale does not provide an “airtight” argument for the size of the emitting region, since the observed emission may well be anisotropic, yielding an underestimate of the emitting volume, as is almost certainly the case for blazars. We discuss this in more detail later on.

2.2. Kinematic Studies of Active and “Normal” Galaxies Using Optical Emission Lines
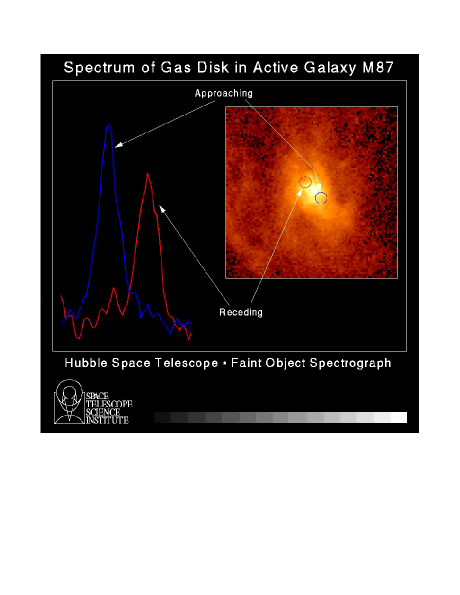
The other line of evidence for the presence of black holes in galaxies (both active and “normal”) is the velocity field of the matter emitting closely to the nucleus. This kind of work has been recently reviewed by [Kormendy & Richstone (1995)], and it dates back to the ground-based observations made in the late 70s, when W. Sargent and collaborators showed that the stellar velocity dispersion in the radio galaxy M 87 increases to 350 km s-1 in the innermost 1.5′′ from the nucleus. M 87 was in fact observed by the Planetary Camera by [Ford et al. (1994)] and the Faint Object Spectrograph by [Harms et al. (1994)] onboard the repaired Hubble Space Telescope, and the images showed the presence of a disk-like structure of ionized gas in the innermost few arc seconds. The spectroscopy provided a measure of the velocity of the gas at an angular distance from the nucleus of 0.25′′ (corresponding to pc, or cm), showing that in the reference frame of the object, it recedes from us on one side, and approaches us on the other, with a velocity difference of km s-1 (see Fig. 2). This implies a mass of the central object of , and besides a black hole, we know of no other form of mass concentration that can “fit” inside this region. As an aside, it is worth noting that M 87 is known to have a relativistic jet perpendicular to the disk structure mentioned above, expanding with the bulk Lorentz factor of 4. As such, this object is probably just a blazar, with the jet oriented at an angle to the line of sight, and thus is probably the closest to a hard evidence that blazars (which we discuss in more detail below) indeed do harbor black holes.
Besides M 87, similar spectroscopy observations done with Hubble Space Telescope revealed high stellar velocities in the central regions of a number of normal galaxies which otherwise show no evidence for an active nucleus. These were summarized recently by [Ford et al. (1998)], and include well-publicized observations (by L. Ferrarese, H. Ford, J. Kormendy and others) of NGC 6251, NGC 4261, NGC 4594, NGC 3115, but doubtless by now probably there are several new objects. Such high velocities in the innermost regions of these galaxies cannot be explained in any other way besides invoking the presence of massive ( ) black holes in their centers. (Interestingly, several of these galaxies also show weak radio jets!) Even for our own Milky Way galaxy, the infrared data and velocity measurements – readily performed from the ground (cf. Eckart & Genzel 1997), at much higher resolution than the HST data for external galaxies – reveal a “modest” nuclear black hole with a mass of . The evidence is building that supermassive black holes are quite common; recent estimates by [Ford et al. (1998)] as well as [Ho et al. (1998)] imply that they inhabit perhaps as many as half of all galaxies, and may well be the “dead quasars” of the past. Active galactic nuclei are thus probably only the “tip of the iceberg” of their population.
2.3. Megamasers in Active Galaxies
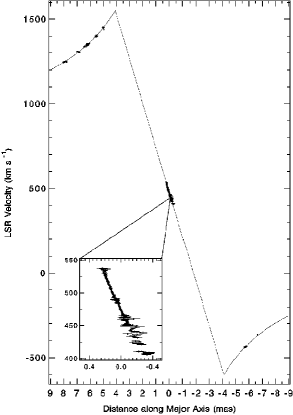
Perhaps the most elegant observation showing the presence of a Keplerian disk around a black hole – and thus capable of measuring the mass of the hole independently of the otherwise uncertain estimates of its distance – was the Very Large Baseline Interferometry observation of megamasers in the vicinity of the nucleus of Seyfert 2 galaxy NGC 4258 reported by [Miyoshi et al. (1995)]. The masing activity can only be observed along a line of sight where the velocity gradient is zero, meaning that these can be seen at locations with masers either between us and their source of energy, or locations at 90o to the line of sight. Indeed, this is the spatial distribution of maser spots around the nucleus of NGC 4258, illustrated in Fig. 3. Specifically, these observations reveal individual masing spots revolving at distances ranging from pc to about twice that around the central object – presumably, again, a black hole – with a mass of . What is truly remarkable about these data is the near-perfect Keplerian velocity distribution, in a slightly warped disk-like formation; this implies that almost all the mass is located well within the inner radius where the megamasers reside. It is not possible to have a cluster of distinct, dark, massive objects responsible for such gravitational potential; at least some of the objects would escape on a relatively short time scale, and form a potential well with a different shape, which would now force a departure of the megamaser–emitting material from pure Keplerian motion (cf. Maoz 1995).
Since we know the central mass quite precisely, NGC 4258 has been a terrific laboratory to study the details of the accretion disk. In particular, this is a relatively low luminosity ( erg s-1) object, making it quite sub-Eddington, with . Such sub-Eddington sources are likely to obey unique solutions of accretion disk structure (see, e.g., Ichimaru 1977; Narayan & Yi 1994; Abramowicz et al. 1995), where the accreting gas is optically thin and radiates inefficiently, and the accretion energy that is dissipated viscously, is advected with the accretion flow. With this, as was argued by [Lasota et al. (1996)], the accretion disk in NGC 4258 can well be advection-dominated (but this does not have to be the case; see, e.g., Neufeld & Maloney 1995). However, it is important to note that such low Eddington rate cannot be universal among quasars; if most of them radiated at such low , the black hole masses of the most luminous sources would be much larger than expected on other grounds. However, an intriguing possibility (cf. Yi 1996) is that quasars in their “youth,” when the black hole masses were more modest, had standard, “cold” (Shakura - Sunyaev) accretion disks, and this is why they were so luminous in the past. The masses of the black holes grew with time, and even if the mass rate supplied for accretion remained constant, actually decreased, and thus the the inner accretion disks switched from “cold” (bright, Shakura - Sunyaev) phase to “hot” (fainter, advection-dominated) phase even if the rate of mass supply did not decrease. This is perhaps why some of the yesterday’s bright quasars are today’s dormant, “dark” black holes, revealed only via the kinematical studies mentioned above.
Nonetheless, NGC 4258 is probably not a unique object. We know of a large class of “low activity” active galaxies, known collectively as “Low Ionization Nuclear Emission Region” objects, or LINERs; they generally have low luminosity, coupled with the absence of the luminous inner disk as evidenced by the emission line ratios. However, unlike the bona fide Seyferts with low luminosity, which seem to vary relatively rapidly in X–rays, implying they are “scaled down” quasars with relatively low mass black holes – LINERs are known not to vary rapidly in any band, suggesting that the low activity is not due to a low black hole mass, but rather due to a low accretion rate (cf. Ptak 1997). As the nuclei of these objects are not very bright, the data are sparse, and thus the details of the radiative processes are poorly known; while workable models exist (see, e.g., Lasota et al. 1996), they still require more work on the details of the transition between the “standard” and advection-dominated regions of the disk.
2.4. Profile of the Fe K Emission Line
Perhaps the most convincing evidence that a strong gravitational field is present in active galactic nuclei comes from the recent measurements of the shape of the Fe K fluorescence line, arising in a geometrically thin, but optically thick accretion disk. This is discussed in more detail by A. Fabian (Chapter 5.3), so what follows is a brief summary. The inner part of the disk is illuminated by X–rays. Because of the relative Cosmic abundances and the fluorescence yields of various elements, the strongest discrete spectral feature predicted from the disk is the 6.4 keV fluorescent Fe K line; the strength (equivalent width) of the line of 150 eV, as measured by [Pounds et al. (1990)], is in fact roughly consistent with predictions of [George & Fabian (1991)]. Since this line arises from matter in motion, its profile is a tracer of the velocity field of the accreting matter.

The Asca observations of the X–ray bright Seyfert galaxy MCG-6-30-15 by Tanaka et al. (1995) indeed showed that the line (see Fig. 4) has a characteristic two-pronged shape expected to arise from matter flowing in a disk-like structure. The matter approaching us is responsible for the blue wing of the line, while that receding produces the red wing, with an additional redshift, since the photons are emitted in a strong gravitational field; the exact shape also depends on the inclination of the disk. A detailed spectral fitting of the line shape indicates that the emitted energy of the line is indeed 6.4 keV, while the bulk of its flux arises at 10 , implying in turn the presence of nearly neutral material very closely to the black hole. The analysis of a number of Seyfert spectra from the Asca archives by [Nandra et al. (1997a)] suggests that many Seyferts indeed show the Fe K line profiles that require an emission close to the black hole, but the quality of data is only modest. Fortunately, a number of more sensitive observatories – such as AXAF, Astro-E, XMM, and Constellation-X, will be launched in the next few years, providing ample opportunities for X–ray observations of effects of strong gravity.
3. Unifying Seyfert 1s and Seyfert 2s: the Orientation Effects
The megamaser source NGC 4258 is only the first of three active galaxies showing a spatial distribution of masing spots from which it is possible to measure the mass of the central object. The other two are the well-known NGC 1068 (Greenhill 1998), and NGC 4945 (Greenhill, Moran, & Herrnstein 1997). Both are also classified as Seyfert 2s, which from the observational side means that they show narrow emission lines, implying velocities on the order of 1,000 km s-1; these lines show no variability, and thus it is generally accepted that they originate in a relatively large regions, on the order of 100 pc or more. Seyfert 1s as well as luminous quasars, on the other hand, exhibit generally very different spectra, with permitted emission lines, and these lines are usually broad, with velocities upwards of 1,500 km s-1, often reaching 30,000 km s-1. This, together with the variability of the lines that is commonly observed on time scales of weeks or months, implies that the broad line region is located much closer to the nucleus than the narrow line region.
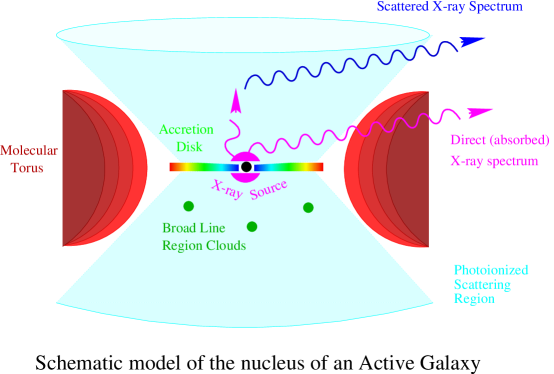
The likely relationship between the two classes of active galaxies was revealed by the seminal observation of the well-known Seyfert 2 galaxy NGC 1068 by Antonucci & Miller (1985). The spectropolarimetric study of the H line revealed that when observed in polarized light, the line is broad. They interpreted the polarization as due to electron scattering by material that is distributed preferentially along the symmetry axis of the system, and advanced the widely accepted scenario explaining the differences between the two types of Seyferts as an orientation effect. This is illustrated in Fig. 5; all Seyfert galaxies are surrounded by a geometrically and optically thick torus, with an inner radius of a fraction of a parsec. Such a torus can be, for instance, the outer regions of a severely warped disk, as recently suggested by M. Begelman and J. Pringle (see Chapter 8.1). When an object is viewed along the axis of the torus, it is a Seyfert 1, revealing all the ingredients of the nucleus: the broad line region and the unobscured X–ray source, both commonly varying on a short time scale. When viewed in or close to the plane of the torus, the broad line region is completely obscured, and the soft end of the X–ray spectrum is absorbed due to the photoelectric absorption by the material in the torus. The opening of the torus contains a “mirror” of ionized gas with free electrons, and these are responsible for the scattering of the broad line light into the line of sight, and hence the broad lines are seen only in polarized light.
In the context of this “unification” model, it is thus not surprising that all three megamasers with measured rotation curves are Seyfert 2 objects: to even observe a megamaser, we have to be located in the plane of material which has large column density and presumably is roughly co-axial with the torus. Likewise, the X–rays traveling closely to the plane of the torus encounter a larger column density, resulting in the greater photoelectric absorption. This is in fact, observed; even early X–ray spectra of Seyferts showed preferentially larger absorption in sources showing only narrow lines (Seyfert 2s), with the broad line region obscured by the same material that absorbs soft X–rays. Note that this is different than the case of only narrow emission lines present in some low-luminosity radio galaxies, such as M 87 (collectively known as the FR-I objects): there, the broad lines cannot be obscured, as we see no evidence of X–ray absorption. Furthermore, while Seyfert 2s sometimes do show highly ionized, narrow permitted lines (in addition to the commonly detected forbidden lines), FR-I objects do not, implying an absence of the very strong isotropic ionizing UV continuum. We will return to this point below.
4. Anisotropy and Doppler Effects: the Case of Blazars
The use of the observed variability time scale does not, however, provide an “airtight” argument for the size of the emitting region, since the observed emission may well be anisotropic, yielding an underestimate of the emitting volume. As pointed out by [Rees (1967)], if the radiating matter moves at a relativistic speed towards the observer, the variability time scale appears shortened by the Doppler effect. Furthermore, the flux of radiation is boosted in the direction of motion of the emitting matter, and thus the total luminosity inferred under an assumption of isotropy is an overestimate. We are nearly certain that this is the case for blazars. This sub-class of quasars consists of sources that generally show strong radio emission and are highly variable and polarized in all observable wavelengths, and also includes members with very weak or absent emission lines, known as BL Lacertae – type objects. High angular resolution radio observations, performed since the late 60s – using Very Long Baseline Interferometry – implied compact radio emission regions, often associated with a rapid change of their structure. With the assumption that the redshifts are indeed cosmological, these structures appeared to expand at transverse speeds exceeding , and in many cases, they had shapes of jets. If the speed of the emitting matter is very relativistic, pointing closely to our line of sight, the apparent superluminal motion is just a projection effect, providing further support for the Doppler-boosting scenario for blazars.
In a number of aspects, blazars are the most extremely active galactic nuclei. Observations of many blazars by the EGRET instrument onboard the Compton Gamma-ray Observatory (CGRO) indicated that usually they are strong emitters in the GeV –ray band; we know of at least 50 such objects. The GeV emission can dominate the overall observed electromagnetic output of these sources, and this is illustrated in Fig. 6 for 3C 279, the first of the ERGET-discovered GeV blazars. In a few cases, the –ray emission has been observed with Cerenkov radiation telescopes to extend as far as the TeV range. This is particularly exciting, as TeV radiation can be observed from the ground, allowing a study of quite exotic phenomena occurring in quasars without the expense of space-borne platforms. Interestingly, we know of no “radio-quiet” MeV or GeV –ray emitting quasars, implying an association of the –rays with the compact radio source and thus a jet.

In many cases, the –ray emission from blazars is variable on a time scale of a day, and recent, simultaneous multi-wavelength monitoring observations indicate that the flux swings are reasonably well correlated between various bands, with the amplitude of variability increasing with the increase of the energy of the observing band. If the emission in the lower energy bands arises from a region co-spatial with that where the –rays originate – and the tracking of light curves in various bands supports this – then the opacity to the - pair production would imply large optical thickness. Similarly, even the early calculations indicated that if the radio sources are as luminous and as compact as the variability data imply, the cooling should be predominantly via the Compton process, with the radiating electrons losing all their energy via upscattering of the just–produced–photons, regardless of the radiation mechanism. Even the large –ray fluxes detected by EGRET are often orders of magnitude lower than the predictions of this self-Compton process. Both these difficulties, however, go away if the radio as well as the GeV emission are both Doppler-boosted, meaning that the true luminosity is lower, and source sizes are greater than inferred under an assumption of isotropy. In fact, we now believe that the entire broad-band continuum is produced in the relativistic jet (cf. Königl 1981; Ulrich et al. 1997), and statistical considerations imply that the bulk Lorentz factors of these jets are on the order of 10 (cf. Vermeulen & Cohen 1994).
For the case of BL Lac – type blazars, the Doppler enhancement (going roughly as a square of ; see, e.g., Appendix A of Sikora et al. 1997) ) is so strong that the continuum completely outshines the emission lines; in some cases, however, it is possible that the emission lines are absent to begin with. In any case, the mechanism for an acceleration and collimation of these powerful jets to such high relativistic speeds is not known, but general considerations of jet energetics are strongly suggestive that this energy is ultimately tapped from an accretion onto a compact object: the best picture today involves the so-called Blandford-Znajek mechanism (Blandford & Znajek 1977), where the power of the jet derives from the spin of the black hole.
4.1. Emission Processes in Blazars
The electromagnetic emission from jets in blazars – recently reviewed by [Sikora (1997)] and Ulrich et al. (1997) – is interesting in its own right, and the comparison of the broad-band spectra of blazars and the “radio-quiet” quasars shows it clearly. The strong GeV component which clearly dominates the spectra of the former (cf. Fig. 6) is entirely absent in the latter, and the relative strength of the GeV emission as compared to that in keV range is often different by a factor of . The radio and optical emission shows polarization, and spectra are always non-thermal. All these facts argue that the radio-through-UV emission is produced by the synchrotron process, with ultrarelativistic electrons (with or more) radiating in magnetic field on the order of a Gauss. The Compton upscattering of lower energy photons mentioned above is indeed present - and most current models suggest that it is responsible for the radiation observed above a few keV. In the lineless BL Lac type objects, we have no evidence for any strong external radiation field, and the dominant “seed” photons for Compton upscattering are likely to be produced by the synchrotron process internally to the jet. As was shown by [Dermer, Schlikheiser, & Mastichiadis (1992)] as well as by [Sikora, Begelman, & Rees (1994)] and [Blandford & Levinson (1995)], in blazars with emission lines, the external, diffuse radiation dominates; since this radiation is isotropic in the stationary frame, it appears Doppler-boosted in the frame of the jet.
This scenario predicts that there should be many objects with jets pointing farther away, up to the right angle to our line of sight. We now believe that for the quasar-type blazars, with strong emission lines, these are the giant, powerful radio galaxies. The difference between the quasar-type and BL Lac type blazars may well be related to the presence of the inner, extremely luminous accretion disk in the former. As suggested by M. Begelman, and, more recently [Reynolds et al. (1996)], some radio galaxies (as, for instance, M 87) have massive black holes, yet relatively modest luminosity, and essentially no broad emission lines; this might argue for a very sub-Eddington accretion rate, with a likelihood of an advection-dominated inner accretion disk. An intriguing possibility is that these low-luminosity radio galaxies are the “misdirected” BL-Lac - type blazars: the absence of the inner, luminous disk would then be responsible for the absence of the strong ionizing radiation and thus broad emission lines. This in turn would mean that in BL Lac - type blazars, there are no external photons to act as “seeds” to be Comptonized by the relativistic electrons in the jet, and the only “seed” photons are internal, produced by the synchrotron process.
4.2. Origin of the Difference Between “Radio-Quiet” Active Galaxies and Blazars
We are nearly certain that there is a clear intrinsic distinction between the jet-dominated blazars, and the more common, radio-quiet quasars. However, the reason for the different behavior of these two subclasses is far from certain, and this is primarily because we do not have a good understanding of the formation and acceleration of relativistic jets. Even though we cannot use the causality arguments to infer the presence of black holes in blazars solely from their variability – since we do not know for sure as to what extent the true variability time scales are shortened by Doppler boosting – more indirect evidence implies that ultimately, accretion onto a black hole powers blazars as well. As to the difference between the two categories, perhaps the most appealing scenario, advanced by [Wilson & Colbert (1995)], as well as by [Moderski, Sikora, & Lasota (1998)], is where the two classes differ by strong or weak spin of the black hole; again, the jet is formed and powered by tapping the rotational energy of the hole. This is somewhat similar to the distinction between the Galactic binary “microquasars” suggested by [Zhang, Cui, & Chen (1997)], discussed in Chapter 2.1 (by P. Charles). Nonetheless, this is an area of very active research where no clear conclusions have been reached. In particular, if the shape of the fluorescence Fe K line seen in the Seyfert galaxy MCG-6-30-15 (see above) and possibly in other Seyferts (Nandra et al. 1997a) indeed requires that the cold material powering the nucleus flows via a disk-like structure, this implies that the fluorescence occurs at at a distance . Since the last stable orbit in a non-rotating (Schwarzschild) black hole is at 3 and beyond this, the matter is in a free fall, this would imply that the black hole is spinning (Kerr), where the last stable orbit can be substantially closer to the black hole, depending on its spin. However, we note that an alternative scenario, advanced by [Reynolds & Begelman (1998)] does not require a disk at ; nonetheless, this still requires X–ray emission at least at or just beyond 3 , merely eliminating the requirement of spinning black hole, but it still implies that at least a non-rotating black hole is present.
5. Zooming in on a Supermassive Black Hole: High Energy Spectra of Radio-Quiet Active Galaxies
As we mentioned above, active galaxies are generally variable, and the most rapid variability is observed in the X–ray and –ray bands; since we are interested in understanding the regions closest to the black hole, these bands deserve the most detailed study. A recent, excellent article by Mushotzky, Done, & Pounds (1993) reviewed the X–ray spectra of AGN; however, this covered the status of observations before the results from CGRO became available, while we do include these results here. The most conclusive results are gleaned by a study of the non-blazar active galaxies, to avoid any potential contamination by the jet. Since no radio-quiet (= jet-less) active galaxy was detected above several hundred keV, the most relevant spectral region is the X–ray and soft –ray bands. This covers nearly four decades in energy, from keV to MeV, and often requires observations with multiple satellites, which must be made simultaneously, since active galaxies are variable in all bands.
The early X–ray observations of active galaxies by [Mushotzky (1980)], [Halpern (1982)], and [Rothschild et al. (1983)] implied that, to the first order, X–ray spectra of active galaxies are power laws with the energy index (defined such that the flux density ) of about 0.7, modified by photoelectric absorption at the low energy end. A major advance came from sensitive observations with the ROSAT and Ginga satellites (covering respectively the bands of 0.1 to 2, and 2 to 30 keV), revealing that the spectra are more complex, with a somewhat softer underlying continuum, with . This continuum is modified by photoelectric absorption in the host galaxy of the quasar; the absorbing material can be either cold, or partially ionized, and this manifests itself as isolated edges, most notably of oxygen, seen in the ROSAT (and more recently, also in Asca) data. The Ginga spectra, reported by [Pounds et al. (1990)], showed a strong emission line at the rest energy of keV, presumably due to fluorescence of the K shell of iron, and a hardening above keV. These last two features were interpreted as signatures of reprocessing (“reflection”) of the primary continuum in the cold material that is accreting onto the nucleus. The Fe K line is indeed the strongest expected, via the combination of the relatively high abundance of iron (decreasing with the atomic number ), and fluorescence yield (increasing with ); as pointed out by [Makishima (1986)], the line equivalent width as measured by Ginga is too high to be produced in absorbing material of any column.
Reprocessing by the matter that accretes onto the black hole is thus the most viable alternative. The hardening, predicted earlier in a seminal paper by Lightman & White (1988), arises as an additional spectral component, due to Compton reflection from cold matter. This is produced roughly at one Thomson depth, or when the equivalent hydrogen column density is cm-2. The cosmic abundances of elements are such that at low energies, the photoelectric absorption dominates, and unless the accreting matter is substantially ionized, this component emerges only above the last significant absorption edge, again from iron. The strengths of the reflection component and the line are in fact in agreement with theoretical predictions by [George & Fabian (1991)]. With the intensity of the incident X–rays greatest closely to the central source (as inferred from the variability of the continuum), its kinematic and gravitational Doppler shifts are powerful diagnostics of the immediate circumnuclear region.
5.1. A Working Template: Spectrum of Seyfert 1 IC 4329a
Perhaps the brightest bona fide Seyfert 1 on the sky is the luminous object IC 4329a, and it has been observed simultaneously with the ROSAT (0.2 - 2 keV) and CGRO OSSE (50 - 1000 keV) (Fabian et al. 1993; Madejski et al. 1995). This left a gap between and keV, so the observations were supplemented by non-simultaneous data obtained by Ginga a few years earlier; the Ginga data were renormalized to match the ROSAT flux at 2 keV, so this combined data set provided a good representation of a broad band high energy spectrum of a Seyfert 1, and is illustrated in Fig. 7. The data indeed showed a modest photoelectric absorption due to neutral material (most likely the ISM of the host galaxy), plus an additional modest column of ionized absorber. Beyond keV, the spectrum is the primary continuum, with . At 6.4 keV, there is a strong Fe K line, which in the case of IC 4329a and many other Seyfert galaxies is broad, with of at least 200 eV. The detailed studies of this line in another object, MCG-6-30-15 [Tanaka et al. (1995)], show the characteristic two-pronged shape, implies relativistic motion in an accretion disk inclined to the line of sight as discussed above.

The region beyond the Fe K line shows general hardening of the spectrum, accompanied by the pseudo-edge due to Fe K; this is a signature of Compton reflection, as discussed above. The intensity of this component is consistent with the reflector being a semi-infinite plane; it peaks at keV, and beyond this, it steepens gradually, most likely due to the Compton recoil as well as the Klein-Nishina effects. Of course the underlying power law also can steepen there – we only observe a sum of the primary and reflected spectrum. The detailed fits (spectral decomposition) of the data imply that the primary spectrum is consistent with the power law having an exponential cutoff at an e-folding energy of keV. The recent simultaneous RXTE and OSSE observations of this object generally confirm this picture. A very important constraint on any theoretical models for radiation processes in active galaxies is the absence of strong annihilation line at 511 keV.
Is this high energy spectrum of IC 4329a unique? Given the variability of active galaxies, simultaneous observations in X–rays and soft –rays are required, but these are sparse; an alternative approach by [Zdziarski et al. (1995)] is to co-add many non-simultaneous observations. This in fact produced an average spectrum that is remarkably similar to the above picture, and thus any theoretical interpretation of the data for IC 4329a is probably valid for Seyfert nuclei in general.
5.2. The “Ultra-soft” Seyfert 1s: the Question of the “Soft Excess”
It is important to note that luminous objects similar to IC 4329a are a majority of Seyfert 1s, but there is one important sub-class of Seyferts that shows decidedly distinct X–ray spectra, differing from the above description in soft X–rays, below keV. These are the so-called “ultra-soft” Seyferts. First observed in the HEAO data by S. Pravdo and collaborators, they were suggested to be a possibly distinct class of active galaxies by F. Cordova on the basis of the Einstein Observatory Imaging Proportional Counter data. The EXOSAT data analyzed by [Arnaud et al. (1985)] as well as by [Turner & Pounds (1989)] showed that in a number of active galaxies, the extrapolation of the hard power law towards low energies (taking properly into consideration the absorption from our own Galaxy) underpredicted the soft X–ray flux, indicating that there is an additional component of X–ray emission. This, the so-called “soft excess,” meant that in a given object, the ultra-soft component can co-exist with the hard power law, implying that active galaxies generally have two-component power law spectra, where either or both components are visible. It is important to note that this component appears in both low- and high-luminosity sources; for instance, it was observed in the Einstein Observatory data in the quasar PG 1211+143 by [Elvis, Wilkes, & Tananbaum (1985)]. For the sources where both components are present, they intersect at keV (but this may be an observational artifact); the spectrum of the soft component is very soft (steep), and can be described as a power law with an index or even steeper (but a power law is usually not a unique model), while the hard component has just the “canonical” hard Seyfert 1 spectrum with .
In the very few cases that the variability of both components has been measured, it appears that the two vary independently, showing no correlation between them (see, e.g., the case of Mkn 335 in Turner 1988). On the other hand, such a lack of correlated variability may be the result of a complex spectral deconvolution procedure, since only a tail of the soft excess component is observable due to intervening absorption in the ISM of the host, or our own Galaxy. In fact, a correlation of UV and EUV fluxes was clearly observed in the “soft excess” Seyfert NGC 5548 (Marshall et al. 1997). This implies some coupling of the soft excess component to the UV/X–ray reprocessing cycle discussed in more detail in Section 6 below. Similar correlation has been also detected in that source between the UV flux and soft X–ray residuals observed simultaneously in Ginga spectra (cf. Magdziarz et al. 1998). Since the EUV observations suggest much higher variability amplitude than the UV data, the lack of apparent correlation in fainter sources may be related to either variation of the cut off energy of the tail of the soft excess, or confusion with spectral index variations in the hard component.
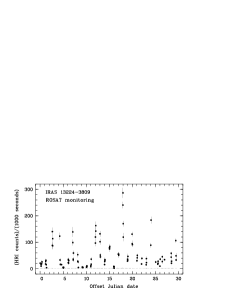
“Ultra-soft” Seyferts appear to be quite common in the ROSAT all-sky survey, which is not surprising, since ROSAT is a very sensitive instrument below 2 keV. Detailed follow-up studies by [Boller, Brandt, & Fink (1996)] showed a very interesting result: the optical/UV emission lines in these objects are generally quite narrow, with the widths on the order of 1,000 - 3,000 km s-1, as compared to 5,000 km s-1 for “normal” Seyfert 1s. These are not similar to Seyfert 2s at all; these are widths of permitted lines, while Seyfert 2s only rarely show permitted lines. Important clues to the nature of these soft components may be in the variability patterns, although only very few well-sampled light curves exist. The EXOSAT data were consistent with the hard X–ray variability that is aperiodic but linear, meaning that the time series can be described as uncorrelated noise (cf. Czerny & Lehto 1997); an example of a light curve for this is shown in Fig. 1. The variability of soft X–rays, on the other hand, is often “episodic,” with large flares (up to a factor of 100!) (see Fig. 8 for an example), and decidedly non-linear (cf. Boller et al. 1997). (In this case a “non-linear” behavior manifests itself qualitatively in an episodic, flare-like behavior such as that illustrated in Fig. 8; see, e.g., Vio et al. 1992. Quantitatively, a “non-linear” time series is a positive, definite one, which has the ratio of its standard deviation to its mean which is larger than unity; see, e.g., Green 1993.) This difference may imply different emission mechanisms in the hard and soft X–ray components; however two observational effects have to be considered before drawing any conclusions. First, the observational noise or/and presence of additional higher frequency variability in the hard component may effectively dissolve apparent signatures of non-linearity (cf. [Leighly & O’Brien 1997]). Second, if the variability related to the energy reprocessing does indeed originate from variations of the soft excess component (e.g., Magdziarz et al. 1998), then the signatures of non-linearity should be suppressed in the UV and the hard continuum.
Early modeling attempted to describe the “soft excess” as the tail end of the thermal, multi-blackbody emission from an accretion disk; however, this seems not to be the case, at least for the bright and well-studied NGC 5548. Magdziarz et al. (1998) have shown that the UV component in that object may be associated with rather cold disk continuum, with a temperature on the order of a few eV, while the soft excess requires a separate spectral component. We will return to this below.
5.3. High Energy Spectra of Seyfert 2s vs. Seyfert 1s
As it was mentioned above, the popular “unification” picture explains the differences between the spectra of Seyfert 1s vs. Seyfert 2s as due to the orientation effects. To the first order, the only difference that should be seen in the X–ray spectra of the two classes is the amount of photoelectric absorption, while the underlying continuum should be the same. Just as in the case of Seyfert 1s, this requires simultaneous observations by multiple satellites, only the problem is more acute here, as the large amount of absorption leaves generally fewer soft X–ray photons to allow for a sensitive measurement of the continuum. Nonetheless, the observations with the Ginga satellite by [Awaki et al. (1991)] revealed that X–ray spectra of Seyfert 2s are in fact equivalent to spectra of Seyfert 1s, absorbed by various column densities of cold gas. More detailed studies by [Smith & Done (1996)] implied that the continua of Seyfert 2s may be somewhat harder, but only marginally so; a more conclusive results should be obtained from observations by the Rossi X–ray Timing Explorer, which features a broader bandpass, extending to 50 keV (or, for brighter sources, even to 100 keV).

In any case, the inferred column densities in Seyfert 2s are cm-2 or more. In a few cases – as, for instance, the well-studied NGC 1068 – we only know that no primary X–ray continuum is seen, so the absorber must be quite Thomson-thick, with the absorbing column greater than cm-2. A good, illustrative example of a nearly-extreme Seyfert 2 – but, with the primary continuum still barely penetrating the absorber – is NGC 4945, a Seyfert 2 which also shows megamaser emission, and thus is most likely observed in the plane of the putative torus. In the Asca and Ginga ranges (below keV), the source is relatively faint, but above keV, the spectrum rises sharply ([Iwasawa et al. 1993]). OSSE observations of it by [Done, Madejski, & Smith (1996)] revealed that at 50 - 100 keV, this is the second brightest radio-quiet active galaxy in the sky (see Fig. 9). The absorbing column is large, cm-2, and while the observations were not simultaneous, a comparison of Fig. 7 and Fig. 9 reveals that the underlying continuum, to the first order, is consistent with that of a Seyfert 1. Another interesting aspect of this source is the fact that the megamaser distribution implies a mass of the black hole of Mo (Greenhill et al. 1997). With the bolometric luminosity of the nucleus of at least erg s-1 (Iwasawa et al. 1993; Done et al. 1996), this source radiates at a few percent of Eddington luminosity, and thus is unlikely to be advection-dominated, as may be the case for NGC 4258.
5.4. High Energy Spectra of High Luminosity Sources
So far, we discussed primarily the relatively low-luminosity quasars, and an obvious question to be asked is: does this general picture hold for the higher luminosity counterparts? In general, the answer is yes, but with some modifications. It is important here to compare “apples to apples,” and in the case of quasars, this means selecting radio-quiet objects, as radio-loud quasars tend to have higher X–ray – to – optical flux ratios, which may be due to a contamination by a possible jet; unfortunately, this paucity of X–ray photons in the radio-quiet objects makes spectral studies somewhat more difficult. In general, the more luminous objects show a lower ratio of X–ray to optical luminosities (see, e.g., Kriss & Canizares 1985; Avni & Tananbaum 1986). The recent work by Laor et al. (1997) (using the ROSAT PSPC data) and [Nandra et al. (1997b)] (using Asca data) indicates that the continuum X–ray spectra of higher luminosity objects appear generally similar to those of the lower luminosity counterparts. Notable exception is an absence of the Fe K line and the Compton reflection component in quasars (see, e.g., Nandra et al. 1997b). With the more luminous central source, this may be the result of a nearly-complete ionization of the accreting material, such that the reflection component is present, but cannot be distinguished by its tell-tale Fe K line and spectral hardening above keV: for an entirely ionized reflector, the incident or emerging photons encounter no photoelectric absorption, and the reflection is (below keV) identical to the incident spectrum, with no Fe K line present. Unfortunately, those quasars are generally too faint to be studied in detail above keV, where the only instruments currently available are non-imaging proportional counters such as the RXTE, dominated by uncertainties of the instrumental as well as the Cosmic X–ray Background. As a result, any detailed studies must await X–ray reflective optics sensitive beyond 10 keV, already under development; such telescopes are essential for studies of these faint objects, as they permit subtraction of background from the same image as the source, and thus will yield the best quality data for luminous quasars.
6. Radiation Processes in Radio-Quiet Active Galaxies
The availability of good quality high energy spectra permits us to constrain the possible emission mechanisms that can operate in active galaxies. We briefly discussed the case of blazars above; observationally, the continuum high energy spectra of radio-quiet objects are also decidedly non-thermal, but these mechanisms are probably somewhat different than the synchrotron + Compton model discussed for the blazar jets. The early work by [Sunyaev & Titarchuk (1980)], using the diffusion approximation, suggested that a power-law spectrum can be produced by a repeated Compton-upscattering of soft photons by a Compton-thick bath of hot electrons. A more general variant of this model is essentially what is used today to explain the primary, high energy spectrum in these objects as well as in the Galactic black hole candidates. In summary, a successful model has to explain a power law spectrum with an energy index of 0.9 – 1, exponentially cutting off at keV: other spectral features are merely signatures of reprocessing.
There are essentially two flavors of the Comptonization model that can be applied to the isotropic emission in quasars: the original thermal Comptonization version, and a non-thermal variant. The difference between the two is related to the distribution of electron energies. The non-thermal version, developed by A. Zdziarski, A. Lightman, P. Coppi, as well as by C. Done, R. Svensson, G. Ghisellini, and A. Fabian (Zdziarski et al. 1990; Zdziarski & Coppi 1991) involves acceleration of particles to relativistic energies, and a subsequent pair cascade; these particles Comptonize UV photons, believed to be produced in abundance by the accretion disk. The attractive feature of this model is that the pairs thermalize to relatively low temperatures ( a few keV), providing the medium which, again, upscatters the UV photons to form the “soft excess” discussed above.
One feature, however, predicted by this version of the model, is the annihilation line that should be present at keV. No spectrum of any active galaxy collected so far with the CGRO OSSE detector showed such a feature (Johnson et al. 1997), and thus the model is somewhat out of favor, despite its natural ability to provide the “soft excess.” Refinements to the thermal Comptonization model, primarily by [Poutanen & Svensson (1996)], allowed the quasi-analytical calculation in the optically thin - to intermediate regime. This is the most viable current model for radio-quiet active galaxies, and is discussed in more detail in Chapter 5.3 by J. Poutanen. Roughly, for regime relevant to the hard X–ray spectra of Seyferts, the energy of the exponential cutoff determines the temperature of the Comptonizing plasma, such that , while the index of the power law, together with the cutoff, determine its optical depth , such that / (Pietrini & Krolik 1995; Poutanen, Krolik, & Ryde 1997). For Seyferts, the Comptonizing plasma has to have a temperature of keV, and optical depth 1; the soft “seed” photons are available in abundance from the inner accretion disk, as evidenced by the presence of the reflection component (Zdziarski et al. 1997). However, a simple “sandwich” type structure (with a cold disk covered by a uniform corona) cannot work, as this would produce too many “seed” photons for Comptonization. Instead, an example of a good phenomenological model is a “patchy corona” above a surface of the disk, proposed by Haardt, Maraschi, & Ghisellini (1994); however, none of these models address the processes responsible for the particle acceleration.
The issue of the “soft excess” remains unresolved in the context of the above models. Spectral fitting to the data for the well-studied NGC 5548 imply that the soft excess can be produced by a relatively cold ( eV) but optically thick () plasma, while the hard continuum requires keV, but (Magdziarz et al. 1998). Coexistence of such two phases may be related to the disk structure and dynamics of possible multi-phase transition regions (see, e.g., Magdziarz & Blaes 1998). In fact, such multi-phase medium appears naturally in local solutions of the disk corona transition layer (see, e. g., [Różańska 1998]). However, without high quality observational data on the spectral shape and temporal correlation between both components, so far, we lack clear clues as to the time evolution of the plasma energetics. The author’s prejudice (based partially on the “episodic” nature of the soft light curves) is that we probably witness some form of a limit cycle operating in the inner disk, and thus the best avenue for this is a development of a more detailed theory for the structure of the inner accretion region, and in particular, the issue of stability of the transition region between the bona fide disk and the matter free-falling onto the black hole. However, any tests of theories require sensitive observations: especially needed are well-sampled light curves obtained simultaneously over a broad energy range, from the softest energies accessible ( keV) up to the end of the observable spectrum, in the MeV range. The prospects for such observations are very good: with the impending launch of AXAF, XMM, Astro-E, Integral, and, eventually, Constellation-X, we should have the data for the more definitive modeling.
Acknowledgements: The author wishes to acknowledge helpful comments from Drs. J. Krolik, P. Magdziarz, C. Done, E. Boldt, and M. Sikora, and figures from Drs. W. Brandt, K. Nandra, and L. Greenhill.
References
- Abramowicz et al. 1995 Abramowicz, M., Chen, X., Kato, S., Lasota, J. P., & Regev, O. 1995, ApJ, 438, L37
- Antonucci & Miller (1985) Antonucci, R. R. J, & Miller, J. S. 1985, ApJ, 297, 621
- Arnaud et al. (1985) Arnaud, K. A., et al. 1985, MNRAS, 217, 105
- Avni & Tananbaum 1986 Avni, Y., & Tananbaum, H. 1986, ApJ, 305, 83
- Awaki et al. (1991) Awaki, H., Koyama, K, Inoue, H., & Halpern, J. 1991, PASJ, 43, 195
- Blandford & Levinson (1995) Blandford, R. D., & Levinson, A. 1995, ApJ, 441, 79
- Blandford & Znajek (1977) Blandford, R. D., & Znajek, R. L. 1977, MNRAS, 179, 433
- Boller, Brandt, & Fink (1996) Boller, T., Brandt, W. N., & Fink, H. 1996, A&A, 305, 53
- Boller et al. (1997) Boller, T., Brandt, W. N., Fabian, A. C., & Fink, H. 1997, MNRAS, 289, 393
- Czerny & Lehto 1997 Czerny, B., & Lehto, H. 1997, MNRAS, 285, 365
- Dermer, Schlikheiser, & Mastichiadis (1992) Dermer, C., Schlikheiser, R., & Mastichiadis, A. 1992, A&A, 256, L27
- Done, Madejski, & Smith (1996) Done, C., Madejski, G. M., & Smith, D. 1996, ApJ, 463, L63
- Eckart & Genzel (1997) Eckart, A., & Genzel, R. 1997, MNRAS, 284, 576
- Elvis, Wilkes, & Tananbaum (1985) Elvis, M., Wilkes, B., & Tananbaum, H. 1985, ApJ, 292, 357
- Fabian et al. (1993) Fabian, A., Nandra, K., Celotti, A., Rees, M., Grove, E., & Johnson, W. 1993, ApJ, 416, L57
- Ford et al. (1994) Ford, H. C., et al. 1994, ApJ, 435, L27
- Ford et al. (1998) Ford, H. C., Tsvetanov, Z. I., Ferrarese, L., & Jaffe, W. 1998, in The Central Regions of the Galaxy and Galaxies, proc. IAU Symp. 184, in press
- George & Fabian (1991) George, I. M., & Fabian, A. C. 1991, MNRAS, 249, 352
- Green 1993 Green, A. 1993, PhD Thesis, University of Southampton, UK
- Greenhill (1998) Greenhill, L. J. 1998, in Radio Emission from Galactic and Extragalactic Compact Sources, proc. IAU Coll. 164, eds. J. Zensus et al., ASP Conference Series, in press.
- Greenhill, Moran, & Herrnstein (1997) Greenhill, L. J., Moran, J. M., & Herrnstein, J. R. 1997, ApJ, 481, L23
- Haardt, Maraschi, & Ghisellini (1994) Haardt, F., Maraschi, L., & Ghisellini, G. 1994, ApJ, 432, L95
- Halpern (1982) Halpern, J. 1982, PhD Thesis, Harvard University
- Harms et al. (1994) Harms, R., et al. 1994, ApJ, 435, L35
- Ho et al. (1998) Ho, L. C., 1998, in The Central Regions of the Galaxy and Galaxies, proc. IAU Symp. 184, in press
- Ichimaru 1987 Ichimaru, S. 1987, ApJ, 214, 840
- Iwasawa et al. 1993 Iwasawa, K., et al. 1993, ApJ, 409, 155
- Iwasawa et al. (1998) Iwasawa, K., Fabian A. C., Brandt W. N., Kunieda H., Misaki K., Reynolds C. S., & Terashima Y. 1998, MNRAS, submitted
- Johnson et al. (1997) Johnson, W. N., Zdziarski, A. A., Madejski, G. M., Paciesas, W. S., Steinle, H., & Lin, Y.-C. 1997, in Proceedings of the Fourth Compton Symposium, eds. C. D. Dermer, M. S. Strickman, & J. D. Kurfess (AIP: New York), AIP Conference Proceedings 410, p. 283
- Königl (1981) Königl, A. 1981, ApJ, 243, 700
- Kormendy & Richstone (1995) Kormendy, J., & Richstone, D. 1995, ARA&A, 33, 581
- Kriss & Canizares 1985 Kriss, G. A., & Canizares, C. 1985, ApJ, 297, 177
- Krolik, Done, & Madejski (1993) Krolik, J., Done, C., & Madejski, G. 1993, ApJ, 402, 432
- Laor et al. (1997) Laor, A., Fiore, F., Elvis, M., Wilkes, B., & McDowell, J. 1997, ApJ, 477, 93
- Lasota et al. (1996) Lasota, J.-P., Abramowicz, M., Chen, X., Krolik, J., Narayan, R., & Yi, I. 1996, ApJ, 462, 142
- Leighly & O’Brien 1997 Leighly, K., & O’Brien, P. 1997, ApJ, 481, L15
- Lightman & White (1988) Lightman, A. P., & White, T. 1988, ApJ, 335, 57
- Madejski et al. (1995) Madejski, G. M., et al. 1995, ApJ, 438, 672
- Madejski et al. (1993) Madejski, G. M., et al. 1993, Nature, 365, 626
- Magdziarz et al. (1998) Magdziarz, P., Blaes, O., Zdziarski, A., Johnson, W., & Smith, D. 1998, MNRAS, in press
- Magdziarz & Blaes (1998) Magdziarz, P., & Blaes, O. 1998, in Proc. IAU Symp. 188, Kyoto, Japan, in press
- Makishima (1986) Makishima, K. 1986, in The Physics of Accretion onto Compact Objects, ed. K. Mason, M. Watson, & N. White (Springer-Verlag: Berlin), p. 249
- Maoz 1995 Maoz, E. 1995, ApJ, 447, L91
- Maraschi et al. (1994) Maraschi, L., et al. 1994, ApJ, 435, L91
- Marshall et al. 1997 Marshall, H. L., et al. 1997, ApJ, 479, 222
- McHardy 1989 McHardy, I. 1989, in Two Topics in X–ray Astronomy, Proc. 23rd ESLAB Symp., eds. N. White, J. Hunt & B. Battrick, (ESA Publications: Paris), vol. SP-296, p. 1111
- Miyoshi et al. (1995) Miyoshi, M., et al. 1995, Nature, 373, 127
- Moderski, Sikora, & Lasota (1998) Moderski, R., Sikora, M., & Lasota, J.-P. 1997, in Relativistic Jets in AGNs, eds. M. Ostrowski et al. (Astronomical Observatiory of the Jagiellonian University: Krakow) p. 110
- Mushotzky (1980) Mushotzky, R. F. 1980, Adv. Sp. Res., 3, 10
- Mushotzky, Done, & Pounds (1993) Mushotzky, R. F., Done, C., & Pounds, K. A. 1993, ARA&A, 31, 717
- Nandra et al. (1997a) Nandra, K., George, I., Mushotzky, R. F., Turner, T. J., & Yaqoob, T. 1997a, ApJ, 477, 602
- Nandra et al. (1997b) Nandra, K., Mushotzky, R. F., George, I., Turner, T. J., & Yaqoob, T. 1997b, ApJ, 488, L91
- Narayan & Yi 1994 Narayan, R., & Yi, I. 1994, ApJ, 428, L13
- Neufeld & Maloney 1995 Neufeld, D. A., & Maloney, P. R. 1995, ApJ, 447, L17
- Papadakis & Lawrence 1995 Papadakis, I. E., & Lawrence, A. 1995, MNRAS, 272, 161
- Papadakis & Lawrence 1993 Papadakis, I. E., & Lawrence, A. 1993, Nature, 361, 250
- Pietrini & Krolik 1995 Pietrini, P., & Krolik, J. 1995, ApJ, 447, 526
- Pounds et al. (1990) Pounds, K., Nandra, K., Stewart, G., George, I., & Fabian, A. 1990, Nature, 344, 132
- Poutanen & Svensson (1996) Poutanen, J., & Svensson, R. 1996, ApJ, 470, 249
- Poutanen, Krolik, & Ryde 1997 Poutanen, J., Krolik, J., & Ryde, F. 1997, in Proceedings of the Fourth Compton Symposium, eds. C. D. Dermer, M. S. Strickman, & J. D. Kurfess (AIP: New York), AIP Conference Proceedings 410, p. 972
- Ptak (1997) Ptak, A. 1997, PhD thesis, University of Maryland, College Park, MD
- Rees (1967) Rees, M. J. 1967, MNRAS, 135, 345
- Reynolds et al. (1996) Reynolds, C., DiMateo, T., Fabian, A., Hwang, U., & Canizares, C. 1996, MNRAS, 283, L111
- Reynolds & Begelman (1998) Reynolds, C., & Begelman, M. C. 1998, ApJ, in press
- Rothschild et al. (1983) Rothschild, R. E., Mushotzky, R. F., Baity, W. A., Gruber, D. E., Matteson, J. L., & Peterson, L. E. 1983, ApJ, 269, 423
- Różańska 1998 Różańska, A., 1998, MNRAS submitted
- Salpeter (1964) Salpeter, E. E. 1964, ApJ, 140, 796
- Schmidt (1963) Schmidt, M. 1963, Nature, 197, 1040
- Sikora (1997) Sikora, M., 1997, in Proceedings of the Fourth Compton Symposium, eds. C. D. Dermer, M. S. Strickman, & J. D. Kurfess (AIP: New York), AIP Conference Proceedings 410, p. 494
- Sikora, Begelman, & Rees (1994) Sikora, M., Begelman, M. C., & Rees, M. 1994, ApJ, 421, 153
- Sikora et al. (1997) Sikora, M., Madejski, G. M., Moderski, R., & Poutanen, J. 1997, ApJ, 484, 108
- Smith & Done (1996) Smith, D., & Done, C. 1996, MNRAS, 280, 355
- Sunyaev & Titarchuk (1980) Sunyaev, R., & Titarchuk, L. 1980, A&A, 86, 121
- Tanaka et al. (1995) Tanaka, Y., et al. 1995, Nature, 375, 659
- Turner (1988) Turner, T. J. 1988, PhD Thesis, University of Leicester, UK
- Turner & Pounds (1989) Turner, T. J., & Pounds, K. 1989, MNRAS, 240, 833
- Ulrich, Maraschi, & Urry (1997) Ulrich, M.-H., Maraschi, L., & Urry, C. M. 1997, ARA&A, 35, 445
- Vermeulen & Cohen (1994) Vermeulen, R. C., & Cohen, M. H. 1994, ApJ, 430, 467
- Vio et al. 1992 Vio, R., Cristiani, S., Lessi, O., & Provenzale, A. 1992, ApJ, 391, 518
- Wilson & Colbert (1995) Wilson, A., & Colbert, E. 1995, ApJ, 438, 62
- Yi 1996 Yi, I. 1996, ApJ, 473, 645
- Zdziarski et al. (1990) Zdziarski, A. A., Ghisellini, G., George, I. M., Svensson, R., Fabian, A. C., & Done, C. 1990, ApJ, 363, L1
- Zdziarski & Coppi (1991) Zdziarski, A., & Coppi, P. 1991, ApJ, 376, 480
- Zdziarski et al. (1995) Zdziarski, A. A., Johnson, W. N., Done, C., Smith, D., & McNaron-Brown, K. 1995, ApJ, 438, L63
- Zdziarski et al. 1997 Zdziarski, A. A., Johnson, W. N., Poutanen, J., Magdziarz, P., & Gierlinski, M. 1997, in The Transparent Universe, eds. C. Winkler at al. (ESA: Paris), SP-382, 373
- Zeldovich & Novikov (1964) Zeldovich, Y., & Novikov, I. 1964, Sov. Phys. Dokl., 158, 811
- Zhang, Cui, & Chen (1997) Zhang, S. N., Cui, W., & Chen, W. 1997, ApJ, 482, L55