Redshift Distribution of the Faint Submillimeter Galaxy Population
Abstract
We present a Keck II LRIS spectroscopic follow-up study of the possible optical counterparts to a flux-limited sample of galaxies selected from an 850-m survey of massive lensing clusters using the SCUBA bolometer array on the JCMT. These sources represent a population of luminous dusty galaxies responsible for the bulk of the 850-m background detected by COBE and thus for a substantial fraction of the total far-infrared emission in the Universe. We present reliable redshifts for 20 galaxies and redshift limits for a further four galaxies selected from the error-boxes of 14 submillimeter (submm) sources. Two other submm detections in the sample have no obvious optical counterparts, and the final submm source was only identified from imaging data after the completion of our spectroscopic observations. The optical identifications for 4 of the submm sources have been confirmed through either their detection in CO at mm-wavelengths (two pairs of galaxies at and ) or from the characteristics of their spectral energy distributions (two of the central cD galaxies in the lensing clusters). Plausible arguments based on the optical spectral properties (starburst or AGN signatures) of the counterparts allow us to identify a further two likely counterparts at and 1.16. For the remaining 8 cases, it is not always clear which, if any, of the optical sources identified are the true counterparts. Possible counterparts for these have redshifts ranging from to . The application of a range of techniques, including near- and mid-infrared imaging and radio mapping, will assist in the identification of the true sources of the submm emission, while CO line mapping with current mm-interferometers and hard X-ray observations should aid in the determination of the nature of their emission. Working with the current identifications, we suggest that the majority of the extragalactic background light in the submm is emitted by sources at and hence that the peak activity in highly-obscured sources (both AGN and starbursts) lies at relatively modest redshifts. We find that a lower limit of 20 per cent of the submm sources in our sample show some sign of AGN activity; however, we caution that this does not necessarily translate into a 20 per cent AGN contribution to the measured submm emission from these sources.
Subject headings:
cosmology: observations — galaxies: distances and redshifts — galaxies: evolution — galaxies: formation — galaxies: active — galaxies: starburst1. Introduction
The cumulative emission from all objects lying beyond the Galaxy, the extragalactic background light (EBL), provides important constraints on the integrated star formation history of the Universe. The recent measurement of the EBL at far-infrared (FIR) and submm wavelengths using data from the FIRAS and DIRBE experiments on the COBE satellite (Puget et al. 1996; Guiderdoni et al. 1997; Schlegel et al. 1998; Fixsen et al. 1998; Hauser et al. 1998) indicates that the total emission from star formation and AGN activity that is absorbed by dust and reradiated into the FIR/submm is comparable to the unobscured emission seen in the optical. This suggests that obscured star formation may be responsible for a large fraction of the stars and metals seen in the local Universe, a conclusion which would have profound consequences for models of galaxy formation and evolution.
Independent support for the claim that optical estimates of the star formation density in the distant Universe may be missing a substantial component that is obscured by dust comes from deep submm surveys with the new camera SCUBA (Submillimeter Common User Bolometer Array; Holland et al. 1999) on the 15-m James Clerk Maxwell Telescope111The JCMT is operated by the Joint Astronomy Center on behalf of the parent organizations, the Particle Physics and Astronomy Research Council in the United Kingdom, the National Research Council of Canada, and the Netherlands Organization for Scientific Research. (JCMT) on Mauna Kea. SCUBA has, for the first time, enabled deep, unbiased surveys to be made of the submm sky (Smail, Ivison & Blain 1997; Barger et al. 1998, 1999; Hughes et al. 1998; Eales et al. 1999). These surveys have uncovered numerous sources with properties similar to those expected for distant ultraluminous infrared galaxies (Barger et al. 1998; Smail et al. 1998). If the majority of the submm emission in these systems comes from dust-obscured star formation, then their inferred star formation rates are of the order of several hundred solar masses per year.
The deepest submm counts (Blain et al. 1999b), fluctuation analyses (e.g. Hughes et al. 1998), and analyses of deep and wide-area surveys (e.g. Barger et al. 1999) indicate that the bulk of the background emission at 850-m detected by COBE is resolved into discrete sources at a flux limit of mJy. Thus, we are in a position to undertake detailed studies of the population responsible for the majority of the emission in the FIR background. In particular, we can measure the redshift distribution of the submm population and use this to trace the extent and evolution of obscured star formation in the distant Universe. The detailed study of the resolved component of the background also provides a clear method for determining what fraction of the submm emission originates from AGN activity rather than star formation (Blain et al. 1999a; Guiderdoni et al. 1998).
Finally, it is conceivable that some fraction of the population responsible for the FIR background lies at high redshift, –10. Submm selection is a powerful technique for locating such distant galaxies. Indeed, the steep thermal dust spectrum, which peaks in the FIR at a rest-frame wavelength of about 100-m, is redshifted into the submm for . The resulting strong negative K-correction for sources out to is sufficient to offset cosmological dimming for . Even for low values of the 850-m flux density is only expected to decrease by a factor of a few over this redshift range (Blain & Longair 1993; Hughes, Dunlop & Rawlings 1997).
In this paper we present spectroscopic redshift information for a sample of submm-selected galaxies from the SCUBA cluster lens survey of Smail et al. (1997, 1998). One advantage of a lensed survey is that the problem of source confusion (which, due to the coarse resolution of submm telescopes, can contribute noise in faint images; Blain, Ivison, & Smail 1998) is reduced since both the flux densities and the mean separations on the sky of the background sources are increased (Blain et al. 1999b). The primary advantage, however, is that the clusters magnify any background sources (here the median amplification of the submm fluxes is ), thereby providing otherwise unachievable sensitivity in the submm and easing spectroscopic follow-up in the optical. The full 850-m survey detected 17 sources above significance ( mJy in the image plane) over a total surveyed area of 36 arcmin2. Crude redshift limits for these sources were derived from broad-band imaging by Smail et al. (1998), who inferred that most of the galaxies were at .
Section 2 describes the submm sample and the spectroscopic follow-up. Section 3 presents the redshift identification for each submm source. Finally, section 4 discuss the results and gives our conclusions.
| UT Date | Seeing | Targets | Exposure |
|---|---|---|---|
| (′′) | (ks) | ||
| 1998 July 18 | 0.6 | J1/J2, J3 | |
| K2, K3 | |||
| P1, P2 | |||
| M4, M6, M10 | |||
| M1, M2 | |||
| 1998 Aug 21 | 0.6 | P1, P4 | |
| L3, L4 | |||
| 1998 Aug 22 | 0.6 | P1, P2 | |
| M1, M3, M11 | |||
| 1998 Sept 16 | 0.6 | P1, P2 | |
| M1, M3 | |||
| 1998 Sept 17 | 0.6 | K2, cD | |
| M1, M3 | |||
| N1, N2 | |||
| 1998 Oct 22 | 0.6 | H4 |
2. Sample and Observations
Smail et al. (1998) sought the optical counterparts for their 17 submm detections within a conservative arcsec radius (the combined positional uncertainty of their faintest sources) from the nominal submm position. All possible optical counterparts were identified in deep HST and ground-based imaging data to and 23.5, respectively, for the 16 submm sources covered by existing optical imaging data. Using a deep Keck II LRIS -band image, we recently identified a probable optical counterpart () to the seventeenth source, SMM J0443+0210 (N5; Fig. 1). Unfortunately, this identification came too late for the source to be included in the spectroscopic campaign described here. Two of the 17 sources have no obvious counterparts to the magnitude limits of their respective images.
Since the lensing clusters lie outside the Galactic plane, the 850-m sources are unlikely to arise from local regions, and indeed we find no evidence for dark patches caused by dust foreground globules in any of the optical images. Furthermore, the weak or non-detection of these sources at 450-m (Smail et al. 1997) rules out their origins being local.
As noted by Smail et al. (1998), since the optical counterparts to the submm sources are likely to be faint and the cluster fields are crowded, there is some likelihood that unrelated galaxies will fall within the submm error boxes. The probability of a galaxy with a given observed apparent magnitude falling at random within a circle of radius centered on the submm source is proportional to times the number density per surface area on the sky of galaxies with magnitude . Smail et al. estimated on an object-by-object basis (from the observed galaxy number counts for each optical image) the probability that a galaxy with the observed apparent magnitude or brighter would fall at random within a circle defined by the optical and submm positions. Although this procedure provides some measure of the reliability of the identifications, it does not allow the definitive determination of the true counterparts to individual submm sources. Thus, we have simply used these probability estimates to determine the priority with which to target sources, but in most cases we have targeted all visible counterparts within the error circles.
The optical spectroscopy of the candidate submm sources was undertaken with the Low-Resolution Imaging Spectrometer (LRIS; Oke et al. 1995) on the Keck II 10-m telescope using a wide 1.5 arcsec long-slit during several runs from 1998 July to 1998 October. With the wide slit and the 300 lines mm-1 grating blazed at 5000 Å, the resolution was 14 Å. The wavelength coverage was varied slightly, depending on the target and whether there were additional emission lines to search for. Two objects were observed per slit, which defined the position angle. The observations were typically 1 hr per slit, broken into three sets of exposures. Some of the objects were re-observed several times to improve the signal-to-noise. Table 1 gives a log of the Keck spectroscopic observations, including date, seeing, targets, and exposure times. The objects were stepped along the slit by 10 arcsec in each direction, and the sky backgrounds were removed using the median of the images to avoid the difficult and time-consuming problems of flat-fielding LRIS data. Details of the spectroscopic reduction procedures can be found in Cowie et al. (1996).
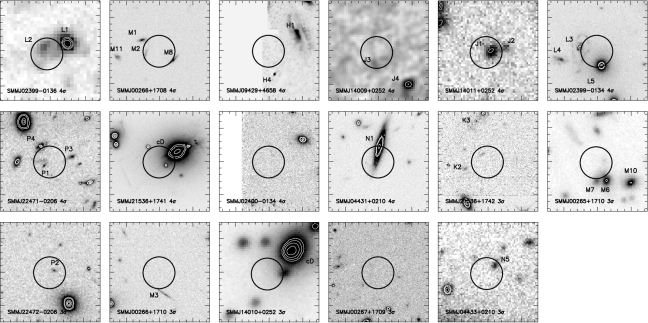
Figure 1 shows the fields for the 17 submm sources from the SCUBA cluster lens survey, including the newly identified source SMM J0443+0210. The individual images are centered on the submm positions with nominal 3 arcsec (1 ) radius error circles marked. Each square box covers an area ; the orientations of the images are arbitrary. The possible optical counterparts for each of the submm detections are labeled by name and can be cross-referenced with Table 3. In both Fig. 1 and Table 3 the submm sources are ordered by apparent 850-m flux for the and samples. The columns in Table 3 include the submm source name, apparent 850-m flux, candidate optical counterparts (most likely listed first), magnitudes for the counterparts, redshifts for the counterparts, name and redshift of the cluster field, and lensing amplifications for the counterparts at the given redshifts.


3. Redshift Identification
Our ability to conclude whether a particular galaxy is likely to be the submm source depends strongly on whether the optical spectrum of the galaxy shows any remarkable features, such as particularly strong [Oii] or H emission lines that indicate a starburst, or high excitation or broad lines that show the presence of an AGN. The relative paucity of AGNs in the general field population (%) suggests that if an AGN is identified, then the submm emission is most likely associated with that source. We note, however, that the visibility of remarkable features, especially AGN lines, will be strongly affected by dust in the galaxy – the same component which our submm selection should guarantee is present. The identification process is therefore somewhat problematic, and while we are capable of robustly identifying some submm sources with optical counterparts, specifically those with the most striking spectral features (as has been confirmed through the CO detection of two of our candidates), this approach leaves us with a number of ambiguous cases. As a secondary criterion, we consider the morphologies of the objects and the presence of any merger activity, which can be an indicator of luminous FIR systems in the local Universe.
We now discuss the nature and reliability of our redshift measurements in order of decreasing submm flux density, as presented in Fig. 1 and Table 3. In Fig. 2 we show the Keck spectra for the most likely optical counterparts to the submm sources, as discussed below.
SMM J023990136: A redshift of was measured for the pair of optical sources, L1/L2, by Ivison et al. (1998). L1 is a compact, dust-obscured AGN, and L2 is a companion structure whose extended emission may result from a vigorous burst of star formation triggered by an interaction with L1. The detection of CO emission in the mm-waveband coincident in redshift and position with the optical counterpart (Frayer et al. 1998) leaves no doubt that the L1/L2 pair is the correct identification.
SMM J09429+4658: The redshift for the nearby bright galaxy H1 is (Dressler et al. 1999). It shows no [Oii] or H emission but contains an obvious dust lane and thus might plausibly be the submm source. H4 shows H and Na D in absorption and is a blue star. Another plausible counterpart — a faint red source close to the nominal submm position — has recently been uncovered in deep near-infrared imaging of the SCUBA fields (Smail et al. 1999). Given the dust characteristics of H1 and the very low probability of seeing such a bright foreground galaxy close to the submm position, we consider H1 to be the most likely counterpart; however, we caution that there is some uncertainty about this identification.
SMM J14009+0252: We targeted J3, the nearest galaxy to the nominal submm position, and found the spectrum to be featureless and flat, so no redshift identification could be made; however, from its blue SED and lack of obvious emission lines, the object does not appear to lie at or . No spectroscopic observations were made of J4.
SMM J14011+0252: We identify this submm source with the high redshift starburst pair J1/J2 at , based on strong Ly emission and both C iv and Si iv absorption features (Fig. 2b). This pair of classic Lyman break galaxies was subsequently detected in CO at close to the optical redshift (Frayer et al. 1999). As with SMM J023990136, the spatial and redshift coincidence of the CO emission confirms our identification.
SMM J023990134: The galaxy L3 at a redshift of is almost certainly the submm source. The galaxy has an unusual ring morphology (Fig. 1), and the nucleus hosts a Seyfert 1.5 AGN, characterized by strong [O ii] , [Ne v] , and [Ne iii] emission, in addition to strong Mg ii absorption (Fig. 2c). L4 is at and hence is background to the cluster. L5 is a passive cluster elliptical at (ID #32 in Mellier et al. 1988).
SMM J224710206: P4 is a emission-line galaxy with [O ii] and Mg ii in absorption over weak broad Mg ii emission (Fig. 2d). The highly peculiar morphology of this source, plus its weak AGN characteristics, suggest that it is the correct optical counterpart. Other candidates include P1, which has a flat featureless spectrum, probably putting it at , and the more distant (3.3′′) and less probable P3, which was not observed.
SMM J21536+1741: This source lies close to the central cD galaxy of the cluster A 2390 (). Since the cD galaxy is a strong radio source, there is little doubt that this is the correct identification. The submm emission from this source and its relation to the overall spectral energy distribution of the central galaxy are discussed in more detail in Edge et al. (1999).
SMM J024000134: There is no obvious optical counterpart for this source down to the deep limit of the HST image.
SMM J04431+0210: The bright spiral galaxy N1 shows strong H and [O ii] emission (Fig. 2e) and is a cluster member at (see also Gioia et al. 1998). The probability of seeing such a bright cluster galaxy only 2.3′′ from the nominal submm position is very low. However, this is another field where the deep near-infrared imaging by Smail et al. (1999) has uncovered a faint red source within the submm error-box. Thus, we caution that there is still a question mark over the identification of N1 with the submm emission.
SMM J21536+1742: K2 has a relatively uncertain redshift identification of based on weak He ii emission and on Al iii and Mg ii absorption features (Fig. 2f). There are no outstanding spectral characteristics marking this object as the true optical counterpart. K3 is a clear absorption-line galaxy at , which is also detected in the deep ISO CAM observations of this field (J.-P. Kneib, unpublished). However, its large separation (6.3′′) from the submm position makes it a less likely counterpart.
SMM J00265+1710: M6/M10 are a pair of emission-line galaxies at (Fig. 2g), foreground to the cluster, which appear to be interacting. We were unable to obtain a redshift for the other candidate counterpart, M7, because of its close proximity to M6. The apparent interaction of the M6/M10 pair may be sufficient justification to suggest that this is the optical counterpart to the submm source. However, the spectrum of neither galaxy is particularly unusual, and we note that the galaxies are not associated with strong 15-m emission in the deep ISO CAM image of this cluster (J.-P. Kneib, unpublished). If the SCUBA source is associated with these galaxies then the absence of 15-m emission is unusual given their low redshift. For this reason we caution that, while attractive, the identification of the submm emission with M6/M10 may be incorrect.
SMM J224720206: P2 is the only likely visible optical counterpart to the submm detection. Our best estimate is that it is a star-forming galaxy at , based on what appears to be Ly emission and the Lyman break (Fig. 2h). However, there is no absorption-line confirmation, and the ultraviolet end of the spectrum is obtained from an integration of only 1 hr. This redshift identification is therefore uncertain.
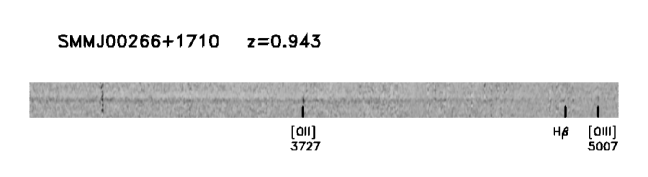
SMM J00266+1710: M3 is an emission-line galaxy at with [O ii] and [O iii] emission lines. There is no sign of Mg ii absorption or emission in this galaxy, but we believe that the redshift identification is reliable. In Fig. 3 we show the 2D spectral image for this galaxy with tick marks at the positions of [O ii] , H, and [O iii] . M3 is the only visible optical counterpart in the vicinity of the submm position.
SMM J14014+0252: The core of the cluster targeted in this field, Abell 1835, contains a massive cooling flow centered on the cD galaxy close to the submm source. The strong line-emission and other spectral features of massive star formation detected in this galaxy (Allen 1995) suggest that it is the source of the submm emission. Edge et al. (1999) identify a cool dust contribution in the observed submm spectral energy distribution of this galaxy and suggest that it arises from dust heated by star formation.
SMM J00267+1709: There is no visible optical counterpart to this source on the deep HST F814W exposure, placing a limit of on the apparent magnitude of any counterpart.
SMM J04433+0210: This is the faintest submm source to make it into the catalog. Moreover, this source lies off the original HST WFPC2 exposure of this cluster used by Smail et al. (1998) to identify candidate counterparts. A recent deep Keck -band image indicates that an object lies within 1.2′′ of the submm position. There are no brighter sources within 6′′ of this position. The probability that this faint object is the counterpart of the submm source is (calculated in the same manner as in Smail et al. 1998). This suggests that the faint optical source may be associated with the submm emission. However, as this candidate was only recently acquired and is extremely faint, no spectroscopic observations have yet been undertaken.
| Submm | 850 m | Candidate Optical | Counterpart | Cluster | Lensing | |
|---|---|---|---|---|---|---|
| Source | Flux (mJy) | Counterparts | Mag | Redshifts | Name/Redshift | Amplification |
| Detections | ||||||
| SMM J023990136 | 25.4 | L1/L2 | 20.41 | 2.80/2.80a | A 370/0.37 | 2.4 |
| SMM J00266+1708 | 18.6 | M2 | 22.38 | 1.23 | Cl 0024+16/0.39 | 1.6 |
| M11 | 22.56 | 1.06 | 1.5 | |||
| M1 | 21.99 | 0.39 | 1 | |||
| M8 | 21.99 | 0.44 | 1.05 | |||
| SMM J09429+4658 | 17.2 | H1 | 19.24 | 0.33b | Cl 0939+47/0.40 | 1 |
| H4 | 22.15 | star | ||||
| SMM J14009+0252 | 14.5 | J3 | 23.55 | 1.5–2.5 | A 1835/0.25 | |
| J4 | 21.62 | |||||
| SMM J14011+0252 | 12.3 | J1/J2 | 20.32 | 2.55/2.55 | A 1835/0.25 | 2.7 |
| SMM J023990134 | 11.0 | L3 | 20.52 | 1.06 | A 370/0.37 | 2.5 |
| L4 | 21.50 | 0.42 | 1.1 | |||
| L5 | 19.00 | 0.37c | 1 | |||
| SMM J224710206 | 9.2 | P4 | 21.72 | 1.16 | Cl 224402/0.33 | 1.9 |
| P1 | 22.92 | 2.3 | ||||
| P3 | 23.17 | |||||
| SMM J21536+1741 | 9.1 | cD | 15.94 | 0.23 | A 2390/0.23 | 1 |
| SMM J024000134 | 7.6 | A 370/0.37 | ||||
| SMM J04431+0210 | 7.2 | N1 | 18.42 | 0.18d | MS 0440+02/0.19 | 1 |
| Detections | ||||||
| SMM J21536+1742 | 6.7 | K2 | 24.69 | 1.60? | A 2390/0.23 | 1.9 |
| K3 | 21.36 | 1.02 | 1.7 | |||
| SMM J00265+1710 | 6.1 | M6/M10 | 20.53 | 0.21/0.21e | Cl 0024+16/0.39 | 1 |
| M7 | 21.19 | |||||
| SMM J224720206 | 6.1 | P2 | 24.05 | 2.11? | Cl 224402/0.33 | 2.2 |
| SMM J00266+1710 | 5.9 | M3 | 23.08 | 0.94 | Cl 0024+16/0.39 | 3.6 |
| SMM J14010+0252 | 5.4 | cD | 15.50 | 0.25 | A 1835/0.25 | 1 |
| SMM J00267+1709 | 5.0 | Cl 0024+16/0.39 | ||||
| SMM J04433+0210 | 4.5 | N5 | 24.3 | MS 0440+02/0.19 | ||
Note. — Table entries are ordered by apparent 850-m flux density. The most likely optical counterpart is listed first in column 3. The lensing amplifications were determined from the detailed mass models of the clusters. These were constructed using the LENSTOOL ray-tracing code on lensed features identified in high resolution optical images (Kneib et al. 1993). Uncertain redshifts are followed by a question mark.
References. — from Ivison et al. (1998) – from Dressler et al. (1999) – from Mellier et al. (1988) – see also Gioia et al. (1998) – see also Dressler & Gunn (1992).
Since many of our most probable counterparts do not show any unusual spectral features, it is not always certain that we have identified the true optical counterpart to each submm source. Two of the submm detections in the sample have no visible optical counterparts in very deep imaging, and it is possible that the true counterparts to some other sources in the sample are similarly optically faint. In principal such sources could either be at very high redshift or be so highly obscured that they are emitting their energy almost entirely in the submm (Dey et al. 1999).
4. Discussion and Conclusions
We have carried out a spectroscopic study of the candidate optical counterparts for 14 of the 17 submm sources (excluding the two blank fields and the unobserved counterpart to SMM J04433+0210) from a gravitationally-lensed submm-selected survey to determine redshifts and crucial spectral information for a representative sample of the submm source population. This information is essential for understanding the evolution of obscured star formation in the Universe and the contribution of AGN to the FIR background.
Our survey has produced firm identifications for four of the submm sources: two central cD galaxies in the lensing clusters (SMM J21536+1741 and SMM J14014+252), an interacting pair of galaxies at (SMM J023990136 L1/L2), one of which hosts a Seyfert-2 nucleus (L1), and a further pair of galaxies at (SMM J14011+0252 J1/J2) that show starburst features. It has also produced reliable identifications for a further two weak AGN sources at (SMM J023990134 L3) and (SMM J224710206 P4). In the following we refer to the four non-cluster sources listed above as our reliable sample.
![[Uncaptioned image]](/html/astro-ph/9903142/assets/x6.png)
Fig. 4.— The top panel shows the redshift distribution for the most likely optical counterparts to the submm detections in our spectroscopic survey. The cross-hatched histogram represents the reliable sample of four non-cluster counterparts (L1/L2, J1/J2, L3, and P4) and the open histogram represents cluster contamination (N1 and the two cDs). The redshift for J3 is uncertain and only expected to be in the range –2.5; thus, it has been plotted at . The three models discussed in the text, including Model E from Guiderdoni et al. (1998) (dotted), the original Gaussian model from Blain et al. (1999a) (dashed), and the revised Gaussian model (solid curve; see text) are superimposed on the redshift distribution in panel one. The lower two panels give the results published from the SCUBA survey of the Hubble Deep Field by Hughes et al. (1998) and from the on-going survey of the CFRS fields by Lilly et al. (1999). The shaded histograms in the bottom two panels represent the spectroscopic identifications and the dotted histograms the photometrically-derived limits. The number of blank fields in our survey and in the CFRS survey are indicated by floating boxes at nominally high redshift.
The remaining eight sources have candidate counterparts with redshifts ranging from –2.11, but they lack remarkable spectral characteristics to clearly identify them as the true counterparts. The lower redshift () systems include a pair of interacting galaxies at (SMM J00265+1710 M6/M10) and two bright spiral galaxies at (SMM J04431+0210 N1; cluster member) and (SMM J09429+4658 H1).
In the top panel of Fig. 4 we show our differential redshift distribution for the most likely optical counterparts to our sample of lensed submm detections (excluding the unobserved counterpart to SMM J04433+0210). The redshift distribution suggests that the majority of the sources are likely to lie at redshifts –3. The lens amplification is not expected to significantly distort the distribution given the high redshifts of the bulk of the counterparts. In the bottom two panels of Fig. 4 we show for comparison the redshift distributions for the on-going Canada France Redshift Survey (CFRS, Lilly et al. 1999) and for the Hubble Deep Field (HDF, Hughes et al. 1998).
![[Uncaptioned image]](/html/astro-ph/9903142/assets/x7.png)
Fig. 5.— Cumulative redshift distribution (thick solid line), excluding cluster contamination, our two blank fields, and the unobserved source. Cumulative distributions for the three models discussed in Fig. 4 and in the text are also shown: Guiderdoni et al. (1998) Model E (dotted), Blain et al. (1999a) Gaussian model (dashed), and revised Gaussian model (solid; see text).
We next compare our observed redshift distribution with a few representative models formulated to fit the FIR background and various infrared counts using simple analytic descriptions of the evolution of luminous FIR galaxies. We superimpose on our redshift distribution in Fig. 4 the Gaussian model (dashed line) from Blain et al. (1999a) and Model E (dotted line) from Guiderdoni et al. (1998). These models are composed of normal star forming galaxies with an additional population of highly obscured galaxies.
In Fig. 4 we plot the cumulative distributions for our non-cluster data (also excluding the blank sources) and the models of Fig. 4. When we perform the Kolmogorov-Smirnov (K-S) test on each model compared to the above data set, under the assumption that we have correctly identified the majority of the optical counterparts, we find low probabilities of 0.012 and 0.0004 for the Gaussian model and Model E, respectively; thus, both of these models can be rejected for predicting a median redshift for the submm emission that is too high. However, when we do the same comparison with the reliable sample of four non-cluster counterparts (L1/L2, J1/J2, L3, and P4), we find higher probabilities of 0.53 and 0.11, respectively, neither of which are significantly inconsistent with the models.
One way to reduce the mean redshift in the Blain et al. model while retaining the fits to the FIR background and counts is to change their dust emissivity spectral index from 1.5 to 1.0. The 850-m flux density of galaxies at in the models is then increased as compared with galaxies at higher redshifts. Figures 4 and 4 show this modified model as a solid curve. The K-S test gives probabilities of 0.15 and 0.997 when this modified model is compared with the full and reliable samples, respectively.
![[Uncaptioned image]](/html/astro-ph/9903142/assets/x8.png)
Fig. 6.— Bolometric luminosities derived from the lensing-corrected 850-m fluxes assuming a dust temperature of 47 K (Arp 220), a dust emissivity spectral index of 1.0, and the lens amplifications listed in Table 2. Filled symbols correspond to secure optical identifications: the filled diamonds are objects that show AGN activity, the filled star is our starburst pair, and the filled crosses are the two cD galaxies. Open symbols correspond to uncertain optical identifications: the open cross is a cluster member, the open triangles are field galaxies, and the open squares are high redshift field galaxies. Note that the redshift range for J3 is indicated with a connecting line.
Using the redshifts determined here, accurate cluster lens models, and a dust emissivity spectral index of 1.0, we can convert the apparent fluxes for the sources into intrinsic bolometric luminosities assuming the Arp 220 dust temperature of 47 K (Klaas et al. 1997) and a cosmology with . These luminosities are shown in Fig. 4 versus redshift and are characteristic of ultraluminous infrared galaxies (ULIGs). Since submillimeter observations of nearly all luminous infrared galaxies have been reasonably fit by single temperature dust models with K (Sanders & Mirabel 1996), the temperature dependence of the luminosity introduces a factor of only about 0.2–1.2 uncertainty in the above Lbol numbers.
A very large fraction of local ULIGs show signatures of interactions and mergers. A relatively high fraction of disturbed or interacting counterparts were also uncovered in the optical identifications of the faint submm sample analyzed here (Smail et al. 1998). Our spectroscopy has shown that although a small number of these interacting systems are simply projection effects (e.g. M1/M2), the majority are real; thus, we can infer that interactions remain an important triggering mechanism for ultraluminous activity in the distant Universe. This conclusion supports the use of nearby ULIGs as templates to understand the evolution of these more distant systems.
In Fig. 4 we show a more quantitative comparison of the properties of the local and distant ULIGs. We compare the observed optical to submm flux ratio versus redshift to that of the redshifted archetypical local ULIG Arp 220 (solid curve). Interestingly, the four sources with firm identifications (L1/L2, J1/J2, A1835-cD, A2390-cD) all lie above the Arp 220 distribution in Fig. 4. However, a comparison of the properties of the reliable non-cluster counterparts (L1/L2, J1/J2, L3, and P4) indicates that there is considerable scatter in the SI/S850 ratio. For the non-cluster galaxies detected in the -band, we find a median ratio of (SI/S850)Arp220 with a dispersion of around a factor of four. The majority of our submm sources therefore appear to be emitting a slightly lower fraction of their luminosity in the optical relative to the submm as compared to that expected from an Arp 220-like source at their redshifts. We note that the blank sources would have a SI/S850 ratio of around ; thus, if they are similar in their properties to our other sources, they would lie at redshifts . Alternatively, they could be more obscured systems at lower redshifts.
![[Uncaptioned image]](/html/astro-ph/9903142/assets/x9.png)
Fig. 7.— Ratio of -band flux to 850-m flux versus redshift. The line shows the relationship versus redshift expected for Arp 220. The galaxies show a large scatter in their relative SI/S850 ratios with the majority being slightly fainter in the optical relative to their submm emission when compared to Arp 220 put at the same redshift.
In terms of their bolometric luminosities, optical-to-FIR ratios, and morphologies, the galaxies selected in the submm in the distant Universe have very similar properties to local ULIGs. As regards the dominant energy source for the emission seen in the FIR background, i.e. AGN or starburst, we find that at least three of the fourteen sources surveyed have counterparts with spectral features indicative of AGN activity. These objects may be part of the obscured AGN population predicted to be a major contributor to the X-ray background at energies keV (Madau, Ghisellini, & Fabian 1994; Comastri et al. 1995; Fabian et al. 1998; Gunn & Shanks 1999; Almaini, Lawrence & Boyle 1999). Deep radio, NIR, MIR, and high-resolution X-ray data of fields observed with SCUBA should provide us with improved position estimates and more information on the nature of the sources, making the task of following up the submm detections easier in the future.
The determination of the redshift distribution of submm-selected galaxies is an important goal because it allows plausible models of the evolution of the volume emissivity of dust with redshift to be constrained more strongly than by the background and counts data alone. The first results on the redshift distribution presented here suggest that we can rule out models for galaxy and AGN evolution in which the bulk of the dust emission in the Universe occurred at redshifts either below or substantially higher than . This is in accord with conclusions reached by recent modelling of the FIR background (Dwek et al. 1998). Consequently, activity associated with these luminous dust-obscured sources occurs at a similar epoch to that seen for unobscured star-forming galaxies (Madau, Pozzetti, & Dickinson 1998; Steidel et al. 1999) and AGN (Boyle & Terlevich 1998). Our spectroscopic survey of the probable optical counterparts to submm sources is the first step towards the full reconstruction of the emission history of dusty galaxies in the Universe, whose contributions to star formation are now known to be at least as important at high redshift as the contributions from optically observed galaxies.
References
- (1)
- (2) Allen, S.W. 1995, MNRAS, 276, 947
- (3)
- (4) Almaini O., Lawrence, A., Boyle, B., 1999, MNRAS, submitted
- (5)
- (6) Barger, A.J., Cowie, L.L., Sanders, D.B., Fulton, E., Taniguchi, Y., Sato, Y., Kawara, K., Okuda, H. 1998, Nature, 394, 248
- (7)
- (8) Barger, A.J., Cowie, L.L., Sanders, D.B. 1999, ApJ, submitted
- (9)
- (10) Blain, A.W., Longair, M.S. 1993, MNRAS, 264, 509
- (11)
- (12) Blain, A.W., Ivison, R.J., Smail, I. 1998, MNRAS, 296, L29
- (13)
- (14) Blain, A.W., Smail, I., Ivison, R.J., Kneib, J.-P. 1999a, MNRAS, 302, 632
- (15)
- (16) Blain, A.W., Kneib, J.-P., Ivison, R.J., Smail, I. 1999b, ApJ, 512, L87
- (17)
- (18) Boyle, B.J., Terlevich, R.J. 1998, MNRAS, 293, L49
- (19)
- (20) Comastri A., Setti G., Zamorani G., Hasinger G. 1995, A&A, 296, 1
- (21)
- (22) Cowie, L.L., Songaila, A., Hu, E.M., Cohen, J.G. 1996, AJ, 112, 839
- (23)
- (24) Dey, A., Graham, J.R., Ivison, R.J., Smail, I., Wright, G.S., Liu, M.C. 1999, ApJ, in press, [astro-ph/9902044]
- (25)
- (26) Dressler, A., Gunn, J.E. 1992, ApJS, 78, 1
- (27)
- (28) Dressler, A., Smail, I., Poggianti, B.M., Butcher, H., Couch, W.J., Ellis, R.S., Oemler, A. 1998, ApJS, in press, [astro-ph/9901263]
- (29)
- (30) Dwek, E. et al. 1998, ApJ, 508, 106
- (31)
- (32) Eales, S., Lilly, S., Gear, W., Dunne, L., Bond, J.R., Hammer, F., Le Fèvre, O., Crampton, D. 1999, ApJ, submitted, [astro-ph/9808040]
- (33)
- (34) Edge, A.C., Ivison, R.J., Smail, I., Blain, A.W., Kneib, J.-P. 1999, MNRAS, in press, [astro-ph/9902038]
- (35)
- (36) Fabian A.C., Barcons X., Almaini O., Iwasawa K. 1998, MNRAS, 297, 11L
- (37)
- (38) Fixsen, D.J., Dwek, E., Mather, J.C., Bennett, C.L., Shafer, R.A. 1998, ApJ, 508, 123
- (39)
- (40) Frayer, D.T., Ivison, R.J., Scoville, N.Z., Yun, M., Evans, A.S., Smail, I., Blain, A.W., Kneib, J.-P. 1998, ApJ, 506, L7
- (41)
- (42) Frayer, D.T., Ivison, R.J., Scoville, N.Z., Evans, A.S., Yun, M., Smail, I., Barger, A.J., Blain, A.W., Kneib, J.-P. 1999, ApJ, 514, 13L
- (43)
- (44) Gioia, I.M., Shaya, E.J., LeFèvre, O., Falco, E.E., Luppino, G.A., Hammer, F. 1998, ApJ, 497, 573
- (45)
- (46) Guiderdoni, B., Bouchet, F.R., Puget, J.-L., Lagache, G., Hivon, E. 1997, Nature, 390, 257
- (47)
- (48) Guiderdoni, B., Hivon, E., Bouchet, F.R., Maffei, B. 1998, MNRAS, 295, 877
- (49)
- (50) Gunn, K.F., Shanks, T. 1999, MNRAS, submitted
- (51)
- (52) Hauser, M.G. et al. 1998, 508, 25
- (53)
- (54) Holland, W.S. et al. 1999, MNRAS, in press, [astro-ph/9809122]
- (55)
- (56) Hughes, D.H. et al. 1998, Nature, 394, 241
- (57)
- (58) Hughes, D.H., Dunlop, J.S., Rawlings, S. 1997, MNRAS, 289, 766
- (59)
- (60) Ivison, R., Smail, I., Le Borgne, J.-F., Blain, A.W., Kneib, J.-P., Bézecourt, J., Kerr, T.H., Davies, J.K. 1998, MNRAS, 298, 583
- (61)
- (62) Klaas, U., Haas, M., Heinrichsen, I., Schulz, B. 1997, A&A, 325, L21
- (63)
- (64) Kneib, J.-P., Mellier, Y., Fort, B., Mathez, G. 1993, A&A, 273, 367
- (65)
- (66) Lilly, S.J., Eales, S.A., Gear, W.K.P., Hammer, F., Le Fèvre, O., Crampton, D., Bond, J.R., Dunne, L. 1999, ApJ, in press, [astro-ph/9901047]
- (67)
- (68) Madau, P., Ghisellini, G., Fabian, A.C. 1994, MNRAS, 270, 17
- (69)
- (70) Madau, P., Pozzetti, L., Dickinson, M. 1998, ApJ, 498, 106
- (71)
- (72) Mellier, Y., Soucail, G., Fort, B., Mathez, G. 1988, A&A, 199, 13
- (73)
- (74) Oke, J.B. et al. 1995, PASP, 107, 375
- (75)
- (76) Puget, J.-L., Abergel, A., Bernard, J.-P., Boulanger, F., Burton, W.B., Desert, F.-X., Hartmann, D. 1996, A&A, 308, L5
- (77)
- (78) Sanders, D.B., Mirabel, I.F. 1996, ARA&A, 34, 749
- (79)
- (80) Schlegel, D.J., Finkbeiner, D.P., Davis, M. 1998, ApJ, 500, 525
- (81)
- (82) Smail, I., Ivison, R.J., Blain, A.W. 1997, ApJ, 490, L5
- (83)
- (84) Smail, I., Ivison, R.J., Blain, A.W., Kneib, J.-P. 1998, ApJ, 507, 21L
- (85)
- (86) Smail, I., Ivison, R.J., Kneib, J.-P., Cowie, L.L., Blain, A.W., Barger, A.J., Owen, F.N., Morrison, G. 1999, MNRAS, submitted
- (87)
- (88) Steidel, C.C., Adelberger, K.L., Giavalisco, M., Dickinson, M., Pettini, M. 1999, ApJ, in press, [astro-ph/9811399]
- (89)