WHAT DETERMINES THE DEPTH OF BALS?
KECK HIRES OBSERVATIONS OF BALQSO 1603+3002
Abstract
We find that the depth and shape of the broad absorption lines (BALs) in BALQSO 1603+3002 are determined largely by the fraction of the emitting source which is covered by the BAL flow. In addition, the observed depth of the BALs is poorly correlated with their real optical depth. The implication of this result is that abundance studies based on direct extraction of column densities from the depth of the absorption troughs are unreliable. Our conclusion is based on analysis of unblended absorption features of two lines from the same ion (in this case the Si iv doublet), which allows unambiguous separation of covering factor and optical depth effects. The complex morphology of the covering factor as a function of velocity suggests that the BALs are produced by several physically separated outflows. The covering factor is ion dependent in both depth and velocity width. We also find evidence that in BALQSO 1603+3002 the flow does not cover the broad emission line region.
Subject headings: quasars: absorption lines
In press with the Astrophysical Journal.
1 INTRODUCTION
Broad Absorption Line (BAL) QSOs are a manifestation of AGN outflows. BALs are associated with prominent resonance lines such as C iv 1549, Si iv 1397, N v 1240, and Ly 1215. They appear in about 10% of all quasars Foltz et al. (1990) and have typical velocity widths of km s-1 Weymann et al. (1985); Turnshek (1988) and terminal velocities of up to 50,000 km s-1. The small percentage of BALQSOs among quasars is generally interpreted as an orientation effect Weymann et al. (1991) and it is probable that the majority of quasars and other types of AGN harbor intrinsic outflows.
A crucial issue in the study of the outflows is whether the observed depth of the BALs is determined by the column density along the line of sight, or is due to ‘non-black saturation’ — the partial covering of the emission source by an optically thick flow. Non-black saturation can also be caused by filling in the bottom of the troughs by scattered photons. The question of column density vs. geometry (i.e., covering factor) is especially important for determining the ionization equilibrium and abundances (IEA) of the BAL material. Inferences about the IEA in the BAL region are made by simulating BAL ionic-column-densities () using photoionization codes. Several groups Korista et al. (1996); Turnshek et al. (1996); Hamann (1996) have used extracted from HST observations of BALQSO 0226–1024 Korista et al. (1992) in their IEA studies while introducing innovative theoretical approaches to the problem. These studies, however, used the BAL apparent optical depths (defined as , where is the residual intensity seen in the trough) to determine . The hazard of this approach is that the apparent optical depths in the BALs cannot be directly translated to realistic unless the covering factor and level of saturation are known. In saturated BALs the inferred apparent are only lower limits to the real , making conclusions regarding IEA in BALQSOs, such as very high BAL metallicity Turnshek et al. (1996), highly uncertain.
Recently, several groups presented evidence for non-black saturation in BALs Arav (1997); Arav et al. (1999); Barlow et al. (1997); Telfer et al. (1998); however, the importance of the phenomenon and its detailed study as a function of velocity across the absorption troughs are still in the preliminary stages. Here we present such a study of Keck HIRES observations of BALQSO 1603+3002 (). The source was discovered during the FIRST (Faint Images of the Radio Sky at Twenty centimeters) Bright Quasar Survey (FBQS, Gregg et al. 1996; White et al. 1999), which selects quasar candidates by comparing the catalog of radio sources found by the VLA FIRST survey Becker et al. (1995); White et al. (1997) with the APM catalog of the POSS-I plates McMahon and Irwin (1992). One of the biggest surprises from the FBQS is the prevalence of BAL quasars in this radio-selected sample. Although previous studies indicate that none of the known BAL quasars are radio-loud, BAL quasars have been found in the FBQS at a rate equal to or greater than that for optically-selected quasar samples. This result motivated us to begin an in depth study of the BAL quasars in the FBQS. In this paper we present a high-resolution spectrum of FIRST J160354.2+300209 (hereafter BALQSO 1603+3002). The low-resolution discovery spectrum is presented in (White et al. 1999). BALQSO 1603+3002 is a radio-loud quasar with a flux density of 54 mJy at 1400 MHz and an optical magnitude of B=18.0 []. In § 4 we establish that the absorption in this object is BAL in nature. BALQSO 1603+3002 is a high ionization BALQSO, in contrast to the two previously published BALs from the FIRST survey Becker et al. (1997). In this paper we will focus on the optical properties of this object.
2 ANALYSIS
2.1 Data Acquisition and Reduction
On May 18, 1998 we used the High Resolution Echelle Spectrometer (HIRES, Vogt et al. 1994) on the Keck-1 10-m telescope to obtain three 40 minute exposures of BALQSO 1603+3002 covering 3900 – 6000 Å using a 11 wide slit. The orders overlapped up to 5128 Å, beyond which small gaps occur between orders. The slit was rotated to the parallactic angle to minimize losses due to differential atmospheric refraction. The observing conditions were excellent with subarcsecomd seeing and near photometric transparency. The spectra were extracted using routines tailored for HIRES reductions Barlow (1999), normalizing the continuum to unity. The resolution of the extracted spectrum varies from 3.4 to 3.6 pixels FWHM, being 0.119Å at 5000Å or 6.5 km s-1 in velocity space.
The continuum signal-to-noise of the extracted data is roughly 10-15 per pixel. In the analysis which follows, we boxcar smoothed the spectrum by 10 pixels, increasing the continuum signal-to-noise to 30-50 throughout the wavelength regions of interest while retaining sufficient velocity resolution for our analysis ( km s-1).


2.2 Si iv BAL
Three distinct troughs are seen in the Si iv BAL (Fig. 1b). Since the total absorption width is only slightly greater than the Si iv doublet separation ( km s-1), the two main troughs are seen in both the blue and red components of the doublet and are unblended with other absorption. The ability to measure unblended features from two lines of the same ion allows us to solve separately for the effective covering factor and the real optical depth Barlow et al. (1997); Hamann et al. (1997); Arav et al. (1999). The effective covering-factor ()111We do not use the notation (introduced by Barlow and Hamann) in order to reserve the use of a subscript to differentiate between continuum and BEL covering factors. is defined such that accounts for photons that arise either from regions not covered by the BAL flow or those that are scattered into the observer’s line of sight. If scattering into the line of sight is negligible, then is the total emission-covering-fraction of the BAL flow. In Si iv 1394, 1403 the expected intrinsic optical depth ratio is 2:1 since the oscillator strength of the 1394 line is twice that of the 1403 line. The relationships between the residual intensity in the red and blue doublet components ( and , respectively), and the optical depth are given by:
| (1) | |||||
| (2) |
where is the real optical depth of the stronger transition.
We concentrate our analysis on the deepest of the Si iv troughs ( in Fig. 1b). As we demonstrate below, we obtain a lower limit to the true optical depth and minimize the role of the covering factor if we assume that the flow covers the broad emission line (BEL) region to the same extent that it covers the continuum source. The first step is to fit an emission model for the whole Si iv region. We then divide the data by the emission model to obtain the normalized residual intensities. Working in space (in which the doublet separation is constant) we shift the absorption due to the red component by the doublet separation to obtain a dataset which contains and on the same scale. For each bin we solve equations (1) and (2) for both and . The results are shown in Figure 2, where for clarity we transformed the x-axis to a velocity presentation. Physical solutions for equations (1) and (2) exist only if Hamann et al. (1997). Values outside this constraint are due to photon shot noise or systematic errors. Whenever we encountered a bin in which , we treated it as though , i.e., and . For the segment we have solved for, this situation arises only once ( km s-1).
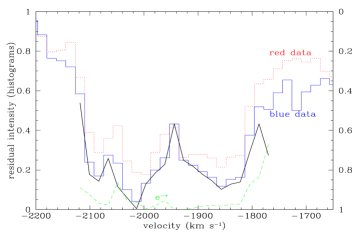
Figure 2 shows that the covering factor has almost the exact same shape as . The dashed line shows , which would have been the shape of the absorption trough if the coverage were complete. Since is almost identical to while does not correlate with we conclude that the shape of absorption trough is determined by variation in the covering factor and not by changes in the real optical depth. This characteristic is most noticeable in the “hump” between and km s-1. If the shape of this hump was determined by changes in real optical depth, we would expect to mimic . From Figure 2 this is clearly not the case. In fact the highest residual intensity is actually the point of largest optical depth. The real optical depth across trough is 3–6 times larger than the apparent optical depth (), demonstrating the unreliability of extracting column densities from measurements of .
A similar result is obtained for the second deepest Si iv trough (the last trough being too shallow and partially blended cannot be used for this analysis). In § 3.3 and § 4 we combine the dominance of the covering factor in determining the shape of trough with the information gathered from the C ii BAL (§ 3.3) to produce a geometrical picture for the flow.
As we discuss in the next section, the C iv data suggest that the BAL flow does not cover the BEL region in this object. If this is the case for the Si iv absorption, how does it affect the results shown in Figure 2? The contribution of the Si iv BEL to the total emission is larger for the red doublet component of trough than for the blue component, and when we subtract a modeled Si iv BEL from the data the residual intensity of the two troughs are identical within the noise. In such a case, the lines must be highly saturated (with no useful upper limit for possible) and the shape of the trough is determined solely by the behavior of the covering factor. In § 4 we argue that this picture is the simplest interpretation of the data.
2.3 C iv BAL
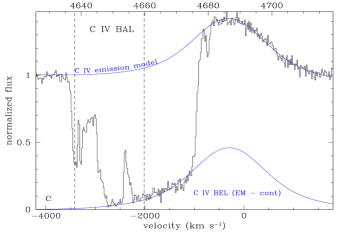
For the C iv BAL (Fig. 1c) we cannot use the same solution technique since the intrinsic doublet separation is only 500 km s-1, much smaller than the width of the flow ( km s-1), thus the trough is a blend of the two doublet components. However, we have an independent indicator for non-black saturation in this BAL as well. We model the unabsorbed emission with a BEL on top of a linear continuum (Fig. 1c). For the BEL, we used a two Gaussian model that gave an excellent fit to the unabsorbed part of the C iv BEL. We show the C iv BEL (which is derived by subtracting the continuum from the full emission model) on the same plot. The flux as a function of velocity at the deepest part of the C iv BAL ( to km s-1) is remarkably similar to the flux of the modeled C iv BEL. From this we deduce that the BAL flow in this object does not cover a significant fraction of the BEL region. A similar behavior is seen in Q1413+113 Turnshek et al. (1988). Accepting this assertion leads to the conclusion that the C iv BAL flow is optically thick, since it blocks virtually all the continuum emission. Therefore, the shape of the C iv BAL trough contains information about the geometry and kinematics of the flow but not about the column density of the absorber.
Low resolution data of the Ly BEL (for which we do not have Keck HIRES coverage), were taken with the KAST double spectrograph at Lick observatory. These data (shown in White et al. 1999) support our assertion that the BAL flow does not cover the BELs. Our data show unambiguous Ly BAL absorption on the blue wing of the Ly BEL. Between km s-1 and km s-1 the shape of the trough is consistent with a covered continuum and an uncovered BEL. Since the peak flux of the Ly BEL is roughly twice as strong as the continuum, and six times stronger than the C iv BEL, we expect to see substantial Ly emission peeking through the BAL flow. This is indeed the case, for example, at km s-1 where the observed flux is 1.5 times higher than the continuum level, in agreement with our predictions. In addition to the Ly BAL we also see the N v BAL in the low resolution data. The shape of this trough also supports our assertion that the BAL flow does not cover the BELs.
2.4 C ii BAL
Absorption associated with the BAL flow is clearly detected in C ii 1335 (Fig. 1a). This line is a triplet with components at 1335.708 Å, 1335.663 Å (both from an excited level) and 1334.532 Å Verner et al. (1996). The 1335.663 Å component is only 11% as strong as the 1335.708 Å component and is separated from it by only 10 km s-1. For our purposes we can therefore treat the whole line as a doublet with components at 1335.703 Å and 1334.532 Å, which have an intrinsic optical depth ratio of 2:1, respectively. From the comparable absorption equivalent widths seen in C ii 1334.532 and C ii1335.703, and taking into account the possibility of saturation, a lower limit of cm-3 can be obtained for the number density of the gas Wood and Linsky (1997). This lower limit cannot be taken as evidence for the intrinsic nature of the absorption, since similar number density values are inferred for some intervening absorption systems (for example Q1037–2704; Lespine and Petitjean, 1997). Due to the lower S/N and the shallowness of the absorption in C ii, we cannot get meaningful results from trying to solve for the covering factor and real optical depth in this line. Even so, the data are strongly suggestive of saturation since the troughs have an apparent optical depth ratio less than 2:1.
From Figure 1, it is evident that the C ii absorption is perfectly aligned with the deepest subtrough of Si iv trough . No significant C ii absorption is seen associated with the low-velocity subtrough of this feature even though its residual intensity in Si iv is almost identical to that of the deepest subtrough. (There is also a third subtrough around km s-1, but since it is narrower and less distinct we ignore it.) Our explanation for this occurrence is that what we see are two distinct outflows. One outflow might have a lower ionization equilibrium and thus shows C ii absorption. Alternatively, the flow that shows C ii absorption might be in a similar ionization equilibrium but have a significantly larger optical depth in all lines, which allows a detection of a small C ii contribution. This picture agrees well with our inferences from the Si iv analysis. We know that the shape of trough is determined by changes in the covering factor, which shows two distinct subtroughs. The simplest way to explain one such subtrough is to assume that an accelerating outflow moves in and out of our line of sight Arav (1996); Arav et al. (1999). Two such outflows which happen to cross our line of sight at similar radial velocities will give rise to the two subtroughs seen in trough . Since these are not physically connected it is less of a surprise to detect C ii absorption in only one of them.
3 DISCUSSION
To relate our findings to the whole class of BALQSOs, we need to establish the relationship of the absorption seen in BALQSO 1603+3002 to the BAL phenomenon in general. Weymann et al. (1991) defined a BAL as a continuous absorption of at least 10% in depth spanning more than 2000 km s-1, discounting absorption closer than 3000 km s-1 bluewards of the emission peak. In Figure 1c we show the data for the C iv BAL. The width of continuous absorption deeper than 10% is 2600 km s-1, which satisfies the width criterion, but most of the absorption is at velocities closer than –3000 km s-1 from the emission line peak. However, the –3000 km s-1 condition was introduced in order to unambiguously distinguish between associated absorbers and “classical BALs” but does not hold any physical meaning. The flow in BALQSO 1603+3002 shows non-black saturation and the C iv data suggest that the flow does not cover the broad emission line region of the object (with a size of pc.; Netzer, 1990). Each of these independent findings mark the flow as arising from the vicinity of the central source and as being physically similar to “classical BALs”. With the data improvements available in recent years (especially high resolution spectroscopy) we advocate classification of absorption systems based on their physical characteristics (see Barlow et al., 1997), rather than the older phenomelogical one.
The geometry that we proposed for trough (§ 3.3) can be extrapolated to the full observed BAL. We have already mentioned that the structure seen in the trough situated at km s-1 (see Fig 1b) is due to variations in the covering factor. Therefore, following the arguments we used for trough , it seems plausible that this trough is also the result of two outflows that cross our line of sight at similar radial velocities. If we extend this picture to the shallowest trough at km s-1, which also shows two adjacent absorption features, we are led to postulate six different outflow components in the full BAL. Multi-component flows might be quite common in BALQSOs since many of them show several absorption troughs. For example, in the spectra shown by Korista et al. (1993) there are four C iv troughs in Q0146+0142, 3 in Q0226–1014, 3 in Q0932+5010 and 4 in Q2240–3702. One unexplained coincidence in our flow model is the occurrence of three pairs of closely adjacent subflows. Starting from trough , the separations between the deepest absorption features in each trough are: 154 , 136 and 117 km s-1. Having three such absorption pairs all with separations between 100–150 km s-1, across a full velocity width of more than 2000 km s-1 seems improbable without a dynamical justification.
Independent of our flow model, however, solving for the Si iv doublet components shows that the structure in at least the first two troughs is mainly due to changes in the covering factor (see Fig. 2). Assuming that the flow covers the whole emission region leads to values between 2–5 across trough . Alternatively, assuming the flows do not cover any appreciable part of the BEL region yields indistinguishable residual intensities for both the red and blue components of each trough (after subtracting the BEL contribution). In this case values are between . The latter option seems more physical for two reasons. First, from the C iv data we infer that the flow as seen in C iv does not cover the broad emission line. There is no reason to assume that the Si iv case is different. Second, in the absence of a physical preference for values of order unity, values between 2–5 necessitates some fine tuning whereas the range is simply much more probable numerically.
Although the three flow components are seen in both C iv and Si iv, there are important differences between these two manifestations. The C iv absorption is always deeper and somewhat wider than the Si iv flow. Also, in C iv there is no trace of the large variations in covering factor seen in Si iv, trough . These differences show that in the two main troughs the covering factor is ion dependent. A model based on column density gradient and kinematic effects can explain this behavior qualitatively Arav et al. (1999).
4 SUMMARY AND CONCLUSIONS
High resolution spectroscopy of BALQSO 1603+3002 has yielded important diagnostics for the nature of quasar outflows. The presence of two relatively wide but still unblended doublet components of Si iv in its spectrum has allowed us to distinguish between the effects of column density and covering factor in determining the shape of the absorption troughs. A straightforward solution of equations (1) and (2) demonstrates that changes in the covering factor are responsible for the troughs’ shape as opposed to variations in the real optical depth. This result was independently supported by the findings from the C iv BAL, which indicated that the flow does not cover an appreciable portion of the BEL region (Further evidence for the non-covering comes from the low resolution data of the Ly and N v BALs; see § 2.3.). Subtracting the BEL contribution, the resultant BAL is black across a considerable span and therefore saturated.
The inference from the C iv BAL, that the BEL region is not covered by the flow, strengthens the results derived from the Si iv analysis. After subtracting a modeled Si iv BEL, the residual intensities of the blue and red components of the troughs are identical within the noise. Such occurence indicates that the absorption is highly saturated and that the shape of the trough is solely determined by changes in the covering factor. It also suggests that the transition from opaque matter to is quite sharp. Once we know that the shape of the absorption line is due to the covering factor, it is natural to model the structure within trough of Si iv as arising from two separate outflows. Independent evidence for this assertion comes from the C ii BAL which shows an absorption feature which coincides with only one of the subtroughs seen in Si iv, trough . This result supports a picture of a BAL region consisting of several flows that appear to have different properties, either as a result of a different ionization state or simply because of different optical depth. However, the real situation must be more complicated since the C iv and Si iv BALs show different covering factors at the same velocities.
Our findings have important implications for abundance studies of the flows. As we showed, extracting from the depth of the trough using severely underestimates the true optical depth. This leads to a similar underestimation of the resultant column density. Since abundances are determined by a relative comparison of column densities after accounting for the ionization equilibrium, underestimating the hydrogen column density can produce erroneously high absolute abundances for all the heavy elements. Differential metal abundance determinations are also susceptible to large errors arising from underestimating column densities. Based on the apparent column densities in Q0226-1024, Turnshek et al. (1996) found (their table 4, first model) that Si and S are highly enriched relative C, compared to solar ratios: (Si/C)(Si/C)⊙, (S/C)(S/C)⊙. Similarly, Junkkarinen et al. (1997) found (P/C)(P/C)⊙ in PG 0946+301. When compared to the solar abundance ratios, (C/Si)⊙=11, (C/S)⊙=20 and (C/P)⊙=1000 Grevesse and Anders (1989), a trend of higher enrichment for rarer elements is evident. This surprising and suspect correlation can be eliminated if we accept that the column densities are large, the absorption is saturated, and consequently the shapes of the troughs are only mildly dependent on the real optical depth. In such a case, we would expect only a small variation in the depth of troughs which arise from different elements, even when the abundances differ by large factors. If one does not assume saturation, a progressively higher enrichment for rarer elements has to be invoked to explain the small variation in apparent column density. Non-black saturation accounts for this without invoking fantastic metal enrichment. Rare elements are simply less saturated than more abundant elements222Turnshek et al. (1996) also found higher enrichment relative to carbon for nitrogen and oxygen. These findings can also be explained by the saturation scenario. If we assume that all the BALs in Q0226-1024 are similar in depth and shape (which is correct to within a factor of 2), we deduce higher apparent column densities for lines with weaker oscillator strength. This is exactly the case for the O iii, O iv, and N iii BALs observed in Q0226-1024, and the high column densities deduced for these ions (Turnshek et al., 1996, Table 2) are largely responsible for the very high enrichment reported for these elements..
Based on the results shown in this paper and on independent evidence for non-black BAL saturation (see § 1), we conclude that BAL abundances claims in the literature which are based on apparent should be treated with the utmost caution.
ACKNOWLEDGMENTS
We thank the referee Kirk Korista for several valuable suggestions. Part of this work was performed under the auspices of the US Department of Energy by Lawrence Livermore National Laboratory under Contract W-7405-Eng-48. We acknowledge support from the NRAO, NSF grant AST-9802791, STScI and Sun Microsystems.
References
- Arav (1996) Arav, N. 1996, ApJ, 465, 617
- Arav (1997) Arav, N. 1997, in Mass Ejection from AGN, ASP Conference Series, Vol. 128, ed. N. Arav, I. Shlosman, and R. J. Weymann, p. 208
- Arav et al. (1999) Arav, N., Korista, T. K., de Kool, M., Junkkarinen, V. T., and Begelman, M. C. 1999, ApJ, in press
- Barlow (1999) Barlow, T. A. 1999, AJ, in preparation
- Barlow et al. (1997) Barlow, T. A., Hamann, F., and Sargent, W. L. W. 1997, in Mass Ejection from AGN, ASP Conference Series, Vol. 128, ed. N. Arav, I. Shlosman, and R. J. Weymann, p. 13
- Becker et al. (1995) Becker, R. H., Helfand, D. J., and White, R. L. 1995, ApJ, 450, 559
- Becker et al. (1997) Becker, R. H., Gregg, M. D., Hook, I., White, R. L., Helfand, D. J., and McMahon, R. J. 1997, ApJL, 479, 93
- Foltz et al. (1990) Foltz, C. B., Chaffee, F. H., Hewett, P. C., Weymann, R. J., and Morris, S. L. 1990, BAAS, 2, 806
- Gregg et al. (1996) Gregg, M. D., Becker, R. H., White, R. L., Helfand, D. J., McMahon, R. J., and Hook, I. 1996, AJ, 112, 407
- Grevesse and Anders (1989) Grevesse, N., and Anders, E. 1989, in Cosmic Abundances of Matter, ed. C. J. Waddington, New York: AIP Conf. Proc.,, p. 183
- Hamann (1996) Hamann, F. 1996, ApJS, 109, 279
- Hamann et al. (1997) Hamann, F., Barlow, T. A., Junkkarinen, V. T., and Burbidge, E. M. 1997, ApJ, 478, 80
- Junkkarinen et al. (1997) Junkkarinen, V., Beaver, E., Burbidge, E., Cohen, R., and Hamann, F. Lyons, R. W. 1997, in Mass Ejection from AGN, ASP Conference Series, Vol. 128, ed. N. Arav, I. Shlosman, and R. J. Weymann, p. 220
- Korista et al. (1992) Korista, K., Weymann, R., Morris, S., Kopko, M., Turnshek, D., Hartig, G., Foltz, C., Burbidge, E., and Junkkarinen, V. 1992, ApJ, 401, 529
- Korista et al. (1993) Korista, K. T., Voit, G. M., Morris, S. L., and Weymann, R. J. 1993, ApJS, 88, 357
- Korista et al. (1996) Korista, K. T., Hamann, F., Ferguson, J., and Ferland, G. J. 1996, ApJ, 461, 645
- Lespine and Petitjean (1997) Lespine, Y., and Petitjean, P. 1997, A&A, 317, 416
- McMahon and Irwin (1992) McMahon, R. G., and Irwin, M. J. 1992, in Digitised Optical Sky Surveys,, ed. H. T. MacGillivray and E. B. Thomson (Dordrecht: Kluwer), p. 417
- Netzer (1990) Netzer, H. 1990, in Saas-Fee Advanced Course 20: Active Galactic Nuclei, ed. R. D. Blandford, H. Netzer, & L. Woltjer, (New York: Springer), p. 57
- Telfer et al. (1998) Telfer, R., Kriss, G., Zheng, W., and Davidson, A.F. Green, R. 1998, ApJ, in press
- Turnshek (1988) Turnshek, D. A. 1988, in Space Telescope Sci. Inst. Symp. 2, QSO Absorption Lines: Probing the Universe, ed. S. C. Blades, D. A. Turnshek & C. A. Norman (Cambridge: Cambridge Univ. Press), p. 17
- Turnshek et al. (1988) Turnshek, D. A., Foltz, C. B., Grillmair, C. J., and Weymann, R. J. 1988, ApJ, 325, 651
- Turnshek et al. (1996) Turnshek, D. A., Kopko, M., Monier, E., Noll, D., Espey, B., and Weymann, R. J. 1996, ApJ, 463, 110
- Verner et al. (1996) Verner, D. A., Verner, E. M., and Ferland, G. J. 1996, Atomic Data & Nuclear Data Tables, 64, 1
- Vogt and et al . (1994) Vogt, S. S., et al., 1994, in Instrumentation in Astronomy VIII, Proc. SPIE Vol. 2198,, Eds. David L. Crawford, Eric R. Craine, p. 362
- Weymann et al. (1985) Weymann, R. J., Turnshek, D. A., and Christiansen, W. A. 1985, in Astrophysics of Active Galaxies and Quasi-stellar Objects, ed. J. Miller (Oxford: Oxford Univ. Press), p. 333
- Weymann et al. (1991) Weymann, R. J., Morris, S. L., Foltz, C. B., and Hewett, P. C. 1991, ApJ, 373, 23
- White and et al (1999) White, R. L., et al., 1999, ApJ, submitted
- White et al. (1997) White, R. L., Becker, R. H., Helfand, D. J., and Gregg, M. D. 1997, ApJ, 475, 479
- Wood and Linsky (1997) Wood, B. E., and Linsky, J. L. 1997, ApJL, 474, 39