Infrared properties of SiC particles
Abstract
We present basic laboratory infrared data on a large number of SiC particulate samples, which should be of great value for the interpretation of the 11.3 m feature observed in the spectra of carbon-rich stars. The laboratory spectra show a wide variety of the SiC phonon features in the 10-13 m wavelength range, both in peak wavelength and band shape. The main parameters determining the band profile are morphological factors as grain size and shape and, in many cases, impurities in the material. We discovered the interesting fact that free charge carriers, generated e.g. by nitrogen doping, are a very common characteristics of many SiC particle samples. These free charge carriers produce very strong plasmon absorption in the near and middle infrared, which may also heavily influence the 10-13 m feature profile via plasmon-phonon coupling.
We also found that there is no systematic dependence of the band profile on the crystal type (- vs. -SiC). This is proven both experimentally and by theoretical calculations based on a study of the SiC phonon frequencies. Further, we give optical constants of amorphous SiC. We discuss the implications of the new laboratory results for the interpretation of the spectra of carbon stars.
Key Words.:
Stars: atmospheres; Stars: carbon; ISM: dust, extinction; Infrared: ISM: lines and bands1 Introduction
Thermodynamical equilibrium calculations performed by Friedemann (1969a,b) and Gilman (1969) suggested that silicon carbide (SiC) particles can form in the mass outflows from carbon stars. First empirical evidence for the presence of such particles came from infrared spectroscopy performed by Hackwell (1972) and Treffers & Cohen (1974). The latter authors interpreted the detected relatively broad 11.3 m feature as the emission of small SiC particles between the transverse and longitudinal optical phonon frequencies. More empirical material was accumulated by the IRAS mission (Little-Marenin (1986); Goebel et al. (1995)) and recent ground-based observations with UKIRT (Speck et al. (1997)). The UKIRT data showed that the feature cannot only appear in emission, but that there are a few sources with an absorption feature.
An ultimate proof for the formation of SiC grains in carbon-rich stellar atmospheres was the detection of isotopically anomalous SiC grains in primitive meteorites (Bernatowicz et al. (1987)). The s-process isotopic signature identified in the majority of the meteoritic SiC grains can be produced in the atmospheres of thermally pulsing low-mass AGB stars (Gallino et al. (1994)). Most of these presolar SiC grains seem to be large with equivalent spherical diameters between 0.3 and 3 m (Amari et al. (1994)), but also very large grains up to 26 m are present. Such large grains can probably only be formed during extreme mass loss phases or in clumps of high density (Bernatowicz et al. (1996)). So far there is no spectroscopic evidence for SiC grains in the diffuse interstellar medium. This fact is not yet satisfactorily explained although core-mantle, inhomogeneous, or very large grains may offer a solution (Ossenkopf et al. (1992); Kozasa et al. (1996); Andersen et al. (1998)).
The 11.3 m feature in carbon star spectra displays some interesting variability which may offer the possibility to characterize more closely the composition and structure of cosmic SiC grains. Little-Marenin (1986) analyzed 176 spectra of bright infrared sources in the IRAS LRS database and found for 4% of the carbon stars a feature shifted to 11.6 m. The majority of the features peaked at 11.15 0.10 m with a FWHM of 1.6 0.15 m. The statistical analysis of spectra of class 4n revealed some more variety with only part of the spectra peaking at 11.3 m and a second peak at 11.7 m appearing when the ratio of feature to continuum decreases (Baron et al. (1987)). A very thorough study of 718 LRS spectra of carbon stars based on autoclassification methods was performed by Goebel et al. (1995) who also found a weakening, broadening and shift (to 11.9 m) for classes of objects with a low continuum temperature. The ground-based data obtained by Speck et al. (1997) also show in about one third of the features a peak at wavelengths larger than 11.4 m, but without a strong correlation to the blackbody temperatures.
A definite explanation of these spectral differences in terms of an identification of a well-defined silicon carbide material as carrier of the 11+ m feature would be very valuable, because it could provide important information concerning grain condensation mechanisms and the conditions within circumstellar grain-forming regions. Unfortunately, this task is complicated by (i) the presence of only one relatively broad band, (ii) some uncertainty in the location of the continuum due to nearby molecular bands (Hron et al. (1998)) (iii) possible contribution from carbonaceous material to the emission, (iv) the extreme sensitivity of the SiC band profile to particle size and shape effects, (v) the appearance of many different SiC crystal types (polytypes), (vi) the possibility of disordered structures, and (vii) the influence of material impurities on the band profile.
Three different explanations of the observed band variety have been given so far. Baron et al. (1987) and Goebel et al. (1995) found a correlation of the apparent band shift to the appearance of a feature at about 8.5 m as well as to an increase in the FIR flux and attributed these combined spectral changes to an increasing contribution by hydrogenated amorphous carbon (a:C–H). Speck et al. (1997) explained the different band profiles by different crystal types of the SiC grains and tried to fit the UKIRT spectra to laboratory spectra (see below). Papoular et al. (1998) showed that also different grain shapes can produce the observed variation in band shape.
Considering this complexity of the identification problem (see also Sandford (1996)), detailed laboratory investigations on the infrared spectrum of SiC particles unfortunately are scarce both in the physical/chemical and the astronomical literature. Most popular among astronomers are the studies by Stephens (1980) on laser-produced -SiC condensates, Friedemann et al. (1981) on commercially available -SiC, and Borghesi et al. (1985) on commercially produced - and -SiC. More recently, Papoular et al. (1998) investigated two samples of -SiC powders, one produced by laser pyrolysis and one which was commercially available. In the earlier papers, influential factors beyond the polytype remained mostly unexplored. Especially, the decisive influence of grain shape and size as well as of the surrounding medium (matrix) on the band profile, which was already discussed by Treffers & Cohen (1974) and later investigated in detail by Bohren & Huffman (1983), has not been treated correctly or even ignored by the majority of the authors. Papoular et al. (1998) urgently brought this topic back to mind and presented an exact method for the correction of matrix effects.
As already pointed out, the available experimental studies with a total of about 15 samples are by no means systematic. Moreover, the lack of good laboratory results led to some confusion concerning the influence of the crystal type on the band profile. The goal of our paper is to present experimental data on -SiC, -SiC, and amorphous SiC and to investigate experimentally size, shape, and matrix effects (Sect. 3 and 4). To give the discussion on the optical properties of different SiC polytypes a more exact foundation, we summarize in Sect. 2 basic facts on SiC bulk crystals and thin films and calculate theoretical spectra of small SiC grains for different polytypes. In Sect. 5 we discuss in which way the new data can serve the observers for an evaluation of their data in terms of the SiC hypothesis.
2 Basic facts on structural and infrared optical properties of SiC
2.1 Crystal structure of SiC
The crystal structure of SiC shows pronounced polytypism which means that there exist a number of possible crystal types differing in only one spatial direction (see Fig. 1). The basic units from which all polytypes are built are Si-C bilayers with a three-fold symmetry axis, in which the Si- and C-atoms are closely packed. These bilayers are stacked on top of each other while they are laterally shifted by 1/ of the Si–Si or C–C atomic distance in the layer either in the [1̄100]- or in the opposite direction. Hence, each Si atom is tetrahedrally surrounded by four C atoms and vice versa. If all shifts occur in the same direction, then an identical position of the bilayer in the projection along the hexagonal axis is reached after three stacking steps. The resulting structure is of cubic symmetry and because of the three-step stacking period this polytype is called 3C (C for cubic, Ramsdell (1947)). Another name for this polytype, which is the only cubic one, is the often-used term -SiC. The environment of each Si-C bilayer in the stack, which is determined by shifts in the same direction at each step, is also called cubic.
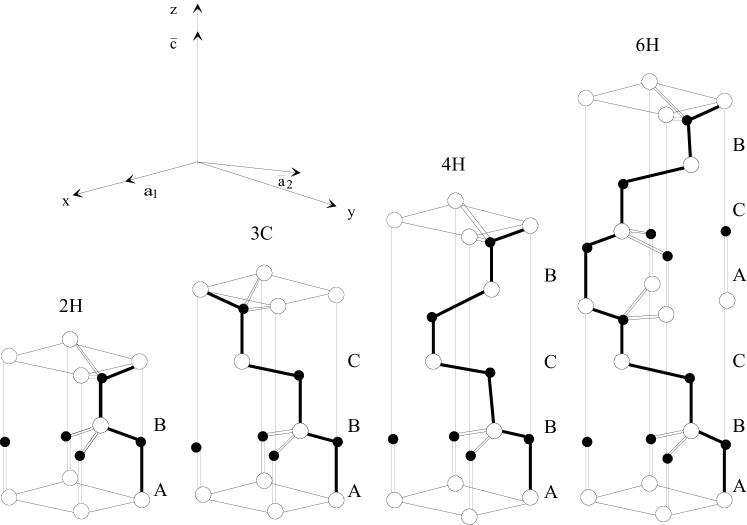
The other extreme is obtained, when the bilayers are shifted alternatingly in opposite directions such that, in projection with the hexagonal axis, every other layer has the same position. The lattice is then of hexagonal type, and because of the two-step period the polytype is called 2H. The environment of each Si-C bilayer which has been produced by the alternating shiftes is also called hexagonal.
All other polytypes are built up by a characteristic sequence of cubic and hexagonal Si-C bilayers, for which the 3C and 2H polytypes represent the limiting cases. All polytypes except 3C are uniaxial crystals (optical axis = c-axis) and belong either to the hexagonal or to the rhombohedric system. The most abundant polytypes besides 3C and 2H are the hexagonal types 6H and 4H and the rhombohedric 15R. For historical reasons any non-cubic polytype or mixture of polytypes is also designated by the term -SiC.
The ratio of the numbers of hexagonal to cubic bilayers is called hexagonality and is a very useful scaling parameter. Several properties of the polytypes change with this parameter, e.g. structural properties such as the lattice constants (see, e.g., Madelung (1982); Bechstedt et al. (1997)), the energy of the indirect band gap (Feitknecht (1971); Choyke (1990)), and certain phonon frequencies (Nakashima et al. (1987); Hofmann et al. (1994)), which will be discussed below.
2.2 Lattice vibrations of bulk SiC and thin films
| Polytype | h(%) | E1T | A1T | E1L | A1L | |||||||||||||||||||||||||||
|---|---|---|---|---|---|---|---|---|---|---|---|---|---|---|---|---|---|---|---|---|---|---|---|---|---|---|---|---|---|---|---|---|
| 3C | 0 |
|
|
|
|
|||||||||||||||||||||||||||
| 6H | 33 |
|
|
|
|
|
|
|
||||||||||||||||||||||||
| 15R | 40 | (exp., av.) | 797.5(8,34) | 965.0(34) | 6.53(38) | 6.70(38) | ||||||||||||||||||||||||||
| 4H | 50 |
|
|
|
|
|
|
|
||||||||||||||||||||||||
| 2H | 100 |
|
|
|
|
|
|
|
||||||||||||||||||||||||
| 1 | Feldman et al. (1968a) | 16 | Mel’nichuk & Pasechnik (1992) | 31 | Zorba et al. (1996) |
|---|---|---|---|---|---|
| 2 | Feldman et al. (1968b) | 17 | Engelbrecht & Helbig (1993) | 32 | Falkovsky et al. (1997) |
| 3 | Mitra et al. (1969) | 18 | Hopfe et al. (1993) | 33 | Gottfried et al. (1997) |
| 4 | Colwell & Klein (1972) | 19 | Choo et al. (1994) | 34 | Nakashima & Harima (1997) |
| 5 | Klein et al. (1972) | 20 | Liu & Vohra (1994) | 35 | Peiter (unpublished) |
| 6 | Olego & Cardona (1982a) | 21 | Yamanaka et al. (1994) | 36 | Hofmann et al. (1994) |
| 7 | Olego & Cardona (1982b) | 22 | Harima et al. (1995) | 37 | Shaffer & Naum (1969) |
| 8 | Nakashima et al. (1986) | 23 | Nienhaus et al. (1995) | 38 | Shaffer (1971) |
| 9 | Mukaida et al. (1987) | 24 | Sciacca et al. (1995) | 39 | Powell (1972) |
| 10 | Nakashima et al. (1987) | 25 | Zorba et al. (1995) | 40 | Pikhtin et al. (1977) |
| 11 | Okumura et al. (1987) | 26 | Arnaud et al. (1996) | 41 | Bogdanov et al. (1982) |
| 12 | Yugami et al. (1987) | 27 | Feng et al. (1996) | 42 | Ninomiya & Adachi (1994) |
| 13 | Feng et al. (1988) | 28 | Hu et al. (1996) | 43 | Moore et al. (1995) |
| 14 | Salvador & Sherman (1991) | 29 | Perez-Rodriguez et al. (1996) | 44 | Logothetidis & Petalas (1996) |
| 15 | Yoo & Matsunami (1991) | 30 | Steckl et al. (1996) | 45 | Chen et al. (1994) |
As in any other ionic crystal, the interaction of SiC with infrared light is clearly dominated by the fundamental vibrations of the Si- and C-sublattices against each other. The excitation of these phonons produces strong features in the wavelength range 10–13 m, observable e.g. in reflectance measurements as a nearly 100% reflectivity (so-called reststrahl band). The absorption coefficient (depending on the crystal quality) can be up to several 105 cm-1. Therefore, transmission measurements in this spectral region are only possible by using samples with effective thicknesses below some 100 nm.
In general, the frequencies of the involved longitudinal (LO-) and transverse (TO-) optical phonon modes depend on their polarization direction in relation to the c-axis. One reason for this behaviour - in simplified words - is the slight stretching of the basic tetrahedra in c-direction causing a smaller force constant in hexagonal double layers compared to the cubic ones (Nakashima et al. (1987)). One limiting case are the modes polarized parallel to the basal plane (perpendicular to the c-axis, E1 modes), which are very similar for the different polytypes. Their frequencies differ not more than 3–4 cm-1 (Feldman et al. (1968b); Nakashima et al. (1987); Hofmann et al. (1994)). The other limiting case are the modes polarized parallel to the c-axis (A1-modes), which have a smaller resonance frequency than the E1 modes. For the transverse modes, the difference is nearly proportional to the fraction of hexagonal double layers (the hexagonality parameter h) in the polytype. This difference was experimentally found to be cm h (Feldman et al. (1968b); Nakashima et al. (1987)) and theoretically calculated with cm h (Hofmann et al. (1994)).
Averaged values of published data of the mode frequencies of some polytypes, determined by Raman and infrared measurements, are given in Table 1. For comparison, theoretical values derived from the bond charge model (Hofmann et al. (1994)) are also given. For the 3C polytype, the maximum deviations of the single published frequencies from the average values in Table 1 are 1.9 (TO) and 1.2 cm-1 (LO). The biggest deviations for the E1T, A1T, E1L, and A1L modes of the 6H polytype are 1.0, 0.9, 1.3, and 1.7 cm-1, respectively.
The data by Spitzer et al. (1959a) for the TO- and LO mode frequencies of the 3C polytype, which have been often used in astronomical papers, seem to deviate systematically from the mean values (-1.9 cm-1 and -2.0 cm-1, respectively). For the E1T and A1L mode frequencies of the 6H polytype (Spitzer et al. (1959b)), the deviations are even bigger (-3.1 and -4.6 cm-1, respectively). These deviations probably indicate limited accuracy either of the measurements or of the fits in this work compared to newer ones. Therefore, we exclude these results from the the averaging. Including them would result in shifts of the mean values by an amount of up to 0.4 cm-1.
Depending on the complexity of the polytype structure, there are a number of weak modes in addition to the strong modes discussed so far. With increasing unit cell length and, therefore, increasing number of atoms in the unit cell, the number of branches in the Brillouin zone increases. Because these branches can be folded back to the phonon dispersion curve of the basic 3C-SiC polytype with the largest Brillouin cell (Patrick (1968)), these polytype-specific highly anisotropic modes are called zone-folded modes. They can be observed by Raman spectroscopy (e.g. Feldman et al. (1968a); Nakashima & Harima (1997)), infrared reflectance (e.g. Il’in & Rashevskaya (1973); Pensl & Helbig (1990)) and transmittance measurements with very thick samples (e.g. Dubrovskii & Radovanova (1973)).
The peak absorption coefficient caused by these folded modes is approximately 102 cm-1. Because this is three orders of magnitude lower than the value for the strong bands, the weak modes are practically not observable in astronomical spectra. The same is true for the combination modes of lattice vibrations which cause additional weak absorption effects e.g. in the spectral region 1250–1700 cm-1 (two-phonon combination modes, Patrick & Choyke (1961)).
2.3 Modelling the infrared optical properties of SiC
SiC can be regarded as a textbook example concerning the modelling of reflectance spectra of bulk and thin film samples (e.g. Bohren & Huffman (1983); Mel’nichuk & Pasechnik (1992); Engelbrecht & Helbig (1993)) and of transmittance spectra of thin films (e.g. Spitzer et al. (1959a)) by a Lorentz-oscillator model of the dielectric function. In many cases it is sufficient to regard only the strong modes so that the dielectric function parallel and perpendicular to the optical axis can be parametrized by a simple one-phonon Lorentz term:
| (1) |
with
| (2) |
Here the quantities () and () are the frequencies of the E1T (E1L) and A1T (A1L) modes, respectively, the plasma frequencies represent the oscillator strengths and the describe the phonon damping (line width) of the corresponding mode. The quantity is the high-frequency dielectric constant caused by the system of the valence electrons, which is measured in the visible and NIR spectral range. Some average experimental and theoretical values of from the literature are given in Table 1. The scattering of the experimental data in the literature is relatively large (up to 0.2) but the agreement of the average values with the theoretical data by Chen et al. (1994) is satisfactory.
The damping constant (inverse proportional to the phonon life time) is an ”ad hoc” introduced parameter, which in a perfect crystal reflects the anharmonicity of the potential curve. On the one hand, the phonon lifetime is limited by coupling processes, opening energy dissipation channels. On the other hand, phonons are scattered at crystalline defects. Therefore, the damping constant can be taken as a measure of crystallinity. High-quality SiC is characterized by damping constants of 1–3 cm-1. These values are reached by bulk crystals (Peiter, unpublished) as well as by micron-thick CVD-grown layers produced at relatively high temperatures (Zorba et al. (1995)). Single-crystalline layers grown by solid-source MBE at lower temperatures show damping constants down to 5 cm-1 (Pfennighaus et al. (1997)). Polycrystalline layers produced for instance by sputtering or laser ablation require damping constants of several 10 cm-1 in the modelling (Hobert et al. (1999)).
2.4 Influences of real structure and impurities

In the preceding sections more or less perfect SiC crystals have been considered. However, for SiC grains grown by kinetically controlled reactions in the outflow of carbon stars it is important to take the influences of structural disorder, non-stoichiometry, and impurities on the infrared absorption into account.
Great experience on these effects is already available from thin film studies. The influence, e.g., of disorder up to complete amorphousness, has been investigated with films produced either by implantation of carbon ions into silicon wafers (e.g. Kimura et al. (1981); Serre et al. (1996)) or by amorphization of crystalline SiC by ion irradiation (Zorba et al. (1996); Musumeci et al. (1997)). The phonon band profiles of these films in some cases still have been described by the Lorentz oscillator model with a very large damping constant of about 200 cm-1 (Zorba et al. (1996)). However, very often a change of the band profile from Lorentzian to Gaussian shape is observed (e.g. Basa & Smith (1990); Musumeci et al. (1997)). The modelling of these spectra requires a Gaussian distribution of oscillators. Additionally, the centre of the oscillator frequencies shifts to smaller frequencies by several 10 cm-1. The reasons for these effects are the variation and the (on average) increase of the bond lengths in the amorphous solid compared to the crystalline one. Additionally, the break-down of the k0 selection rule causes contributions from the whole optical branches to the absorption spectrum. Both the broadening and the shift of the absorption feature can be avoided or inverted by high temperature during or after the sample preparation, which supports recrystalization (see, e.g., Durupt et al. (1982)).
Non-stoichiometry, especially carbon deficiency, leads to the occurrence of separated SiC grains in some kind of matrix. The phonon band observed at such samples is shifted to higher frequencies (Yoshii et al. (1991); Lundquist et al. (1995)), which has been attributed to surface excitations of the SiC grains (Bean & Newman (1971)). In contrast to this, carbon excess leads to additional continuum absorption caused by the semi-metallic character of the graphitic excess carbon.
Impurities and defects incorporated into the SiC crystal produce besides a slight increase of the phonon damping (e.g. Il’in et al. (1972); Harima et al. (1995)) the following effects: a) localized vibrational modes (Newman (1990); Engelbrecht & Helbig (1994)), b) photoionization bands of impurity atoms (e.g. Dubrovskii & Radovanova (1971); Purtseladze & Khavtasi (1972)), and c) free charge carrier absorption. The resulting absorption coefficient from these impurity-induced effects is in bulk material and films usually two or more orders of magnitude smaller than the contributions from the strong phonons. The free charge carrier absorption, dominant at longer wavelength and higher temperatures, depends on the degree of doping (Kulakowskii et al. (1975)) and may become so strong that it can be observed even in the mid-IR reflectance (carrier density 41017cm-3) (Imai (1966); Mel’nichuk & Pasechnik (1992)). The longitudinal optical phonon and the free charge carrier collective oscillation (plasmon) generally form coupled modes which occur in two branches (L+ and L-) at the high and low frequency sides of the reststrahl region (Holm et al. (1986); Sasaki et al. (1989)). The modelling of such spectra requires an additional oscillator term representing the response of the free charge carrier gas to electromagnetic excitation (so-called Drude term) in Eq. (1). This Drude term has a similar structure as the Lorentz term, but with the resonance frequency being zero and the plasma frequency being proportional to the square root of the charge carrier density.
2.5 Theoretical absorption spectra of very small spherical and ellipsoidal SiC grains of different polytypes
In contrast to bulk material, the vibrational absorption bands of small grains are determined by surface modes which occur between the LO- and TO-frequencies of strong modes, the exact position depending on size, shape, and the medium surrounding the grains (Bohren & Huffman (1983)). Within the limit of particles very small compared to the wavelength (quasistatic or Rayleigh limit), there exist simple and exact formulae for the calculation of absorption spectra of ellipsoidal grains from the dielectric function. An ensemble of such (identically shaped) grains embedded in random orientation in a matrix with the dielectric constant will cause three sharp spectral features (surface modes) at the resonance frequencies , (i=1,2,3) where the geometrical factors Li (L0, Li=1) characterize the lengths of the principal axes of the ellipsoids (Li=1/3 for spheres, 0, 1/2, 1/2 for needles, 0, 0, 1 for discs, see also Papoular et al. (1998)). Unfortunately, for arbitrary, especially sharp-edged shapes, theory is still far from the ability to determine the absorption profile caused by surface modes of grains. A widely used possibility for providing a rough estimate for the absorption spectrum of a collection of real particles is the continuous distributions of ellipsoids (CDE) introduced by Bohren & Huffman (1983). Besides this (rather extreme) uniform distribution of all possible ellipsoidal shapes we also use a variation of the CDE which considers a weighted distribution with maximum probability for spheres (m-CDE, Ossenkopf et al. (1992)).
From the dielectric function Eq. (1) with the resonance frequencies and high-frequency dielectric constants given in Table 1 we have calculated theoretical infrared absorption spectra for small SiC spheres as well as for the two CDE approximations, all in a vacuum environment. The results of these calculations for the polytypes 3C (-SiC), 2H, 4H, and 6H are given in Fig. 2. A damping constant =2 cm-1 which is characteristic of a good-quality crystal (see Sect. 2.3) was used. The orientations of the crystal axes with respect to the polarizations of the incoming radiation have been averaged by considering one third of the axes being oriented parallel and two thirds normal to the polarization direction.


The calculated band profiles show the expected striking dependence on the grain shape distribution. For spherical grains very sharp resonances occur, whereas for the CDEs the wide distribution of shapes results in broad bands between the LO and TO frequencies. For the anisotropic modifications (the -SiC polytypes 2H, 4H, and 6H), the two principle orientations produce their own resonances in the sphere-spectra. The positions of the resonances are 10.71 m for the 3C-, 10.73 m and 10.77 m for the 6H-,10.75 m and 10.80 m for the 4H-, and 10.68 m and 10.78 m for the 2H-modifications, respectively. For comparison, the resonance positions using the data by Spitzer et al. (1959a,b) would be 10.72 m for 3C-SiC, and 10.73 m and 10.84 m for 6H-SiC.
| product name | polytype | max.size | shape | purity | prod.meth. |
|---|---|---|---|---|---|
| (m) | (wt.%) | ||||
| AJ- | (6H) | 2 | irr. | 99.8? | probably Acheson |
| ESK | (6H) | 2 | 98 | Acheson | |
| Lonza UF-15 | (6H) | 1 | probably Acheson | ||
| Duisburg | (6H) | 40 | irr. | probably Acheson | |
| Piesteritz (green) | (6H) | 150 | irr. | 98.8 | Acheson |
| Piesteritz (black) | (6H,4H) | 150 | irr. | 96.4 (C) | Acheson |
| AJ- | 1 | irr. | 96.5 | ||
| AJ whiskers | 2 x 60 | wh. | 99.5? | ||
| Plasmachem | (6H) | 0.5 | reg. | 95.2 (SiO2,Si3N4) | plasma |
| Starck B20 | 0.6 | irr. | 95 | ||
| Japan | 0.5 | irr. | GPP | ||
| Dresden | (6H) | 0.3 | reg. | 83.6 (Si3N4,Si) | GPP, polysilazane |
| Riga | 86 (Si3N4,Si) | plasma | |||
| Berlin | 0.5 | irr. | 85 (C) | plasma, SiCl4 | |
| Jena | reg. | laser pyr., SiH4,C2H2 | |||
| Jena-N | reg. | laser pyr., SiH4,C2H2,NH3 |
The CDE spectra for the polytypes essentially differ in a shoulder at the long-wavelength side of the profile, which is also caused by the anisotropy. Since the TO-frequencies in the two principal orientations deviate from each other, the band profile extends to different spectral positions which results in a shoulder after the orientations have been averaged. The difference of the E1T and A1T frequencies and consequently the broadness of the shoulder is correlated to the hexagonality in the sense that for the 6H modification the shoulder is only 0.14 m broad but for the 100% hexagonal 2H modification its width is 0.48 m. In the m-CDE the shoulder is not present since the extreme shapes producing it have about zero probability.
So far we have only considered the strong phonon modes. To check if the weak “zone-folded” modes could deliver a criterion useful for distinguishing the polytypes in small-particle spectra, we show in Fig. 3 as an example a calculated absorption spectrum of the 6H polytype, which includes the weak modes. These have been represented by two additional oscillators with the TO- and plasma-frequencies =883.8 cm-1, =50 cm-1, =888.6 cm-1, =45 cm-1 and with =2 cm-1 for both oscillators. The effect of the weak modes is the appearance of two very weak features at their TO-frequencies, interestingly as dips in the CDE spectra. Note that after averaging with the two times stronger contribution of the perpendicular orientation these features will be even weaker and hardly detectable in astronomical spectra. No influences on the resonance positions and the limiting frequencies of the band have been found.
Fig. 4 shows calculations using a higher damping constant of =10 cm-1 which would characterize less structurally perfect crystals but material still far from amorphousness. The calculations have been done for the most abundant -SiC polytype (6H) and for -SiC. They show that for such less perfect crystals the anisotropy effects in the -SiC spectrum are nearly smeared out. The double feature of the spheres merged into one band with a peak position very close to that of the -SiC spheres. The shoulder in the CDE spectrum at changed into a smooth slope which is only a little less steep than for the -SiC.
Therefore, the result of the theoretical considerations presented in this section is that the small differences between the phonon frequencies of the SiC polytypes lead to detectable features in small-grain spectra only if the crystal structure of the grains is very perfect. Even in this case it is required that either the grains have a very definite shape (e.g. spherical) in order to produce sharp resonances, or that there is a sufficient amount of very elongated structures to produce enough absorption at the TO frequency so that the shoulder caused by the anisotropy of this frequency can be seen. The latter seems not totally unrealistic. However, we would like to stress that in any case the differences will be more marginally and that (in agreement with Papoular et al. (1998)) the general appearance of the feature as well as the peak position only depend on the grain shape.
3 Transmission measurements on SiC particles
3.1 Materials and measurements
We studied 16 different SiC powders which are partly of commercial origin and partly laboratory products (see Table LABEL:mattab). The names we assigned to these samples serve only for an easier distinction. For some of the commercial powders, information about the production route and the purity is very poor. Catalogue values of purity take in some cases only metal impurities into account and not the major pollutants: free C, Si and SiO2.
Generally, the samples fall into two groups. The first one is the commonly used SiC for grinding application, which is produced from quartz and coal in an electric furnace at very high temperatures (about 2500∘C, Acheson process). These powders are often large in grain size (Piesteritz, Duisburg) but ESK, Lonza and probably AJ- also belong to this group. All of these high-temperature products consist of -SiC (dominated by the 6H polytype).
The second group is produced from gaseous or liquid precursors in some kind of pyrolysis which may be induced by a plasma discharge, laser irradiation or simply by heating. This kind of process is capable of producing very fine (submicron) powders and allows easy mixing with other components such as Si3N4. Therefore, a huge variety of such processes and products has already been studied in the literature. The polytype of these grains is usually 3C (-SiC), but depending on the process temperature also -modifications (higher T, see Dresden, Plasmachem) or even amorphous components may occur. The purity is mostly not worse than that of the high-temperature products (if not otherwise desired as the Si3N4 component in Dresden and Riga) and the major impurities are the same (free C, Si, oxide). For the sake of comparison we also have one product with a big carbon excess (Berlin).
For astrophysically motivated studies, SiC samples from pyrolysis processes are certainly preferable to the high-temperature products. Cherchneff (1997) investigated SiC particle formation in stellar atmospheres and showed that hydrogen must play an important role in the formation chemistry. In hydrogen-deficient environments as R CrB and Wolf-Rayet star atmospheres, SiC emission is not observed. The formerly proposed formation mechanism of SiC in carbon stars by reaction of SiC2 and Si was shown by Willacy & Cherchneff (1998) not to be efficient enough to produce the observed quantities of SiC dust. If this is true, the pyrolysis processes which in nearly all cases start from hydrogen compounds of C and Si, will correspond much better to the astrophysical grain formation process.
For all powders we determined the polytype(s) by X-ray diffraction as well as grain shape and size by optical or transmission electron microscopy (Table LABEL:mattab). For the Piesteritz products which have already been studied by Friedemann et al. (1981), the X-ray analysis revealed a simpler composition than that supplied by the producer which was published by Friedemann et al. (1981).
Infrared spectra in the wavelength range 2–25 m have been recorded with a Bruker 113v FTIR spectrometer on the SiC powders embedded in KBr pellets with a dilution of 0.001, which corresponds to a SiC column density = 0.00015 g cm-2. From the measured transmission T we derived the mass absorption coefficient = ln(1/T)/. Though this paper refers to infrared properties, it was necessary to follow some of the spectra into the visible range. Fortunately, KBr is transparent down to a wavelength of about 0.2 m. Thus, UV/VIS spectra could be measured with the same pellets using an Perkin Elmer Lambda 19 spectrometer.
3.2 Spectra of high-temperature SiC
Figure 5 shows the absorption spectra of four high-temperature products in the phonon band range. The three fine-grained powders ESK, Lonza UF-15 and AJ- have very similar bands between about 10 and 13.5 m with the peak at 11.9–12.0 m and two shoulders at 10.7 m and 12.8 m. The maximum value of the mass absorption coefficient is between 15,000 and 20,000 cm2g-1. The profiles and absolute values are also very similar to those reported by Friedemann et al. (1981) and Borghesi et al. (1985), including the shoulders. These have been attributed by Friedemann et al. (1981) to signatures of the transverse and longitudinal optical (volume) modes. However, in the light of Sect. 2. we note that at least for the shoulder at 10.7 m this cannot be true because the position of the LO mode is at shorter wavelength. The shoulders will be discussed further in the following sections. Additionally we note here that there is only very weak continuum absorption at least at shorter wavelengths. To our experience, the continuum is mostly correlated to the degree of free carbon pollution in the sample.
The spectrum of sample Duisburg is characterized by a more or less uniform level of relatively small extinction with a sharp minimum at 9.6 m. This behaviour is determined by scattering and is typical for large grains with diameters of 10 m and more (Andersen et al. (1998)). If, as indicated by studies of meteoritic SiC, large SiC grains occur in the interstellar medium, their different spectral appearance would prevent them from infrared detection. For the even coarser powders Piesteritz (green) and (black) with grain sizes of more than 100 m, the measured spectra are similar to the one of the Duisburg sample but, as expected, give even less. Size effects will be treated further in Sect. 3.4.

3.3 Spectra of pyrolysis products

Figure 6 shows the absorption spectra of the pyrolysis products and, for comparison, of one high-temperature SiC. Most of the spectra have been measured down to a wavelength of 0.5 m because a large part of them unexpectedly revealed an additional strong and extremely broad absorption feature, which extends in some cases from the visible range to the phonon band region. The feature partly overlaps with the phonon band and appears in first approximation as a kind of continuous background to the latter.
At a closer view to the literature, one recognizes that such a broad feature or background is also present in the SiC spectra measured by other authors (e.g. Borghesi et al. (1985) - -SiC, Koike & Shibai (1998) - sample Ibiden). Therefore, we have to state that this kind of absorption obviously is a common spectral characteristics of many SiC pyrolysis products. In contrast to this, we did not observe the broad absorption in high-temperature SiC samples (see spectrum of AJ-). It certainly is not restricted to the -polytype as is demonstrated by the -SiC samples Dresden, Plasmachem, and Ibiden (Koike & Shibai (1998)).
The extreme broadness of the feature excludes lattice vibrations as the carriers of this absorption and strongly favours collective vibrations of free charge carriers (plasmons). In small-particle spectra, free charge carrier absorption (similar to phonons) causes strong surface modes at frequencies smaller than the plasma frequency (Bohren & Huffman (1983)). These surface modes are very well known for metal particles (Kreibig (1996)) where they occur at visible wavelengths but also for doped semiconductors (Rieder et al. (1972); Yamamoto et al. (1985)).
The free charge carriers may have been introduced to the SiC by impurities, as has been already briefly discussed in Sect. 2.4. One possibility is the incorporation of nitrogen which, because of its five valence electrons, may produce donor levels at different energy depths in the band structure (Chen et al. (1997)). For the samples Riga, Plasmachem and Dresden the elemental analysis clearly detected a nitrogen content. The corresponding spectra are characterized by an especially high plasma frequency. Since the plasma frequency of a free-electron gas is proportional to the square root of the charge carrier density, this supports the explanation of the broad absorption features by nitrogen incorporation. As a test of the nitrogen hypothesis we prepared a nitrogen-doped SiC sample by adding a small percentage of NH3 to the reactants. Indeed the doped sample (Jena-N) shows the free charge carrier absorption in contrast to the undoped one (Jena). These investigations will be the subject of a future paper (Clément et al., in prep.).
The phonon band profiles of the pyrolysis products show a large variety of shapes, which are obviously not related to the polytype. The samples which do not possess the free charge carrier feature but only the typical scattering increase towards short wavelengths (Jena and Berlin), have phonon bands relatively similar to those of the high-temperature powders (compare AJ-). A more detailed look on the band profiles, however, reveals that the pyrolysis products show the band maximum at 12.2-12.3 m, which is significantly longward from the AJ- peak. Furthermore, the typical shoulders of the high-temperature SiC are lacking. The Jena-N sample, although it shows the free charge carrier absorption, has a similar phonon band feature. The small band at about 8–9 m seen in this and the Plasmachem spectrum is due to surface oxidation. The Berlin spectrum, additionally, shows a background absorption of about 2000 cm2g-1 which is due to the free carbon excess (see Table LABEL:mattab). One of the most interesting phonon features is the double-peaked one of the AJ whiskers, which will be discussed in the following section.
The phonon bands of the Riga and Plasmachem samples are very weak. The reason for this is totally unclear because the purity of these samples is better than the one of, e.g., sample Dresden. One possible explanation for the weakness of the phonon band might be the interaction with the plasmon. This interaction is rather obvious for the samples Japan, AJ-, and Starck where the free charge carrier feature occurs at relatively large wavelengths. These spectra show round-shaped phonon bands peaking at very short wavelengths (between 11.1 and 11.4 m). The sharp depressions at 10.2 and 12.8 m limiting the spectral ranges of the phonon bands, and the absorption maxima at wavelengths larger than 13 m point to the theoretically expected coupling of the LO phonon to the plasmon (Sasaki et al. (1989); DiGregorio & Furtak (1993), see also Sect. 2.4).
Consequently, free charge carriers in SiC grains do not only cause near-infrared absorption, but also determine the apparent shape of the phonon band if the plasmon resonance is relatively close to the phonon frequency. Both facts need to be considered for cosmic SiC grains, especially because nearly 1 at.% of nitrogen is contained in the meteoritic presolar SiC (Hoppe et al. (1994)).
3.4 Size, shape, and matrix effects

Size effects on the appearance of the SiC infrared extinction have been recently studied by Andersen et al. (1998) focussing on relatively large grains where scattering is dominating over absorption. We focus here on much smaller size fractions which we separated by sedimentation in acetone from the sample AJ- with an original maximum grain size of 2 m according to the producer. The band profiles of four size fractions are shown in Fig. 7, they may be compared with the spectrum of the original sample in Fig. 5. The main change in the spectra of the different size fractions concerns the long-wavelength shoulder at about 12.8 m which obviously disappears for the smallest size fraction. The same effect we observed for the other high-temperature samples. Consequently, we can be sure that also the shoulders found by Friedemann et al. (1981) and later authors around the position of the TO frequency indeed are due to contributions from bulk absorption (Bohren & Huffman (1983)) and will vanish for very small particles.

After correcting for the size effect, the phonon bands of our high-temperature samples nicely fit into the LO-TO interval 10.2–12.7 m, but still have the shoulder at about 10.7 m. Our calculations in Sect. 2.5 do not predict such a shoulder at the short-wavelength side of the band. In other words, it is not probable that this shoulder is caused by the weak anisotropy of the LO-mode frequency limiting the absorption band at the short-wavelength side. The anisotropy is much stronger for the TO frequencies where no shoulder is observed.
If the optical constants of a material do not explain a feature of the band profile, according to Sect. 2 it must be caused by the grain morphology. Unfortunately, theory so far has no exact tool for the calculation of phonon band profiles for arbitrary particle shapes. Moreover, from the experimental side the situation is complicated by the fact that the SiC particles concentrate at the inner grain boundaries of the KBr pellet and form agglomerates the morphology of which is difficult to study. A simple approach to shape effects used e.g. by Papoular et al. (1998) is the approximation of real grain shapes by ellipsoids. In this framework any frequency in a band profile can be assigned to a geometrical resonance due to a special ellipsoidal shape characterized by the shape parameter L (see Sect. 2.5). The positions of the peak and the shoulder (835 and 935 cm-1) of the smallest size-fraction of Fig. 7 would correspond to shape parameters of 0.08 and 0.55, respectively, which points to more prolate structures. This result could mean, that elongated agglomerates dominate in the KBr pellet. Considering the limitations of the ellipsoid approach, however, such an interpretation remains doubtful. We stress here, that for future studies of shape effects it is important to separate the influence of agglomeration.
Figure 8 compares the already discussed profile of a high-temperature product (AJ-) with some typical band profiles of pyrolysis samples as well as with theoretical spectra from Sect. 2.5. All the samples belong to the -SiC polytype. The Berlin spectrum, which is also representative of the Jena samples, still resembles the high-temperature spectrum but peaks at a larger wavelength (12.2 m) and has no distinct shoulder. It is the only spectrum which may be related in some way to the theoretical CDE spectrum, pointing to the presence of a wide distribution of shapes. However, it is obvious that the CDE model is insufficient to describe real band profiles. Therefore, in the case of SiC it cannot be used e.g. for the derivation of optical constants from IR absorption spectra of SiC particles. The m-CDE which initially was considered to be a more realistic distribution is even worse in reproducing the measurements, except for the AJ- spectrum. However, the band profiles of this and also the Japan and Starck samples (comp. Fig. 6), which all peak at very short wavelengths (11.1-11.4 m), obviously are strongly influenced by the phonon-plasmon coupling so that a discussion in terms of shape effects alone is meaningless. It should be noted that the -SiC spectrum published by Borghesi et al. (1985), which has been used for fits of astronomical spectra, seems to belong to the same class.
The most striking example of shape effects is certainly the AJ whisker spectrum. Similar spectra of SiC whiskers have already been published at different places (e.g. Pultz & Hertl (1966); DiGregorio & Furtak (1993)). All these spectra are characterized by two peaks, predicted by the theory to occur at the TO frequency where the shape parameter is zero (796 cm-1 or 12.6 m for -SiC) and at the frequency where Re()= - (shape parameter 0.5, 929 cm-1 or 10.8 m in KBr) (Bohren & Huffman (1983)). These positions are reproduced in our spectrum within 0.2 m. The deviations probably are due to the relatively large size of the whiskers.

All band profiles discussed so far have been measured with particles embedded in a KBr matrix which strongly influences the band shape. The matrix effects indeed are a big problem for comparisons of laboratory to astronomical spectra, since at the moment we are not aware of a good method to store any given powder sample in vacuum or in a gas for laboratory spectroscopy. Since theory is not in the position to calculate spectra for arbitrary grain shapes, it does not provide an exact method for correcting matrix effects either.
Papoular et al. (1998) recently published the already mentioned approach, which is valid under the assumptions that the particles have a distribution of ellipsoidal shapes, and that the band can be described by a Lorentzian oscillator. This method works perfectly in test calculations with simulated spectra (if one corrects the spectral intensities at the calculated new resonance frequencies for the changed density of the latter; this step is not mentioned in the paper). It was also demonstrated by these authors that the method allows estimates of the measurement results in different matrices. It is clear that the predictions of this theory are not exact because the theory of surface phonons of real grain shapes (if a practicable one exists) is not the one valid for ellipsoids. Moreover, anisotropy still has not been included in the ellipsoid approach. Nevertheless, the method is useful for the interpretation of SiC spectra, and should definitely be used for approximate matrix correction instead of the formerly applied shifting of the whole feature.
We have compared the predictions of Papoular’s method with measurements which nearly avoid the matrix effect. These measurements have been performed by means of an infrared microscope with samples dispersed on a NaCl substrate (Fig. 9). Thus, these grains are not fully but mainly surrounded by air. An important disadvantage of this method, which at the moment excludes it from being the solution to the matrix problem, is that the amount of material in the microscope aperture remains unknown. Therefore, the measurement is not quantitative but it reveals the shape of the band nearly without a matrix effect (compare also Andersen et al. (1998)).
For three representative samples, Fig. 9 displays both the measurements in KBr and with the microscope and, additionally, the matrix-corrected spectra in the interval –. For the calculations, the oscillator data of the 3C polytype and of the 6H polytype perpendicular to the c-axis (sample ESK) have been used since the latter dominate in a hexagonal crystal by 2:1 over those parallel to the c-axis. The dependence of the calculated band profile on these parameters (within reasonable limits) is not very strong. The figure shows that the microscope measurement confirms the blue-shift of the band center predicted by the calculation. This trend is expected because in a matrix of smaller refractive index the surface resonances have to shift to wavelengths where Re() of the particles is also smaller. The peak position and the shape of the profiles, however, are in only one case reproduced with satisfactory accuracy.
Besides the already discussed inadequacy of the theory, certainly experimental reasons contribute to the differences. One of them should be the residual influence of the substrate, which is known from measurements on metal particles (Kreibig (1996)). However, using a silicon substrate that has a much higher refractive index (Si: n=3.42, NaCl: n=1.5), we found no systematic change of the band profiles compared to the results on NaCl substrate. Another reason probably is the grain clustering that occurs both in the KBr pellets and on the NaCl substrate, but may result in different morphologies.
So at the moment, unfortunately, there is no perfect way to solve the matrix problem. Laboratory spectra of SiC and other particles with very strong vibrational or electronic bands should be compared to astronomical spectra only very carefully. For SiC we recommend the method according to Papoular et al. (1998) at least for a check of the possible matrix effect. Hopefully, also for this problem future measurements of non-agglomerated grains will bring more clarity.
4 Amorphous SiC
4.1 Preparation
Amorphous SiC was obtained by the polymer pyrolysis route (Clément (1996)). We started from the organometallic precursor dimethylpolysilane (–Si(CH3)2)n (Strem Chemicals) which first was converted to polycarbosilane (PCS) (–CH2–SiHCH3–CH2–Si(CH3)2)n (Yajima et al. (1976)). PCS reacts with oxygen and air moisture very quickly to silicon dioxide especially at higher temperatures. To prevent this reaction all preparational steps were performed in a glove box and the heating process under dried argon atmosphere.
For the different analyses we have produced the amorphous SiC both in film and powder forms. To obtain the films, a thick sheet of PCS was driven on Si substrates. For the powders the PCS was kept in an alumina boat. The samples were heated slowly in a quartz tube to temperatures between 873 K and 1323 K which were hold for one hour.
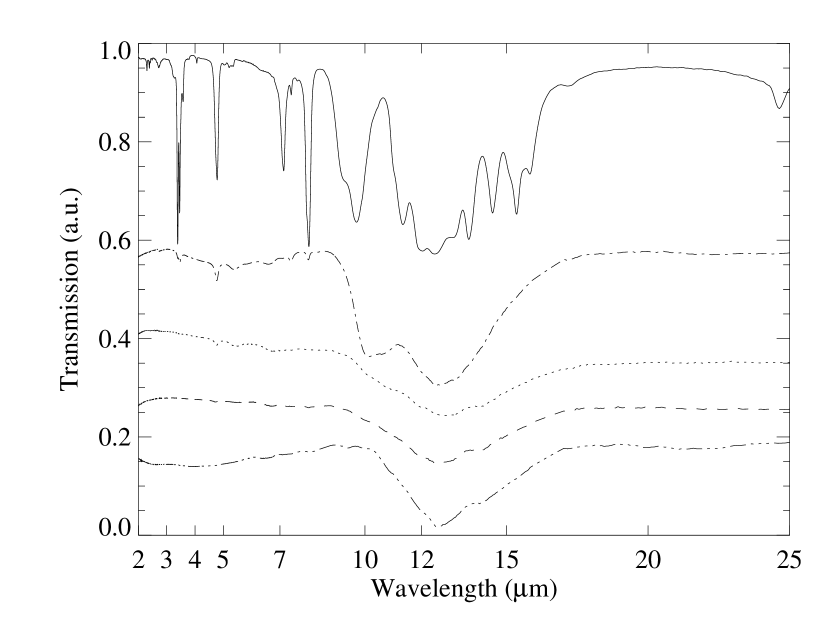
Figure 10 shows the development of the IR transmission spectra of the film samples with temperature. At temperatures lower than 1023 K the spectra still show features of the organic groups of the precursor PCS (see especially the feature at 4.8 m). Between 1073 and 1173 K, these features have vanished and one broad single vibrational band from 9.3 to 17.6 m peaking at 12.65 m with shoulders at about 12 and 14 m is observed. X-ray diffractometry of the corresponding powder-samples revealed only one broad Bragg reflex in the range from 30 to 40 o 2 (CuK radiation). Therefore, these samples can be considered to be in the amorphous state. Examination by energy-dispersive X-ray analysis gives about the stoichiometric ratio of silicon to carbon atoms.
At temperatures higher than 1223 K the infrared band becomes sharper, indicating the beginning crystallization of the sample (Fig. 10). At 1273 K the band ranges from 10.2 to 17.6 m with the peak position at the same wavelength as the amorphous samples . The X-ray diffractograms of these samples show narrower Bragg reflexes and a spike at the position of the (111) reflex of cubic SiC.
4.2 Optical data
The sample annealed at 1123 K is considered to be the best amorphous material and is chosen for the derivation of optical constants. The film geometry is ideal for this purpose because it can be modelled more exactly than a realistic particle shape, for instance. Additional measurements of the produced powders could not be performed because the production of a sufficient volume of submicron particles failed.
The layer thickness of the chosen sample, which is needed for the derivation of the optical data from the IR transmission spectrum, has been determined from reflectance spectroscopy in the UV and visible spectral ranges. The UV/VIS spectrum shows an interference pattern due to multiple reflection in the SiC layer which allowes the simultaneous fitting of the dielectric function of the layer material as well as of the layer thickness d. The dielectric function was modelled according to Eq. (1) by a constant = 3.81 and by two Lorentzian oscillators with = 48250 cm-1, = 57819 cm-1, = 12935 cm-1 and = 36185 cm-1, = 28492 cm-1, = 11732 cm-1, respectively. The film thickness and the real DF in the near infrared which is used later as the value for the evaluation of the mid-infrared transmittance spectrum were determined to be d = 65 nm and = 5.84, respectively. The latter value is by about 10 % smaller than the values for the crystalline modifications, which is explained by the usually smaller density of amorphous materials.
For the calculation of the complex refractive index from the IR transmission spectrum of the thin film on silicon substrate (1123K), a Lorentz-oscillator fit has been used, too. For an exact fit of the band range we applied a large number (37) of oscillators at different wavelength positions. The need for so many oscillators is a strong contrast to the properties of ”crystalline spectra” and reflects the presence of a wide distribution of vibrational modes due to the different bonding lengths in the amorphous material (comp. Sect. 2.4). The resulting complex refractive index is shown in Fig. 11. Compared to the bands of crystalline materials it is, as expected, much broader. The same holds for the small-particle absorption spectra calculated from these optical constants (Fig. 12, comp. Figs. 5, 6, 7). The accompaniing “features” at 7 and 22 m are artefacts caused by the limited accuracy of the substrate compensation.


5 Comparison with observations
The goal of this paper is to give a detailed laboratory basis for an interpretation of astronomical SiC profiles. We do not aim at analyzing these profiles here, this should be the task after more high-resolution ISO spectra have become available. However, we will discuss the relevance of some of our results for astronomical infrared spectroscopy.
If the interpretation of IRAS spectra by Goebel et al. (1995) and Baron et al. (1987) in terms of an a:C–H contribution is correct, then only the stars with relatively high continuum temperatures (class 4 in Goebel et al. (1995)) have features of purely SiC origin. These features peak always around 11.3 m. This is also supported by the UKIRT observations by Speck et al. (1997), which are probably the pre-ISO carbon star spectra of the best quality so far. In these data, for continuum temperatures above 1000 K (e.g. of R For, IRC+50096, UU Aur, V Cyg) features dominate, which peak around 11.3 m with a nearly symmetric profile and a width of around 1.75 m. The profiles are not entirely symmetric, because there is an indication of a shoulder at about 11.8 m.
In contrast to this, most of our laboratory spectra show band maxima at relatively long wavelengths, e.g. the high-temperature products at 11.9 m and most pyrolysis products around 12.2 m. Whether the matrix effect could have transformed band profiles peaking originally at 11.3 m into the measured ones is still open, according to our infrared microscope measurements in Sect. 3.4 we rather doubt it. It is much more probable that morphological effects of the grains in the KBr pellets determine the measured laboratory profiles. However, up to now this has only been shown for a few samples with extreme geometries (whiskers), since at the moment the agglomeration state of the laboratory samples cannot be taken into account.
The only laboratory samples which show the phonon features at about the correct position (11.1-11.4 m) and with the correct width are those for which the bands are influenced by the phonon-plasmon coupling. To decide if the circumstellar SiC is of this type, there is in principle the possibility to search for an indication of the very broad absorption at adjacent wavelengths or for sharp minima limiting the phonon band region.
Whether such an identification will be possible in the future, depends also on the knowledge about other features of the astronomical spectra, especially those caused by a-C:H and molecular species. Their contributions have to be known for an exact determination of the base line of the SiC band. Another problem of the identification may be self-absorption, which has already been addressed by Speck et al. (1997) who used it for fitting their band profiles. Self-absorption may change the band profile drastically and produce relatively broad profiles with flat tops as well as maxima at longer wavelengths. This might also be another possible explanation for the peak shift to 11.9 m observed for the lower continuum temperatures, since cooler evelopes should have larger optical depths. Indeed, these observed features are relatively broad which may be difficult to explain with our data. However, they still are considerably narrower than the amorphous SiC feature we have measured (Sect. 4). Therefore, amorphous SiC can be ruled out as an analog of circumstellar SiC.
Another observational fact of importance might be the mentioned shoulder at about 11.8 m. If this is not due to a:C–H absorption, it could be indicative of larger grain sizes of a few micron (comp. Sect. 3.4). In this light, the whole observed feature shift might also reflect a growing grain size which would be understandable since lower continuum temperatures are correlated with higher mass-loss rates (Skinner & Whitmore (1988)). The observed weakening of the feature is also expected from a growth in grain size.
6 Conclusions
In our discussion of the optical properties of various SiC crystal types in Sect. 2 we have shown that the optical constants characterizing the phonon excitation by infrared radiation are too similar to cause significant spectral differences in small particle spectra. Nevertheless, in Sect. 3 we have presented spectra of considerable variety which is definitely not correlated to the polytype. Consequently, morphology and impurities of the material are the main factors determining the band profile, although there may still be indirect effects of the polytype, e.g. via the grain shape. This finding opens a wide field for future studies which are necessary for the understanding of the cosmic silicon carbide dust.
The points which have already been clarified or addressed in this paper are:
-
1.
The long-wavelength shoulder of the SiC bands measured by Friedemann et al. (1981) is a size effect.
-
2.
The short-wavelength shoulder seen in these spectra is not positioned at . It may be caused by a shape effect but this is unclear so far.
-
3.
Free charge carriers strongly influence the profile of the phonon band via coupling to the LO phonon.
-
4.
The free charge carriers themselves are a source of strong absorption in the mid-IR. They are very common among SiC powders. Probably, most of the free charge carriers are produced by impurities. At least one of the possible dopants is nitrogen which is also found in the presolar meteoritic SiC grains.
-
5.
The crystal structure (polytype) is not a strong factor for the band profile, at least not in the direct way via the dielectric function.
-
6.
The infrared band profile of amorphous SiC is too wide to fit the 11+ feature in circumstellar envelopes of carbon stars correctly.
Acknowledgements.
The authors would like to thank Gabriele Born and Walter Teuschel for help with the experiments and Dr. G. Boden, Fraunhofer-Institut Keramische Technologien und Sinterwerkstoffe Dresden, for providing us with part of the samples. We also thank the colleagues of the IFTO, Jena, for the permittance to reprint Fig. 1. H.M. is supported by a grant of the Max Planck Society to Th. H. This project was partly supported by DFG grant Mu 1164/3-1.References
- Amari et al. (1994) Amari S., Lewis R.S., Anders E. 1994, Geochim. Cosmochim. Acta 58, 459
- Andersen et al. (1998) Andersen A.C., Jäger C., Mutschke H., et al. 1998, A&A, in press
- Arnaud et al. (1996) Arnaud G., Alsina F., Pascual J., et al. 1996, Mater. Sci. Technol. 12, 108
- Baron et al. (1987) Baron Y., de Muizon M., Papoular R., Pégourié B. 1987, A&A 186, 271
- Basa & Smith (1990) Basa D.K., Smith F.W. 1990, Thin Solid Films 192, 121
- Bean & Newman (1971) Bean A.R., Newman R.C. 1971, J. Phys. Chem. Solids 32, 1211
- Bechstedt et al. (1997) Bechstedt F., Käckell P., Zywietz A., et al. 1997, phys. stat. sol. (b) 202, 35
- Bernatowicz et al. (1987) Bernatowicz T., Fraundorf G., Tang M., et al. 1987, Nat 330, 728
- Bernatowicz et al. (1996) Bernatowicz T.J., Cowsik R., Gibbons P.C., et al. 1996, ApJ 472, 760
- Bogdanov et al. (1982) Bogdanov V.B., Pikhtin A.N., Tsvetkov V.F., Yaskov A.D. 1982, Opt. & Spectrosc. 52(6), 1071
- Bohren & Huffman (1983) Bohren C.F., Huffman D.R. 1983, Absorption and Scattering of Light by Small Particles, John Wiley & Sons
- Borghesi et al. (1985) Borghesi A., Bussoletti E., Colangeli L., De Blasi C. 1985, A&A 153, 1
- Chen et al. (1994) Chen J., Levine Z.H., Wilkins J.W. 1994, Phys. Rev. B 50(16), 11514
- Chen et al. (1997) Chen W.M., Son N.T., Janzen E., Hofman D.M., Meyer B.K. 1997, phys. stat. sol. (a) 162 (5), 79
- Cherchneff (1997) Cherchneff I. 1997, Ap&SS 251, 333
- Choo et al. (1994) Choo A.C., Tlali Spirit, Jackson H.E., Li J.P., Steckl J. 1994, Mat. Res. Soc. Symp. Proc. 324, 267
- Choyke (1990) Choyke W.J. 1990, in R. Freer (ed.), The Physics and Chemistry of Carbides, Nitrides and Borides, pp 563–587, Kluwer Academic Publishers
- Clément (1996) Clément D. 1996, Master’s thesis, Universität Gesamthochschule Kassel
- Colwell & Klein (1972) Colwell P.J., Klein M.V. 1972, Phys. Rev. B 6(2), 498
- DiGregorio & Furtak (1993) DiGregorio J.F., Furtak T.E. 1993, J. Appl. Phys. 73 (12), 8506
- Dubrovskii & Radovanova (1971) Dubrovskii G.B., Radovanova E.I. 1971, phys. stat.sol. (b) B48, 875
- Dubrovskii & Radovanova (1973) Dubrovskii G.B., Radovanova E.I. 1973, Sov. Phys. Solid State 14(8), 2127
- Durupt et al. (1982) Durupt P., Canut B., Roger J.A., Pivot J., Gauthier J.P. 1982, Thin Solid Films 90, 353
- Engelbrecht & Helbig (1993) Engelbrecht F., Helbig R. 1993, Phys. Rev. B 48(21), 15698
- Engelbrecht & Helbig (1994) Engelbrecht F., Helbig R. 1994, Mat. Res. Soc. Symp. Proc. 339, 529
- Falkovsky et al. (1997) Falkovsky L.A., Bluet J.M., Camassel J. 1997, Phys. Rev. B 55(22), R14697
- Feitknecht (1971) Feitknecht J. 1971, Springer Tracts Mod. Phys.; Ed. Höhler, G. 58, 48
- Feldman et al. (1968a) Feldman D.W., J.H. Parker, W.J. Choyke(Jr.), Patrick L. 1968a, Phys. Rev. 170(3), 698
- Feldman et al. (1968b) Feldman D.W., Parker J.H., Choyke W.J., Patrick L. 1968b, Phys. Rev. 173(3), 787
- Feng et al. (1988) Feng Z.C., Mascarenhas A.J, Choyke W.J., Powell J.A. 1988, J. Appl. Phys. 64 (6), 3176
- Feng et al. (1996) Feng Z.C., Rohatgi A., Tin C.C., et al. 1996, J. Electron. Mater. 25 (5), 917
- Friedemann (1969a) Friedemann C. 1969a, Physica 41, 139
- Friedemann (1969b) Friedemann C. 1969b, Astron. Nachr. 291, 177
- Friedemann et al. (1981) Friedemann C., Gürtler J., Schmidt R., Dorschner J. 1981, Ap&SS 79, 405
- Gallino et al. (1994) Gallino R., Raiteri C., Busso M. 1994, ApJ 430, 858
- Gilman (1969) Gilman R.C. 1969, ApJ 155, L185
- Goebel et al. (1995) Goebel J.H., Chesseman P., Gerbaut F. 1995, ApJ 449, 246
- Gottfried et al. (1997) Gottfried K., Kriz J., Werninghaus T., et al. 1997, Mater. Sci. Engin. B 46, 171
- Hackwell (1972) Hackwell J.A. 1972, A&A 21, 239
- Harima et al. (1995) Harima H., Nakashima S.-I., Uemura T. 1995, J. Appl. Phys. 78(3), 1996
- Hobert et al. (1999) Hobert H., Dunken H.H., Peiter G., Diegel M., Stafast H. 1999, Appl. Phys. A, in press
- Hofmann et al. (1994) Hofmann M., Zywietz A., Karch K., Bechstedt F. 1994, Phys. Rev. B 50(18), 13401
- Holm et al. (1986) Holm R.T., Klein P.H., Nordquist (Jr.) P.E.R. 1986, J. Appl. Phys 60(4), 1479
- Hopfe et al. (1993) Hopfe V., Grählert W., Brennfleck K., Korte E.H., Theiß W. 1993, Fresenius J. Anal. Chem. 346, 99
- Hoppe et al. (1994) Hoppe P., Amari S., Zinner E., Ireland T., Lewis R.S. 1994, ApJ 430, 870
- Hron et al. (1998) Hron J., Loidl R., Höfner S., et al. 1998, A&A 335, L69
- Hu et al. (1996) Hu R., Tin C.C., Feng Z.C., Liu J., Vohra Y.K. 1996, Inst. Phys. Conf. Ser. 142, 345
- Il’in et al. (1972) Il’in M.A., Kukharskii A.A., Rashevskaya E.P., Subashiev V.K. 1972, Sov. Phys. Solid State 13(8), 2078
- Il’in & Rashevskaya (1973) Il’in M.A., Rashevskaya E.P. 1973, Sov. Phys. Semicond. 6(7), 1228
- Imai (1966) Imai A. 1966, J. Phys. Soc. Jpn. 21(2), 2610
- Käckell et al. (1994) Käckell P., Wenzien B., Bechstedt F. 1994, Phys. Rev. B 50(23), 17037
- Kimura et al. (1981) Kimura T., Kagiyama S., Yugo S. 1981, Thin Solid Films 81, 319
- Klein et al. (1972) Klein M.V., Ganguly B.N., Colwell P.J. 1972, Phys. Rev. B 6(6), 2380
- Koike & Shibai (1998) Koike C., Shibai H. 1998, The infrared spectra of candidate materials for celestial dust by laboratory measurements, Technical Report 671, The Institute of Space and Astronautlical Science, Kanagawa
- Kozasa et al. (1996) Kozasa T., Dorschner J., Henning Th., Stognienko R. 1996, A&A 307, 551
- Kreibig (1996) Kreibig U. 1996, in R. Hummel and P. Wissmann (eds.), Handbook of Optical Properties Vol.II: Optics of Small Particles, Interfaces and Surfaces, pp 145–190, CRS Press
- Kulakowskii et al. (1975) Kulakowskii V.D., Belov A.G., Egorov V.D., Il’in M.A., Rashevskaya E.P. 1975, Sov. Phys. Semicond. 9, 487
- Little-Marenin (1986) Little-Marenin I.R. 1986, ApJ 307, L15
- Liu & Vohra (1994) Liu J., Vohra Y.K. 1994, Phys. Rev. Letters 72(26), 4105
- Logothetidis & Petalas (1996) Logothetidis S., Petalas J. 1996, J. Appl. Phys. 80(3), 1768
- Lundquist et al. (1995) Lundquist P.M., Ong H.C., Chang R.P.H., Ketterson J.B., Wong G.K. 1995, Appl. Phys. Lett. 67(20), 2919
- Madelung (1982) Madelung O. (Ed.) 1982, Landolt-Börnstein, New Series, Group III, 22a (1986) Springer, Berlin 17a & 22 a, 132
- Mel’nichuk & Pasechnik (1992) Mel’nichuk A.V., Pasechnik Yu.A. 1992, Sov. Phys. Solid State 34(2), 227
- Mitra et al. (1969) Mitra S.S., Brafman O., Daniels W.B., Crawford R.K. 1969, Phys. Rev. 186(3), 942
- Moore et al. (1995) Moore W.J., Holm R.T., Yang M.J., Freitas Jr. J.A. 1995, J. Appl. Phys. 76(12), 7255
- Mukaida et al. (1987) Mukaida H., Okumura H., Lee J.H., et al. 1987, J. Appl. Phys. 62(1), 254
- Musumeci et al. (1997) Musumeci P., Reitano R., Calcagno L., et al. 1997, Phil. Mag. B 76(3), 323
- Nakashima & Harima (1997) Nakashima S., Harima H. 1997, phys. stat. sol. (a) 162(5), 39
- Nakashima et al. (1986) Nakashima S., Katahama H., Mitsuishi A. 1986, Phys. Rev. B 33(8), 5721
- Nakashima et al. (1987) Nakashima S., Wada A., Inoue Z. 1987, J. Phys. Soc. Jpn. 56, 3375
- Newman (1990) Newman R.C. 1990, in R.A. Stradley and P.C. Klipstein (eds.), Growth and characterization of semiconductors, pp 106–117, Adam Hilger, Bristol, New York
- Nienhaus et al. (1995) Nienhaus H., Kampen T.U., Mönch W. 1995, Surface Science 324, 1328
- Ninomiya & Adachi (1994) Ninomiya S., Adachi S. 1994, Jpn. J. Appl. Phys. 33, 2479
- Okumura et al. (1987) Okumura H., Sakuma E., Lee, L.H. Mukaida S., et al. 1987, J. Appl. Phys. 61(3), 1134
- Olego & Cardona (1982a) Olego D., Cardona M. 1982a, Phys. Rev. B 25(2), 1151
- Olego & Cardona (1982b) Olego D., Cardona M. 1982b, Phys. Rev. B 25(6), 3889
- Ossenkopf et al. (1992) Ossenkopf V., Henning Th., Mathis J. S. 1992, A&A 261, 567
- Papoular et al. (1998) Papoular R., Cauchetier M., Begin S., Le Caer G. 1998, A&A 329, 1035
- Patrick (1968) Patrick L. 1968, Phys. Rev. 167(3), 809
- Patrick & Choyke (1961) Patrick L., Choyke W.J. 1961, Phys. Rev. 123(8), 813
- Pensl & Helbig (1990) Pensl G., Helbig R. 1990, Festkörperprobleme 30, 133
- Perez-Rodriguez et al. (1996) Perez-Rodriguez A., Pacaud Y., Calvo-Barrio L., et al. 1996, J. Electron. Mater. 25(3), 541
- Pfennighaus et al. (1997) Pfennighaus K., Fissel A., Oehme M., et al. 1997, in Frühjahrstagung der Deutschen Physikalischen Gesellschaft, Münster 17.3. - 21.3.
- Pikhtin et al. (1977) Pikhtin A.H., Prokopenko W.T., Yaskov 1977, Opt. & Spektrosk. 43(4), 711
- Powell (1972) Powell J.A. 1972, J. Opt. Soc. Am. 62(3), 341
- Pultz & Hertl (1966) Pultz W.W., Hertl W. 1966, Spectrochim. Acta 22, 573
- Purtseladze & Khavtasi (1972) Purtseladze I.M., Khavtasi L.G. 1972, Sov. Phys. Semicond. 5(10), 1628
- Ramsdell (1947) Ramsdell L.S. 1947, Am. Mineral. 32, 64
- Rieder et al. (1972) Rieder K.H., Ishigame M., Genzel L. 1972, Phys. Rev. B 6(10), 3804
- Salvador & Sherman (1991) Salvador G., Sherman W.F. 1991, J. Molec. Struct. 247, 373
- Sandford (1996) Sandford S.A. 1996, Meteoritics & Planetary Science 31, 449
- Sasaki et al. (1989) Sasaki Y., Nishina Y., Sato M., Okamura K. 1989, Phys. Rev. B 40(3), 1762
- Sciacca et al. (1995) Sciacca D. M., Mayur A.J., Oh E., et al. 1995, Phys. Rev. B 51(12), 7744
- Serre et al. (1996) Serre C., Calvo-Barrio L., Perez-Rodriguez A., et al. 1996, J. Appl. Phys. 79(9), 6907
- Shaffer (1971) Shaffer P.T.B. 1971, Appl. Opt. 10(5), 1034
- Shaffer & Naum (1969) Shaffer P.T.B., Naum R.G. 1969, J. Opt. Soc. Am. 59, 1498
- Skinner & Whitmore (1988) Skinner C.J., Whitmore B. 1988, MNRAS 234, 79p
- Speck et al. (1997) Speck, A. K., Barlow, M. J., Skinner C. J. 1997, MNRAS 288, 431
- Spitzer et al. (1959a) Spitzer W.G., Kleinman D.A., C.J. Frosch 1959a, Phys. Rev. 113(1), 133
- Spitzer et al. (1959b) Spitzer W.G., Kleinman D., Walsh D. 1959b, Phys. Rev. 113(1), 127
- Steckl et al. (1996) Steckl A.J., Devrajan J., Tlali S., et al. 1996, Appl. Phys. Lett. 69(25), 3824
- Stephens (1980) Stephens, J. R. 1980, ApJ 237, 450
- Treffers & Cohen (1974) Treffers R., Cohen M. 1974, ApJ 188, 545
- Willacy & Cherchneff (1998) Willacy K., Cherchneff I. 1998, A&A 330, 676
- Yajima et al. (1976) Yajima S., Omori M., Hayashi J., et al. 1976, Chemistry Letters pp 551–554
- Yamamoto et al. (1985) Yamamoto K., Kimura K., Ueda M., Kasahara H., Okada T. 1985, J. Phys. C: Solid State Phys. 18, 2361
- Yamanaka et al. (1994) Yamanaka M., Ikoma K., Ohtsuka M., Ishizawa T., Shichi Y. 1994, Jpn. J. Appl. Phys. [1] 33(2), 997
- Yoo & Matsunami (1991) Yoo W. S., Matsunami H. 1991, J. Appl. Phys. 70(11), 7124
- Yoshii et al. (1991) Yoshii K., Suzaki Y., Takeuchi A., Yasutake K., Kawabe H. 1991, Thin Solid Films 199, 85
- Yugami et al. (1987) Yugami H., Nakashima S., Mitsuishi A., et al. 1987, J. Appl. Phys. 61(1), 354
- Zorba et al. (1995) Zorba T., Siapkas D.I., Hatsidis C.C. 1995, Microelectron. Eng. 28, 229
- Zorba et al. (1996) Zorba T.T., Mitsas C.L., Siapkas I.D., Terzakis G.Z., Siapkas D.I. 1996, Appl. Surf. Sci. 102, 120