Kinematics, Abundances, and Origin of Brightest Cluster Galaxies
Abstract
We present kinematic parameters and absorption line strengths for three brightest cluster galaxies, NGC 6166, NGC 6173 and NGC 6086. We find that NGC 6166 has a velocity dispersion profile which rises beyond 20 arcsec from the nucleus, with a halo velocity dispersion in excess of 400 km s-1. All three galaxies show a positive and constant Hermite moment. The rising velocity dispersion profile in NGC 6166 thus indicates an increasing mass-to-light ratio. Rotation is low in all three galaxies, and NGC 6173 and NGC 6086 show possible kinematically decoupled cores. All three galaxies have Mg2 gradients similar to those found in normal bright ellipticals, which are not steep enough to support simple dissipative collapse models, but these could be accompanied by dissipationless mergers which would tend to dilute the abundance gradients. The [Mg/Fe] ratios in NGC 6166 and NGC 6086 are higher than that in NGC 6173, and if NGC 6173 is typical of normal bright ellipticals, this suggests that cDs cannot form from late mergers of normal galaxies.
keywords:
Galaxies: normal – galaxies: elliptical and lenticular, cD1 Introduction
Brightest cluster galaxies (BCGs) are luminous ellipticals found near the centres of galaxy clusters and groups. They are further subdivided into giant ellipticals (gE), D galaxies which have shallower surface brightness profiles than gEs, and finally cD galaxies which have extended low surface brightness envelopes (Mathews, Morgan & Schmidt 1964; Schombert 1987, 1988). BCGs are often associated with powerful radio sources (Mathews et al. 1964), and extended cluster X-ray emission (Jones et al. 1979). In regular clusters, BCGs are invariably at the centre of the cluster potential, as defined by the cluster X-ray emission, galaxy distributions, and strong/weak gravitational lensing (e.g. Miralda-Escude 1995), and their velocities are usually close to the mean cluster velocity. BCGs are often observed to have extremely high globular cluster specific frequencies (e.g. Harris, Pritchet, & McClure 1995; Bridges et al. 1996).
The origin of BCG halos is one of the most puzzling aspects of galaxy formation, and it is unclear whether they are formed at the same time as the galaxy proper, as proposed by Merritt (1984), or are accreted later. If accreted later they might form via dissipational processes, such as star formation in cooling flows (Fabian & Nulsen 1977), or by purely stellar dynamical processes, such as galactic cannibalism (Hausman & Ostriker 1978; McGlynn & Ostriker 1980), accretion of tidally stripped material (Richstone 1976) or “Galaxy Harassment” (Moore et al. 1996). For a review of BCG formation, see Tremaine (1990); see also Garijo, Athanassoula, & Garcia-Gomez (1997), and Dubinski (1998).
The kinematics and metallicities of BCG halos provide important clues as to how they form. If they form in a dissipational process, then we might expect a low velocity dispersion, as the energy of the material from which the stars form has been radiated away. If BCGs form in a dissipative collapse, we would expect to see metallicity gradients in the halo (though metallicity gradients are not unique to dissipative formation models). If the halos form out of material from other cluster galaxies via dissipationless processes, then we might expect the halos to reflect the kinematics of the cluster as a whole, with high velocity dispersion and little net rotation; metallicity gradients would be shallower if BCGs experience significantly more mergers than other cluster galaxies, since mergers are expected to weaken metallicity gradients. If the halos are primordial, and formed in a process involving violent relaxation, then the kinematics will reflect the underlying mass distribution.
While there is considerable information on the central kinematics of ellipticals, there have been few studies of the halo kinematics at very large radii from optical spectroscopy. Most such studies have concentrated on normal ellipticals, and have found that the velocity dispersion profiles are either flat or decreasing with radius (e.g. Saglia et al. 1993; Carollo et al. 1995; Statler, Smecker-Hane, & Cecil 1996). Similar results have been found in the even fewer studies of BCGs (e.g. Carter et al. 1981, 1985; Tonry 1984, 1985; Heckman et al. 1985; Fisher, Illingworth, & Franx 1995). To date, one cD (IC 1101 in Abell 2029: Dressler 1979; Fisher et al. 1995; Sembach & Tonry 1996), and two dumbell galaxies (Abell 3266: Carter et al. 1985, and IC 2082: Carter et al. 1981), have been found to have rising dispersion profiles.
An alternative approach to the study of the kinematics of the outer halos of cD and other galaxies is the use of globular clusters and planetary nebulae as tracers. Because of the geometric constraints of current multi-slit and fibre fed spectrographs, this technique can be used only in the outer halos, and because of magnitude limits cannot be applied at distances beyond two or three times the distance of the Virgo cluster. Nevertheless for M87 (Mould et al. 1990; Cohen & Ryzhov 1997) and NGC 1399 (Grillmair et al. 1994; Kissler-Patig et al. 1998; Minniti et al. 1998), globular cluster velocities have shown conclusively that the M/L ratio increases outwards in the halo, and thus that there are substantial dark matter halos in both galaxies. Arnaboldi et al. (1994) confirm this result for NGC 1399 for a sample of planetary nebulae. Interestingly, Cohen & Ryzhov (1997) find that the globular cluster velocity dispersion in M87 rises outwards, and in NGC 1399 the velocity dispersions of the planetary nebulae and globular clusters match smoothly onto the velocity dispersion of the Fornax cluster itself. These BCGs at least seem to merge smoothly into their host clusters, and the BCG and cluster dynamics seem closely linked (see discussion in Freeman 1997). The evidence from the distribution of lensed arcs in more distant clusters points to the dark matter being more centrally concentrated than the X-ray gas (Miralda-Escude & Babul 1995). In this case the dark matter will affect the dynamics of the cD halo significantly.
We have embarked on a program to obtain very deep optical spectroscopy of BCGs. Here we present long-slit spectra for NGC 6166, NGC 6173, and NGC 6086, obtained at the 2.5m INT in La Palma in May 1996. The properties of these galaxies and their host clusters are listed in Table 1. NGC 6166 is a luminous cD and a classic multiple-nucleus galaxy (though the ‘nuclei’ are probably not bound to NGC 6166), centrally located in a rich cluster with a large cooling flow ( 160 M⊙/yr: Allen & Fabian 1997), and a regular, symmetrical X-ray appearance (Buote & Canizares 1996). Abell 2197 is 1.3 degrees north of Abell 2199 (Gregory & Thompson 1984), and is a sparser cluster with an irregular X-ray morphology dominated by two main concentrations (Muriel, Bohringer, & Voges 1996). NGC 6173 is a D galaxy found at the centre of one of these concentrations (subclusters), and appears to have a significant peculiar velocity (i.e. relative to the cluster mean velocity). Abell 2162 is probably best described as a poor cluster or compact group; we have not been able to find any X-ray data for this cluster. However, NGC 6086 is classified as a cD galaxy based on its surface brightness profile, and does not have a peculiar velocity. Thus, our three galaxies/clusters span a wide range of properties.
| Galaxy/Cluster | Galaxy | M | Vgal | Vcluster | BM | R | X-ray | ||
|---|---|---|---|---|---|---|---|---|---|
| Type | (km s-1) | (km s-1) | |||||||
| Our | Sample | ||||||||
| N6166/A2199 | cD | 22.7 | 326 | 9293 | 9063 | 823 | I | 2 | CF, Reg |
| N6173/A2197 | gE | 22.4 | 261 | 8800 | 9134 | 550 | III | 1 | Irr |
| N6086/A2162 | cD | 21.8 | 304 | 9547 | 9795 | 302 | II-III | 0 | ? |
| IC 1101/A2029 | D | 23.5 | 359 | 23399 | 23169 | 1436 | I | 2 | CF, Reg |
| Sersic 40-6/A3266 | cD | 327 | 17914 | 17802 | 1186 | I-II | 2 | CF, Reg | |
| IC2082/AS0463 | D | 265 | 12051 | 12035 | 844 | I-II | 0 | ? |
NGC 6166 has previously been observed spectroscopically by Tonry (1985) and Fisher et al. (1995) with 2 and 3 position angles respectively (each include the major axis). Unfortunately, both studies only extend to 1020 arcsec from the galaxy centre, and over this limited range both find a flat or slightly decreasing velocity dispersion profile (we show below that this is consistent with our data, which extend much further out). Fisher et al. find that NGC 6166 does not have significant rotation along either the major or minor axes out to 20 arcsec radius. We have only been able to find central velocity dispersions and line strengths for the other two galaxies (e.g. Burstein et al. 1987; McElroy 1995).
2 Observations and Data Reduction
Table 2 contains details of the observations. Spectra are in each case taken with the slit aligned with the major axis to maximise the signal to noise ratio. The spectra include the Mg and Fe absorption lines, as well as [OIII] and [NI] emission lines (for NGC 6166 only). We also obtained template spectra of 28 stars, with spectral type ranging from G6 to M1, and luminosity class III, IV and V.
Figure 1 shows the central spectra for each of the three galaxies; for each spectrum, the best-fitting stellar template is also shown (see below), as well as the bandpass definitions for Mg2, Fe5270, and Fe5335. Preliminary data reduction was done using standard FIGARO routines, and followed the procedures of Carter, Thomson and Hau (1998). This involves debiassing, flatfielding and wavelength calibrating the data. A slope in the spectrum due to detector rotation was corrected using the S-distortion correction routines in FIGARO. The template spectra were re-binned to zero velocity, using their published radial velocities, mainly from Wilson (1953).
| Telescope | Isaac Newton Telescope (2.5 m) |
| Instrument | Intermediate Dispersion Spectrograph |
| Observing dates | 10–16/06/1996 |
| Camera | 235mm |
| Grating | R1200Y |
| Dispersion | 35 Å/mm |
| Detector | Tektronix 1024 CCD |
| Resolution | 2 Å |
| Spectral Coverage | 4930–5730 Å |
| Slit Width | 3.0 arcsec |
| Average Seeing | 1.3 arcsec |
| Slit PA | 41/140/0 deg1 |
| Exposure Time | 18.75/6.25/6.33 hrs1 |
1 For NGC 6166/6173/6086 respectively.

Following van der Marel & Franx (1993), the line-of-sight velocity distributions (LOSVDs) are modelled as Gaussians with small Hermite deviations, parameterised as mean velocity , dispersion , and hermite moments of order . The parameters are recovered by the program kinematics written by H-W. Rix; for more details please see van der Marel & Franx (1993), Rix & White (1992), and Hau, Carter, & Balcells (1998). The Gauss-Hermite moments and are closely related to the skewness and kurtosis of the LOSVD respectively, and are therefore easy to visualise. Large with opposite sign to the mean velocity is typical of rapidly-rotating systems, whilst for spherical two-integral models, is proportional to the velocity dispersion anisotropy (van der Marel & Franx 1993). The higher moments are more difficult to interpret. However, they are useful for identifying structures in the residuals of the model fit to the data. We measure and plot Gauss-Hermite parameters up to .
The observed wavelength range is well known to give template mismatch problems (van der Marel & Franx 1993). In order to minimize template mismatch, an optimal stellar template is employed for the direct fitting. This is estimated as the best linear combination of the 28 template spectra which when broadened with a Gaussian profile minimizes , the difference between the combination and the galaxy spectrum, after an initial guess of the velocity for each template and the dispersion, (Rix & White 1992). This optimal template is then used for recovering the LOSVD for the galaxy spectrum, modelled up to . This procedure is done for each of the individual spectra in each galaxy, thus reducing radial template mismatch due to abundance gradients. The galaxy nucleus is located by a Gaussian fit to the light profile of the central few pixels. Monte Carlo experiments show that 2500 counts/pixel or higher gives satisfactory results for the direct fitting (see Appendix A).
Our procedure allows the determination of an individual optimal composite template for each data point, To ensure that this procedure does not introduce systematic effects into our profiles we repeated the analysis for NGC 6166 using the composite template for the central spectrum for all data points. There are no systematic differences in zeropoint or overall trend in any of the kinematic values derived. Subjectively, we estimate that the scatter is higher, justifying our decision to use individually determined optimal templates.
Emission lines could affect the measurement of absorption-line indices if they fall within one of the bandpasses, and also can potentially introduce systematics in the absorption line profile analysis. Significant [OIII] and [NI] emission are observed in the nuclear region arcsecof NGC 6166, but not in NGC 6173 or NGC 6086. Thus, for NGC 6166, pixels within a wavelength difference corresponding to 3 from an emission line are excluded from the line-profile fitting. These regions are: – ([OIII]), – ([NI]), and – (strong sky line). Experimentation shows that excluding a few pixels has a negligible effect on the recovery of the LOSVD as kinematics are measured over the entire spectrum. For spectra more than 11 arcsec from the nucleus where no emission is present, only the region affected by the strong sky line is excluded, allowing fitting over the entire spectrum. Another difficulty with NGC 6166 is the presence of companion nucleus B, which is at a PA of 62∘with respect to the central cD, and contributes significantly to the light in our slit between 520 arcsec from the galaxy centre along the NE side. Kinematics was not designed to recover two LOSVDs, so we restrict our analysis to the SW side of the galaxy.
The parameters recovered by the Gauss-Hermite analysis are presented in Figures 2(a), (b), and (c), for NGC 6166, NGC 6173, and NGC 6086 respectively.


3 Stellar Kinematics
3.1 Velocity Dispersions
Central Velocity Dispersions
We can compare our central velocity dispersions, = 320 5, 295 5, and 325 8 km s-1 for NGC 6166, 6173, and 6086 respectively, with previous determinations. NGC 6166 has been the best-studied of the three: Malumuth & Kirshner (1981), Tonry (1985), Burstein et al. (1987), and Fisher et al. (1995), find = 350 35, 303, 326, and 295 6 km s-1 respectively. For NGC 6173, Burstein et al. (1987) and McElroy (1995) find = 261 and 240 km s-1 respectively, both values lower than ours. For NGC 6086, Burstein et al. (1987) and McElroy (1995) find = 304 and 325 km s-1 respectively. Overall, the agreement is good, and the present data are of much higher quality than any previous data.
Velocity Dispersion Profiles
From Figures 2(b) and (c), we see that both NGC 6173 and NGC 6086 have velocity dispersion profiles that decline outwards. Such behavior is found in most normal ellipticals. In contrast, Figure 2(a) shows that the velocity dispersion profile of NGC 6166 increases from 325 km s-1 at the centre to 450 km s-1 at 35 arcsec along the major axis. Tonry (1985) and Fisher et al. (1995) both have limited dispersion profiles for NGC 6166, and find a flat and slightly decreasing dispersion profile respectively, out to 20 arcsec along the major axis. This is consistent with what we find, since our dispersion only starts rising significantly beyond 20 arcsec.
In Appendix A we analyse possible systematic errors introduced into the kinematic parameters by noise and imperfect sky subtraction. We find that there is a bias towards low velocity dispersion when the signal-to-noise is poor, but this does not significantly affect the points plotted in Figure 2(a-c).
3.2 Rotation
From Figure 2(a), NGC 6166 shows modest major-axis rotation, and a weighted least-squares fit yields a slope of 1.07 0.12 km s-1 arcsec-1, or a rotation of 45 km s-1 at 40 arcsec. Tonry (1985) found a rotation amounting to 4 km s-1 arcsec-1 at PAs of 62∘and 102∘, while Fisher et al (1995) find no significant rotation at PAs of 31∘, 35∘and 125∘.
NGC 6173 and NGC 6086 both show evidence of rotation in the core, decoupled from the kinematic properties further out. In NGC 6173 (Figure 2(b)), a linear least-squares fit gives a velocity gradient of 2.56 0.27 km s-1 arcsec-1 for arcsec, with no significant rotation outside this, and in NGC 6086 (Figure 2(c)), similar fits give a velocity gradient of 0.86 0.48 km s-1 arcsec-1 for arcsec and 1.33 0.13 km s-1 arcsec-1 for arcsec. Although the core rotation is only marginally significant, it does appear to be counter-rotating. NGC 6173 is a shell galaxy, and both the shells and higher core rotation could be a result of a merger or interaction. However, in both galaxies, there is no significant asymmetry in the line profiles (i.e. changes in ) associated with the peculiar kinematics, as expected from classical KDCs like IC 1459 or NGC 2865 (Hau, Carter, & Balcells 1998). Also, Statler (1991) proposes that KDCs might also arise from streaming in a triaxial potential, without a merger/interaction.
3.3
The parameter measures symmetric deviations from a Gaussian profile and is related to the velocity anisotropy. is significantly positive, with no radial dependence, in all of our galaxies. Although it is not straightforward to translate to the velocity anisotropy parameter (), positive values, at least outside the nucleus, generally indicate a bias towards radial orbits (Gerhard 1993; Gerhard et al. 1998, Rix et al. 1997). The most important result from the line-profile analysis is that there is no change in associated with the rising dispersion in NGC 6166, indicating that the increase in velocity dispersion is not associated with a change in velocity anisotropy towards tangential orbits.
has a magitude of 0.10, 0.05 & 0.05 in NGC 6166, 6173 & 6086 respectively. Template mismatch can introduce systematics in by either increasing or decreasing its magnitude; see, for example, van der Marel et al. (1994), and Hau, Carter, & Balcells (1998). The fits in NGC 6173 & NGC 6086 appear to be near perfect. Inspection of the residuals for NGC 6166 shows that the fits are less perfect than for the other two galaxies, but are satisfactory. We feel that template mismatch is not a major problem for all three galaxies as the optimal template is estimated from 28 template stars.
In order to estimate the effect of template mismatch on the absolute value of (and other kinematic parameters), in Appendix A we derive the kinematic parameters for NGC 6166 for a range of individual templates. None of these templates fit the galaxy data as well as the optimal template. Given an extreme range of templates, we find zero point differences of up to 0.1 in , and ; 0.2 in , and 50 km/s in velocity dispersion. However these differences are largely in the zero points for stars at the extreme end of the range of spectral types of the observed templates (G6 III and M1 III). In particular low is found only when an M1 III template is used, this template does not fit the data well and contributes little to the optimal composite templates. Although template mismatch may in principle shift the zero-point in , it cannot explain the significantly positive seen in our data.
In Appendix A we also analyse the effect of noise on the recovery of when the magnitude of the real value of is large. We find that there are no systematic biases unless , when is systematically underestimated at low signal to noise. Thus the only possible bias in our results would be to underestimate in the outer regions of NGC 6166, although there is no evidence that this has happened, we cannot absolutely rule it out.
Van der Marel & Franx (1993) give formulae which relate to , but they are model-dependent. To better quantify the anisotropy parameter , we need to solve for the ratio using all of the available kinematic and photometric data. Such techniques have been developed by Rix et al. (1997), using Schwarzchild’s method of populating orbits, and by Dehnen (1995) for the axisymmetric case in order to model M32.
In summary, the rising velocity dispersion profile in NGC 6166 is not due to a change in velocity anisotropy, but rather, reflects an increasing ratio. This indicates that NGC 6166 possesses a massive dark halo.
4 Gas kinematics in NGC 6166
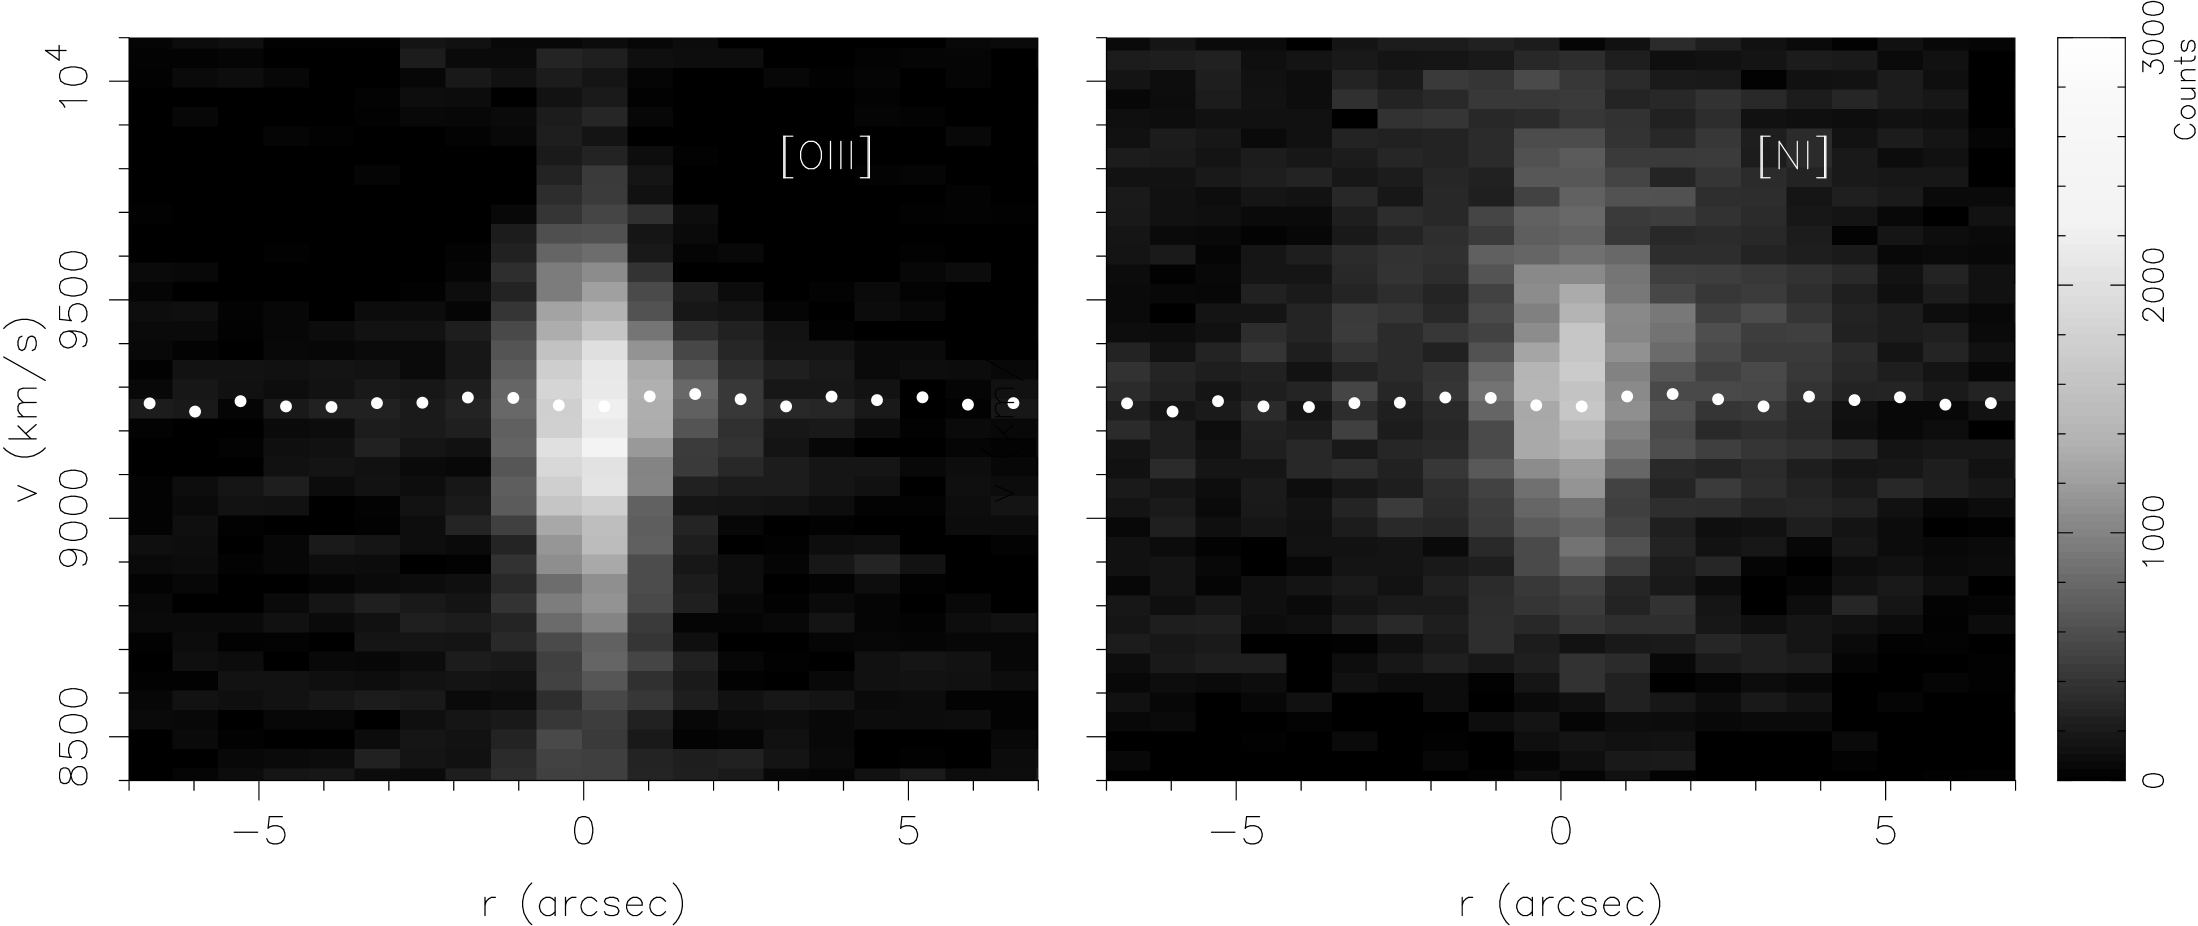
Significant [OIII] and [NI] emission is observed in the centre of NGC 6166. In this section we present the line-of-sight velocity distribution of the ionized gas inferred by the profile of the [OIII] and [NI] emission lines, obtained directly from the residual map of the Gauss-Hermite analysis, described in the previous section. This method is very successful and is more objective than fitting the baseline by hand. The results are plotted in Figure 3, with the stellar rotation curve from Figure 2(a) over-plotted. We see that the [OIII] and [NI] emission is very concentrated to the galaxy centre, with spatial FWHM of 1.9 and 3.0 arcsec respectively. The spatial FWHM of template stars is about 2.3 arcsec, thus the [OIII] emission region is unresolved but that of the [NI] may be marginally resolved. At the galaxy centre, the [OIII] and [NI] have velocity dispersions of and km s-1 respectively, which is very similar to the central stellar velocity dispersion (Figure 2a).
5 Stellar Absorption Line Abundances
5.1 Introduction
In this section the absorption line indices are presented for the three galaxies. Mg2, Fe5270, and Fe5335 are extracted from individual, de-redshifted spectra following the definitions and recipes of Faber et al. (1985), and adopting the passband definitions of Worthey et al. (1994); see Appendix B for more details. We first discuss the local MgFe relations for each galaxy, then present the Mg2 radial profiles. We discuss the significance of these results in our Conclusions.
As discussed in Appendix B, there is some uncertainty regarding the zero-point of our measured indices in the Lick/IDS scale, due to the fact that only one star with Lick indices (HR 5227) has been observed, and also that the grating settings for the galaxy and the template star observations were different. However recent observations by Trager et al. (1998) for the nucleii of NGC 6166 and NGC 6086 do agree within their admittedly rather large error bars. We also find that our Mg2 measurements agree well with those measured by Cardiel et al. (1997), if both are not zero-point corrected (Figure 5). As most of our discussion is not based on the absolute values of the indices, throughout this Section we present line indices without zero-point corrections.
5.2 Local Fe Versus Mg2
In Figure 4, we plot Fe [ (Fe5270 + Fe5335)/2)] against Mg2 for the three galaxies. All three galaxies appear to have [Mg/Fe] ratios higher than the model values with solar [Mg/Fe] abundance, but there are uncertainties in our zero-points. Notice further from Figure 4 that NGC 6086 and NGC 6166 are more ‘enhanced’ than NGC 6173. This is interesting, given that the first two galaxies are centrally-located cDs, while NGC 6173 is best described as a gE in a subcluster in Abell 2197. Similarly, M87 is offset from the non-BCGs in the data of Davies, Sadler, & Peletier.
Hau (1998) has pointed out that in galaxies of high velocity dispersion, a positive value of , such as might result from radial anisotropy, leads to more absorption being lost from the passband that the Fe indices are measured from, and thus to an artificially high value of [Mg/Fe]. This systematic error might account for as much as a third of the offset between NGC 6166 and NGC 6173. However we still find that our galaxies with cD morphology have higher [Mg/Fe] compared with NGC 6173, which is the only normal bright elliptical in our sample. If further observations confirm that NGC 6173 is typical (despite uncertainty in the relative zero-points, the data of Davies et al. (1993) support this), then there is a difference between cDs and normal bright ellipticals. Bender (1996) uses the offset of [Mg/Fe] to higher values in ellipticals when compared with spirals as an argument against the idea that ellipticals form from the mergers of objects similar to present-day spirals; any such argument is clearly stronger for cDs. Bender (1996) and Davies (1996) feel that the most plausible explanation for the non-solar [Mg/Fe] ratios in ellipticals is a short burst of star formation, 12 Gyr. This would produce a population enriched in Mg from rapid Type II supernovae from massive stars, while few stars would be formed from Fe-enriched gas formed in longer-lived Type Ia supernovae. See Section 6 for further discussion on these topics.

5.3 Mg2 Abundance Gradients
We first compare our Mg2 profile for NGC 6166 with that of Cardiel et al. (1997) in Figure 5. We have only plotted the SW side of the major axis because of contamination from the secondary nucleus on the NE side. Neither set of data has had any zeropoint corrections applied (see Appendix B). Out to 15 arcsec, the agreement is very good. Beyond 15 arcsec, our Mg2 is significantly higher than that of Cardiel et al. The source of this discrepancy is unclear, however our signal-to-noise is higher than that of Cardiel et al. Their three outermost points have Mg2 values 0.2, lower than any of the ellipticals studied by Davies et al. (1993). These extreme values seem unlikely, and we are confident of the reliability of our Mg2 profiles.
The sensitivity of our line strength measurements to sky subtraction errors needs to be considered. The sky spectrum that we subtract is averaged over many spatial pixels and is relatively low noise. The only feature in the sky spectrum are the night sky emission line at 5577Å and (much weaker) 5199Å, apart from this the sky is well represented by a constant continuum. At these redshifts the [NI] line at 5199Å does not fall in the Mg2 band or its continuum bands, and so can be neglected. Therefore the sky in the region of all of the line and continuum bandpasses can be represented by a constant, and the error in this constant can be determined from the maximum residuals seen in the [OI] line at 5577Å in the sky subtracted spectra, and the ratio of the peak intensity in this line to the continuum in the sky spectra.
Inspection of the sky line residuals in the outer regions of our profile show that sky subtraction errors do not exceed 1% of the signal level, thus systematic errors in our Mg2 values will not exceed 0.01 mag.

In Figure 6, we present the major axis profiles of Mg2, for NGC 6166, 6173, and 6086. Outside 3–5 arcsec, the Mg2 profiles are well-fit by power-laws of slope (d(Mg2)/d(log )) 0.080, 0.059, and 0.073 for NGC 6166, 6086 and 6173 respectively (inside 3 arcsec, seeing effects are likely to be important; the flattening of Mg2 in NGC 6166 within a larger radius of 5 arcsec may be due to star formation inside the emission-line region in this galaxy). These slopes are fairly similar to each other, and are also similar to the average Mg2 slope of 0.058 found by Cardiel et al. (1997) for eight BCGs without cooling flows or optical emission lines. Gorgas, Efstathiou, & Aragon-Salamanca (1990) also measured shallower gradients for two BCGs (0.051 and 0.021 for the cDs in 0559-40 and PKS 2354-35). However, examination of their Figure 9 shows that these gradients are based on only three points, and the outermost point in each case has large uncertainty.
Cardiel et al. (1997) find that the Mg2 slopes are shallower in BCGs with optical line-emission, inside the emission-line region; our data for NGC 6166 are consistent with this. Cardiel et al. attribute this flattening to star formation from cooling flow gas near the galaxy centre. This makes comparison of BCG Mg2 data difficult, unless one is careful to compare slopes outside emission-line regions in all cases.
We can also compare our Mg2 slopes with those of non-BCG ellipticals. Couture & Hardy (1988) found a mean Mg2 gradient of 0.053 0.015 for six early-type galaxies; Davies, Sadler, & Peletier (1993) find a mean slope of 0.059 0.022 for 13 normal ellipticals; Gorgas et al. (1990) obtain a mean slope of 0.058 0.027 for 16 ellipticals; Davidge (1992) found a steeper gradient of 0.081 0.01 for 11 ellipticals. Gonzalez & Gorgas (1998; see also Gonzalez & Gorgas 1997) find a mean Mg2 gradient of 0.055 0.025 for 109 early-type galaxies. Thus, our three BCGs have slopes consistent with those found in non-BCG ellipticals. It seems likely that these BCGs have not experienced significantly more mergers than normal ellipticals, as mergers are expected to dilute abundance gradients (White 1980).
6 Conclusions
Our main results are:
(1): We find small rotation along the major axes of NGC 6166, NGC 6173, and N6086, with Vrot 50 km s-1 at the outermost observed major axis radii (30–40 arcsec) in the three galaxies; the corresponding V/ ranges from 0.02–0.18. This small rotation is consistent with the nearly complete lack of rotation found near the centres of a sample of 13 BCGs by Fisher et al. (1995). This is consistent with merger models of BCG formation, but data at larger radii are urgently needed, since numerical simulations predict that mergers should contain significant amounts of angular momentum beyond 23 re (e.g. Hernquist 1993).
NGC 6173 and NGC 6086 have larger velocity gradients near the galaxy centres, and NGC 6086 appears to have a counter-rotating core. These cores may arise from a previous merger/interaction (supported by the shells seen in NGC 6173), or may be due to streaming in a triaxial potential; further observations at other position angles will be needed to decide between these two alternatives (Statler 1991).
(2): NGC 6086 and NGC 6173 have slowly declining velocity dispersion profiles. In contrast, NGC 6166 has a rising velocity dispersion: increases from 325 km s-1 at the centre to 440 km s-1 at 35arcsec.
(3): The Gauss-Hermite moment is positive and roughly constant at 0.05 at all radii along the major axis of NGC 6173 and NGC 6086, and 0.1 along the major axis of NGC 6166. Template mismatch is unlikely to account for all of this offset, and we conclude that there is possibly radial anisotropy present. We will confirm and quantify this suggestion with detailed modelling in a later paper.
(4): We find [OIII] and [NI] emission concentrated within 5 arcseconds (3h-1 kpc) of the centre of NGC 6166, with a central velocity dispersion of 350 km s-1, similar to the central stellar velocity dispersion. The extent of the [OIII] emission region is unresolved, but that of the [NI] may be marginally resolved.
(5): We find that [Mg/Fe] is larger in NGC 6166 and NGC 6086 than in NGC 6173. Although positive can lead to systematic errors in [Mg/Fe], the magnitude of the offset appears too large to be explained by such an error. The difference in [Mg/Fe] between galaxies with cD morphology and normal bright ellipticals, if confirmed by further observations, would present a difficulty for models in which the cDs were formed from mergers of normal galaxies of any type.
(6): The Mg2 gradients outside 3–5 arcsec range from 0.06 to 0.08 for the three galaxies. These slopes are consistent with those found for BCGs without cooling flows or emission lines by Cardiel et al. (1997), and for non-BCG ellipticals. More data are needed to definitively compare BCGs with non-BCG ellipticals in this regard.
We defer to a forthcoming paper a detailed dynamical modelling of these three galaxies, but we note that (2) and (3) together imply that the M/L ratio increases outwards in the NGC 6166 halo, and likely in the other two galaxies as well. Further support for a DM halo in NGC 6166 comes from X-ray data, e.g. Buote & Canizares (1996).
Do these results favour one BCG formation model over others? There are five main scenarios for BCG formation: (i) Deposition of cooling flow gas from the ICM (e.g. Fabian 1994); (ii) Cannibalism of other cluster galaxies (Ostriker & Tremaine 1975); (iii) Tidal stripping of other cluster galaxies, either by the cluster tidal field or by the BCG itself (Richstone 1976; Moore et al. 1996); (iv) Earlier origin in smaller groups/subclusters, which later merged to form the present-day cluster (Merritt 1984, 1985; Tremaine 1990); and (v) Dissipative collapse models (Larson 1975; Carlberg 1984a,b). These scenarios are not necessarily mutually exclusive; for instance, many authors have suggested that mergers/cannibalism create the central body of the cD, while tidal stripping accounts for their extended halos.
Dubinski (1998) has run an impressive simulation of cD formation, using a large cosmological N-body simulation of cluster collapse with hierarchical merging. His ‘cluster’ has a mass of 1.0 1014 M⊙ and a line-of-sight velocity dispersion of 550 km s-1, and he notes that it would be classified as a poor cluster or large group by observers. He finds that the final central giant elliptical has a small rotation of 50 km s-1, is radially anisotropic in the outer regions, is aligned in position angle with the ‘cluster’ galaxy distribution, and has a slowly declining major-axis velocity dispersion profile. These properties agree with those observed in many BCGs, including our sample described in this paper. All three of our galaxies have little or no rotation, and have significantly positive values which generally indicate radial anisotropy. NGC 6086 and NGC 6173 have velocity dispersion profiles similar to Dubinski’s remnant, and NGC 6173 and NGC 6166 are aligned (to within 20 degrees) of their host cluster/subcluster galaxy distributions and X-ray isophotes (Carter & Metcalfe 1980; Dixon, Godwin, & Peach 1989; Muriel, Bohringer, & Voges 1996; Buote & Canizares 1996). However, more such simulations are needed to see if, among other things, remnants with increasing dispersion profiles and extended halos can be created. Garijo, Athanassoula, & Garcia-Gomez (1997) have run a larger set of simulations of cD formation, with a variety of initial conditions. Some of the simulations produce objects with extended halos and radial anisotropy, and all of the final galaxies have declining velocity dispersion profiles. Note, however, that these simulations were run with all of the mass initially bound to galaxies, probably not physically realistic. The radial anisotropy found by both authors is a result of the ‘cosmological’ mergers that are being modelled, where the initial filamentary structure means that merging galaxies enter the central object on mainly radial orbits.
Further constraints can be placed on formation models if one considers the stellar abundance gradients. Our three galaxies all show modest gradients, comparable with normal bright ellipticals (e.g. Davies, Sadler, & Peletier 1993). These gradients are not as steep as predicted by simple dissipational collapse models (e.g. Larson 1975), however they are steeper than we would expect from hierarchical dissipationless merger models, which predict no gradients. It is not clear what the net effect of gaseous mergers will be, since on the one hand mergers are expected to dilute existing abundance gradients (White 1980), while on the other hand central star formation induced by the merger could augment any gradient (see for instance Mihos & Hernquist 1994). In any case the gradients point to a formation history not too different from that of normal bright ellipticals.
The [Mg/Fe] ratio in NGC 6166 and NGC 6086, and the difference between these two BCGs and NGC 6173, provide important new clues as to the differences between cDs and normal bright ellipticals. If this difference is confirmed by further observations, this is a second property, alongside the globular cluster specific frequency, in which ellipticals differ from spirals and in which cDs are even more extreme. Fisher et al. (1995) and Bender (1996) find that [Mg/Fe] is correlated with velocity dispersion, so perhaps the large [Mg/Fe] offsets seen in our BCGs are simply the continuation of this correlation to the largest measured velocity dispersions. The trend of increasing [Mg/Fe] we see in our three BCGs (Figure 4) does agree with their relative velocity dispersions. A dissipative process is most likely to give rise to these differences, although mergers as a trigger for such a process cannot be ruled out; for instance Zepf and Ashman (1993) interpret the bimodal colour (and hence metallicity) distributions for globular clusters in some elliptical galaxies, including the BCGs M87 and NGC 1399, as evidence for a second, merger induced, epoch of cluster formation.
If we had data for NGC 6166 and NGC 6173 alone, it would be tempting to draw a clear distinction between the two galaxies. NGC 6166 has a rising velocity dispersion, and enhanced [Mg/Fe], a high globular cluster specific frequency (Bridges et al. 1996) and an X–ray cooling flow. NGC 6173 has none of these things 111The evidence that NGC 6173 does not have a high globular cluster specific frequency comes from a deep, unpublished, R band image taken at the same time as the R-band image of Bridges et al. (1996), yet is a galaxy with a similar luminosity and surface brightness profile (Carter 1977). NGC 6086 appears to have a mixture of properties: it has a high [Mg/Fe], yet does not have a rising dispersion profile. It is important to establish which of these properties depend upon the environment of a galaxy, and similar observations of galaxies with cD morphology in low density environments (such as NGC 4839; Oemler 1976) are required.
It is not clear how to interpret the rising velocity dispersion profile that we observe in NGC 6166. One would expect a rising dispersion profile under any model of BCG formation, since under simple energy arguments the BCG dispersion profile should eventually join that of the cluster as a whole (as is the case for NGC 1399/Fornax; see Section 1). However, we note that the three BCGs with increasing dispersions, and where X–ray data for the cluster exist (NGC 6166, IC 1101, Abell 3266) are all in rich clusters with smooth X-ray morphology. There is no evidence for substructure or peculiar BCG velocities in any of these clusters. We suggest that these are old, relaxed clusters in which the BCG is at the centre of the cluster potential; these are the sorts of clusters in which it will be most profitable to search for BCGs with increasing velocity dispersions, in order to study the transition between the BCG and the cluster.
7 ACKNOWLEDGMENTS
We thank Hans-Walter Rix for the use of his program for absorption line profile analysis, and for extensive advice on this subject. We would also like to thank Nicolas Cardiel, Javier Gorgas, Alfonso Aragón-Salamanca, Reynier Peletier, Jim Schombert and an anonymous referee for comments on various aspects of this paper. Thanks also to Cardiel, Gorgas, and Aragón-Salamanca for sharing their data with us prior to publication. The Isaac Newton Telescope is operated on the island of La Palma by the Royal Greenwich Observatory in the Spanish Observatorio del roque de los Muchachos of the Instituto de Astrofisica de Canarias.
References
- [1] Allen S.W., Fabian A.C., 1997, MNRAS, 286, 583.
- [2] Arnaboldi M., Freeman K.C., Hui X., Capaccioli M., 1994, ESO Messenger, 76, 40.
- [3] Barnes J.E., 1996, in Proceedings of IAU Symposium 171, eds R. Bender & R.L. Davies, Dordrecht: Kluwer Academic publishers, p. 191.
- [4] Bender R., 1996, in Proceedings of IAU Symposium 171, eds R. Bender & R.L. Davies, Dordrecht: Kluwer Academic publishers, p. 181.
- [5] Bridges T.J., Carter D., Harris W.E., Pritchet C.J., 1996, MNRAS, 281, 1290.
- [6] Bruzual G., Charlot S., 1997, in preparation.
- [7] Buote D.A., Canizares C.R., 1996, ApJ, 457, 565.
- [8] Burstein D., Davies R.L., Dressler A., Faber S.M., Stone R.S., Lynden-Bell D., Terlevich R.J., Wegner G., 1987, ApJS, 64, 601.
- [9] Cardiel N., Gorgas J., Aragon-Salamanca A., 1998, MNRAS, 298, 977. .
- [10] Carlberg R.G., 1984a, ApJ, 286, 403.
- [11] Carlberg R.G., 1984b, ApJ, 286, 416.
- [12] Carollo C.M., de Zeeuw P.T., van der Marel R.P., Danzinger I.J., Qian E.E., 1995, ApJ, 441, L25.
- [13] Carter D., 1977, MNRAS, 178, 137.
- [14] Carter D., Metcalfe N., 1980, MNRAS, 191, 325.
- [15] Carter D., Efstathiou G., Ellis R.S., Inglis I., Godwin J.G., 1981, MNRAS, 195, 15P.
- [16] Carter D., Inglis I., Efstathiou G., Ellis R.S., Godwin J.G., 1985, MNRAS, 212, 417.
- [17] Carter D., Hau G.K.T., Thomson R.C., 1998, MNRAS, 294, 182.
- [18] Cohen J., Ryzhov A., 1997, ApJ, 486, 230.
- [19] Couture J., Hardy E., 1988, AJ, 96, 867.
- [20] Davidge T.J., 1992, AJ, 103, 1512.
- [21] Davies R.L., 1996, in Proceedings of IAU Symposium 171, eds R. Bender & R.L. Davies, Dordrecht: Kluwer Academic publishers, p. 37.
- [22] Davies R.L., Sadler E.M., Peletier R.F., 1993, MNRAS, 262, 650.
- [23] Dehnen, W., 1995, MNRAS, 274, 919.
- [24] Dixon K.L., Godwin J.G., Peach J.V., 1989, MNRAS, 239, 539.
- [25] Dressler A., 1979, ApJ, 231, 659.
- [26] Dubinski J., 1998, Ap.J. 502, 141.
- [27] Ellis, R.S., Gray, P.M., Carter, D., & Godwin, J.G., 1984, MNRAS 206, 285.
- [28] Faber S.M., Friel E.D., Burstein D., Gaskell C.M., 1985, ApJS, 57, 711
- [29] Fabian A.C., 1994, ARA&A, 32, 277
- [30] Fabian A.C., Nulsen P.E.J., 1977, MNRAS, 180, 479
- [31] Fisher D., Illingworth G., Franx M., 1995, ApJ, 438, 539
- [32] Freeman K.C., 1997, in The Second Stromlo Symposium: The Nature of Elliptical Galaxies, ASP Conf. Ser., Vol. 116, eds: M. Arnaboldi, G.S. Da Costa, P. Saha, pg. 1
- [33] Garijo A., Athanassoula E., Garcia-Gomez C., 1997, A&A, 327, 930
- [34] Gerhard O.E., 1993, MNRAS 265, 213
- [35] Gerhard O.E., Jeske G., Saglia R.P., Bender R., 1998, MNRAS, 295, 197.
- [36] Gonzalez J.J., Gorgas J., 1996, in Fresh Views of Elliptical Galaxies, ASP Conf. Ser., Vol. 86, p. 225
- [37] Gonzalez J.J., Gorgas J., 1997, ApJL, 481, L19
- [38] Gonzalez, J.J., Gorgas J., 1998, in preparation
- [39] Gorgas J., Efstathiou G., Aragon-Salamanca A., 1990, MNRAS, 245, 217.
- [40] Gregory S.A., Thompson L.A., 1984, ApJ, 286, 422.
- [41] Grillmair C.J., Freeman K.C., Bicknell G.V., Carter D., Sommer-Larsen J., Couch W.J., Taylor K., 1994, ApJL, 422, L9.
- [42] Harris W.E., Pritchet C.J., McClure, R.D., 1995, ApJ, 441, 120.
- [43] Hau G.K.T., 1998, Ph.D. Thesis, Cambridge University.
- [44] Hau G.K.T., Carter D., Balcells M., 1998, MNRAS, in press.
- [45] Hausman M.A., Ostriker J.P., 1978, ApJ, 224, 320.
- [46] Heckman T.M., Illingworth G.D., Miley G.K., van Breugel W.J.M., 1985, ApJ, 299, 41.
- [47] Hernquist L., 1993, ApJ, 409, 548.
- [48] Jones C., Mandel E., Schwarz J. Forman W., Murray S.S., Harnded F.R., 1979, ApJL, 234, L21.
- [49] Kissler-Patig M., Brodie J.P., Schroder L.L., Forbes D.A., Grillmair C.J., Huchra, J.P., 1998, AJ, 115, 105.
- [50] Larson R.B., 1975, MNRAS, 173, 761.
- [51] Lauer T.R., 1986, ApJ, 311, 34.
- [52] Malumuth E.M., Kirshner R.P., 1981, ApJ, 251, 508.
- [53] Mathews T.A., Morgan W.W., Schmidt M., 1964, ApJ, 140, 35.
- [54] McElroy D.B., 1995, ApJS, 100, 105.
- [55] McGlynn T.A., Ostriker J.P., 1980, ApJ, 241, 915.
- [56] Merritt D., 1984, ApJ, 280, 5.
- [57] Merritt D., 1985, ApJ, 289, 18.
- [58] Mihos J.C., Hernquist L., 1994, ApJ, 427, 112.
- [59] Minniti D., Kissler-Patig M., Goudfrooij P., Meylan G., 1998, AJ, 115, 121.
- [60] Miralda-Escude J., 1995, ApJ, 438, 514.
- [61] Miralda-Escude J., Babul A., 1995, ApJ 449, 18.
- [62] Moore, B., Katz, N., Lake, G., Dressler, A., & Oemler, A., 1996, Nature, 379, 613.
- [63] Mould J., Oke J.B., de Zeeuw P.T., Nemec J.M., 1990, AJ, 99, 1823.
- [64] Muriel H., Böhringer H., Voges W., 1996, in Proc. Rontgenstrahlung from the Universe, eds. H.U. Zimmerman, J. Trumper, and H. Yorke, MPE Report 263, p. 601.
- [65] Oegerle W.R., Hill J.M., Fitchett M.J., 1995, AJ, 110, 32.
- [66] Oemler, A., 1976, ApJ, 209, 693.
- [67] Ostriker J.P., Tremaine S., 1975, ApJ, 202, L113.
- [68] Peletier R.F., Davies R.L., Davis L.E., Illingworth G.D., Cawson M., 1990, AJ, 100, 1091.
- [69] Postman M., Lauer T.R., 1995, ApJ, 440, 28.
- [70] Richstone D.O., 1976, ApJ, 204, 642.
- [71] Rix H.-W., White S.D.M., 1992, MNRAS, 254, 389.
- [72] Rix H.-W., de Zeeuw P.T., Cretton N., van der Marel R.P, Carollo C., 1997, ApJ, 488, 702.
- [73] Saglia R.P., Bertin G., Bertola F., Danziger J., Dejonghe H., Sadler E.M., Stiavelli M., de Zeeuw P.T., Zeilinger W.W., 1993, ApJ, 403, 567.
- [74] Schombert J.M., 1986, ApJS, 60, 603.
- [75] Schombert J.M., 1987, ApJS, 64, 643.
- [76] Schombert J.M., 1988, ApJ, 328, 475.
- [77] Sembach K.R., Tonry, J.L., 1996, AJ, 112, 797.
- [78] Statler T.S., 1991, ApJL, 382, L11.
- [79] Statler T.S., Smecker-Hane T., Cecil G.N., 1996, AJ, 111, 1512.
- [80] Teague P.F., Carter D., Gray P.M., 1990, ApJS, 72, 715.
- [81] Tonry J.L., 1984, ApJ, 279, 13.
- [82] Tonry J.L., 1985, AJ, 90, 2431.
- [83] Trager, S.C., Worthey, G., Faber, S.M., Burstein, D., & Gonzalez, J.J., 1998, ApJ suppl., 116, 1.
- [84] Tremaine S., 1990, in Dynamics and Interactions of Galaxies, Heidelberg Conference, ed. R. Wielen, p. 394.
- [85] van der Marel R.P., Franx M., 1993, ApJ, 407, 525.
- [86] van der Marel R.P., Rix H.-W., Carter D., Franx M., White S.D.M., de Zeeuw P.T., 1994, MNRAS, 268, 521.
- [87] Vazdekis A., Casuso E., Peletier R.F., Beckman J.E., 1996, ApJS, 106, 307.
- [88] White S.D.M., 1980, MNRAS, 191, 1P.
- [89] Wilson R.E., 1953, Carnegie Inst. Washington D.C. Publ. 601, General Catalogue of Stellar radial velocities.
- [90] Worthey G., 1994, ApJS, 95, 107.
- [91] Worthey G., Faber S.M., Gonzalez J.J., 1992, ApJ, 398, 69.
- [92] Worthey G., Faber S.M., Gonzalez J.J., Burstein D., 1994, ApJ suppl, 94, 687.
- [93] Worthey G., Ottaviani D.L., 1997, ApJS, 111, 377.
- [94] Zabludoff A.I., Geller M.J., Huchra J.P., Vogeley M.S., 1993a, AJ, 106, 1273.
- [95] Zabludoff A.I, Geller M.J., Huchra J.P., Ramella M., 1993b, AJ, 106, 1301.
- [96] Zepf S., Ashman K.M., 1993, MNRAS, 264, 611.
Appendix A Montecarlo simulations of the sensitivity of the recovered kinematic parameters to noise


In this appendix the sensitivity of the kinematic parameters to noise for NGC 6166, NGC 6173 & NGC 6086 is investigated via Montecarlo simulations of the effect of both Poisson noise and sky residuals. Especially of interest is whether the lowered velocity dispersions measured for points beyond for NGC 6166 and beyond for NGC 6173 are significant. For this purpose artificial spectra are generated by convolving the optimal stellar templates at the centres of NGC 6166 & NGC 6173 with perfect Gaussian LOSVDs.
Poisson noise with different random seeds is added to the artificial spectra. Imperfect sky subtraction is investigated by adding blank spectra extracted at large distances from the nucleus. Up to 8 rows are added to mimic the worst case of sky contamination for NGC 6166, and 16 rows for NGC 6173. The kinematic parameters are recovered three times using kinematics, each with different Poisson noise seeds and sections of blank sky.
NGC 6166
For NGC 6166, LOSVDs with and , 450, & are modelled. The artificial spectra are scaled to continuum levels of 12000, 7200, 4200 & 2000 counts per pixel, corresponding to distances of 0, 5, 8 & from the nucleus respectively. Beyond summation is required to achieve 2000 counts per pixel. The number of spectra to be summed is 2, 4, 5 & 8 for distances of approximately , , and from the nucleus respectively. The results of the experiments are plotted in Fig. 1, where the left, centre and right panels correspond to 400, 450 & respectively. For , the mean velocity can be determined to within at distances less than from the nucleus. The scatter increases to at , at , and at . In addition beyond there is a small systematic offset of towards higher velocity. For broader LOSVDs, the behavior is similar, except that the recovering accuracy is lower.
If the velocity dispersion is , it can be determined to within at distances less than from the nucleus. Its scatter increases with distance. In addition, as the contribution of the sky increases with decreasing , the recovered value is systematically lower. The offset is about at , at , and at . The behavior is similar if the LOSVD is broader, except that the magnitude of the systematic offset is larger. At the extreme, the recovered value for a Gaussian LOSVD with at is lower.
In general, the Gauss-Hermite moments and can be recovered reasonably well if , to within at distances up to . Their scatter increases with . No obvious systematics are introduced in even at the outermost points, or when is increased to . A small positive offset of order is introduced in for data points beyond , and this tends to increase with . The Gauss-Hermite moments and can be recovered well to within 0.01 in the inner , and to at . Again, the scatter increases with . In addition a significantly positive offset of is introduced to the at the outer points if sigma is increased beyond .
The conclusions from this exercise are that at distances beyond , where summation of more than 4 spectra are required, systematics start to creep in as the sky contribution increases. At such distances, the recovered velocity dispersions are systematically lower. This shows that we are probably unable to measure LOSVDs broader than beyond these distances, and the low () velocity dispersions beyond actually measured for NGC 6166 are entirely consistent with expectation. For these reasons, we measure up to , and , , , h5 & h6 up to from the nucleus.
NGC 6173
For NGC 6173, LOSVDs with and , 250, & are modelled. The artificial spectra are scaled to continuum levels of 17000, 3600 & 2000 counts per pixel, corresponding to distances of 0, 6, & from the nucleus respectively. Beyond summation is required to achieve 2000 counts per pixel. The number of spectra to be summed is 4, 8 & 16 for distances of approximately , and from the nucleus respectively. The results of the experiments are plotted in Fig. 2, where the left, centre and right panels correspond to 200, 250 & respectively. For , the mean velocity can be determined to within at distances less than from the nucleus. The scatter increases to at and at . In addition beyond there is a small systematic offset of . For broader LOSVDs, the behavior is similar, except that the magnitude of the scatter and the systematic offset is slightly higher.
If the velocity dispersion is , it can be determined to within at distances less than from the nucleus. Its scatter increases with distance. In addition, as the contribution of the sky increases with decreasing , the recovered value is systematically lower. The offset is about at , at , and at . The magnitude of the systematic offset is larger if the LOSVD is broader, and smaller if the LOSVD is narrower. At the extreme, the recovered value for a Gaussian LOSVD with at is lower.
In general, the Gauss-Hermite moments and can be recovered reasonably well if the is high. If , they can be determined to within at distances up to . Their scatter increases with and sky contribution. A small positive offset in is introduced with increasing sky contribution. No significant systematics are introduced in , except for the outermost points at , where tends to be lower. The Gauss-Hermite moments and can be recovered well only near the galaxy centre (). The scatter increases with and increasing sky contribution. If , there are no obvious systematics in with increasing sky contribution. However, at distances larger than is scattered upwards if , and downwards if . tends to be scattered downwards at distances larger than for all .
The tests for NGC 6173 should also be applicable to NGC 6086, as both galaxies have similar velocity dispersions, and are at similar distances. For NGC 6086, the continuum levels are 14600 and 2000 counts per pixel at and . Beyond summation is required. The number of spectra to be summed is 4, 6 & 15 for distances of approximately , and from the nucleus respectively.
The conclusions from this exercise are that at distances beyond , where summation of more than 4 spectra are required, systematics start to creep in as the sky contribution increases. At such distances, the recovered velocity dispersions are systematically lower, but the problem is not as severe as in NGC 6166. This shows that the fall in beyond is probably more gradual in reality. The significance of the Monte Carlo tests is that the in NGC 6173 is consistent with being flat or falling beyond , but inconsistent with rising outwards. We measure , & up to , up to , and & up to from the nucleus.
Recovery of High Values of
The tests described above show that the systematic errors on the recovery of caused by noise are small in the case of = 0. It is important also to ask what other values of can be recovered by our techniques. For NGC 6166 we model LOSVDs with ans , and -0.10, -0.05, 0.00, +0.05, +0.10 and +0.15 respectively, and the results are plotted in Fig. 3. The systematic bias on at low is marginally worse for positive (second panel up in each column), and the main result of this exercise is that there is a systematic underestimation of for . Our measurement of high in NGC 6166 could possibly still be a systematic underestimate.

The Effect of Template Choice
Our kinematic parameters are all determined using optimal best fit templates constructed from 28 stellar spectra. To demonstrate that this procedure does not itself introduce systematic effects into the kinematic parameters, here we repeat the analysis for NGC 6166 using individual template stars. Moreover to demonstrate the effect of template choice on the derived parameters we have carried out this exercise with templates with a wide range of spectral type. In Fig. 4 we plot the kinematic parameters for NGC 6166 derived from the five individual templates: HR7555 (G6III, open squares); HR4864 (G7V, filled triangles); HR6674 (K0III, crosses); HR4676 (K4III, open circles) and HR8057 (M1III, thin rectangles). The trends in the derived parameters are identical to those in Fig. 2, although there are differences in the zero points which depend upon the template choice. The difference in the velocity zero points is not real, it is because this procedure determines the velocity relative to the first star in the list of templates, if there is only one it depends upon the radial velocity of that star. For and all of the Hermite terms the M1III star HR8057 gives a very different zero point, the dispersions are so much lower that many of them are off the bottom of the dispersion panel in Fig. 4. However this star is a very poor fit to the galaxy spectra and does not contribute much to the optimal composite templates. For the other templates, is tightly defined around +0.10, suggesting that template mismatch errors do not contribute to our large positive values of . On the other hand there are large zero point differences in between the G and K star templates, to get reliable values of it is important that the templates used fit well.
The velocity dispersion zero points differ with a total spread of 50 kms-1 (again neglecting HR8057), so the uncertainty of the zero point of the velocity dispersion profile due to template mismatch might be estimated at 25 kms-1.

Appendix B Procedure for measuring Lick absorption line indices
In this appendix we describe the procedures for obtaining absorption line indices in the Lick system. Line indices are extracted from individual, de-redshifted spectra following the procedures outlined in Worthey & Ottaviani (1997), adopting the passband definitions of Worthey et al. (1994). The blue-ward continuum bandpass for Mg2 is redefined to be 4931.6254957.625 Å instead of 4895.1254957.625 Å, because the spectra of the template stars only start from about 4931 Å. The difference between the Mg index Mg2alt under this alternative definition, and the Lick Mg2 index is tiny (see below). The molecular band Mg2alt is measured in pseudo magnitudes, whilst the atomic absorption line indices Fe5270 and Fe5335 are measured as equivalent widths in Angstroms.
| Feature | Type | Central Bandpass | Continuum Bandpasses |
|---|---|---|---|
| (Å) | (Å) | ||
| Mg2alt | Molecular band | 5154.125–5196.625 | 4931.625–4957.625, 5301.125–5366.125 |
| Mg2 | Molecular band | 5154.125–5196.625 | 4895.125–4957.625, 5301.125–5366.125 |
| Fe5270 | Atomic absorption line | 5245.650–5285.650 | 5233.150–5248.150, 5285.650–5318.150 |
| Fe5335 | Atomic absorption line | 5312.125–5352.125 | 5304.625–5315.875, 5353.375–5363.375 |
First, our spectra are broadened to a resolution of FWHM, in common with the Lick/IDS resolution in this part of the spectrum. In NGC 6166, there is significant [NI] emission at . As the [NI] emission line is halfway inside the Mg2 passband, its flux can artificially lower the Mg2 by at the nucleus. Therefore the flux contribution between rest wavelengths 5183.125 Å and 5196.526 Å is measured from the residuals of the kinematic fitting and subtracted off the flux in the Mg2 passband.
The indices are then corrected to a zero dispersion system by applying correction factors. These are estimated by broadening the optimal stellar template of NGC 6166 to different velocity dispersions, and are summarized in table 4. The correction for Mg2 is insignificant even at large dispersions, whilst Fe5335 requires a rather large correction. These corrections are not sensitive to the choice of template used to determine these corrections, in the worst case (Fe5335 at high velocity dispersion) the total range in the factor determined using a range of templates is 0.034, implying an error in the factor as determined from the best fit template of at most 0.01.
| Mg2 | Fe5270 | Fe5335 | |
|---|---|---|---|
| (kms-1) | |||
| 160 | 0.998 | 0.938 | 0.895 |
| 180 | 0.998 | 0.924 | 0.868 |
| 200 | 0.997 | 0.909 | 0.842 |
| 220 | 0.997 | 0.895 | 0.815 |
| 240 | 0.997 | 0.879 | 0.785 |
| 260 | 0.996 | 0.864 | 0.756 |
| 280 | 0.996 | 0.849 | 0.727 |
| 300 | 0.995 | 0.834 | 0.697 |
| 320 | 0.995 | 0.819 | 0.668 |
| 340 | 0.994 | 0.804 | 0.640 |
| 360 | 0.993 | 0.788 | 0.612 |
| 380 | 0.991 | 0.773 | 0.586 |
| 400 | 0.990 | 0.758 | 0.560 |
| 420 | 0.988 | 0.742 | 0.536 |
| 440 | 0.987 | 0.726 | 0.512 |
B.1 Conversion from alternative system to Lick system
To convert Mg2alt to Mg2, a scaling relationship is required. This is obtained by comparing the Mg2 indices for 9 template stars measured under the Lick and our alternative definition. The template stars were observed on the AAT in March 1996 using the RGO spectrograph, and their spectra span the wavelength range 4850 – 5610 Å, and are broadened to FWHM resolution. The fact that these spectra are taken with a completely different instrument and telescope does not pose a problem, as the only variable is the change in bandpass definition. The Mg2 indices under Worthey’s definition are plotted against those under the alternative definition in Fig. 5, and the following relationship is obtained by a linear least-squares fit:
| (1) |
Because the changes introduced by redefining the continuum bandpass are only 0.5% for Mg2, they are unlikely to be a major source of error.
B.2 Lick zero points
Because our spectra are not flux calibrated, there might be a zero point difference between our measured indices and the Lick values, due to the curvature of the response function. Of our standard stars, only one, HR 5277 has been measured on the Lick system. Worthey (private communication) ascribes low weight to the observations of this particular star, and in any case using observations of a standard star to determine the zero points for galaxies is subject to systematic error, due to the substantial redshifts of our galaxies, and the corresponding difference in the grating settings for the observations. Thus we are unable to tie our measurements to the Lick system directly. On the other hand Cardiel et al. (1997) have measurements which we, and they, believe to be on the Lick system. Figure 5 demonstrates good agreement between the Mg2 values in the region in which the data of Cardiel et al. are reliable, and thus we believe that the zero point offset between our values and the Lick system is small, at least in Mg2.
Trager et al. (1998) publish Lick indices for a 1.4 x 4 arcsecond aperture centred on the nucleii of NGC 6086 and NGC 6166. For NGC 6086 they find ; ; . For NGC 6166 they find ; ; . These are consistent with our results, although the error bars on their iron line equivalent widths are disappointingly large. Although some uncertainty remains as to the zero point of the iron line indices, it seems that our indices are within 0.01 magnitudes of the Lick system in the case of Mg2, and within 0.3 Angstrom in the case of the combined iron line index.