CO and C2 Absorption Toward W40 IRS 1a
Abstract
The H II region W40 harbors a small group of young, hot stars behind roughly 9 magnitudes of visual extinction. We have detected gaseous carbon monoxide (CO) and diatomic carbon (C2) in absorption toward the star W 40 IRS 1a. The 2-0 R0, R1, and R2 lines of 12CO at 2.3 m were measured using the CSHELL on the NASA IR Telescope Facility (with upper limits placed on R3, R4, and R5) yielding an of cm-2. Excitation analysis indicates K. The Phillips system of C2 transitions near 8775 Å was measured using the Kitt Peak 4-m telescope and echelle spectrometer. Radiative pumping models indicate a total C2 column density of cm-2, two excitation temperatures (39 and 126 K), and a total gas density of cm-3. The CO ice band at 4.7 µm was not detected, placing an upper limit on the CO depletion of . We postulate that the sightline has multiple translucent components and is associated with the W40 molecular cloud. Our data for W40 IRS 1a coupled with other sightlines, shows that the ratio of CO/C2 increases from diffuse through translucent environs. Finally, we show that the hydrogen to dust ratio seems to remain constant from diffuse to dense environments, while the CO to dust ratio apparently does not.
Subject headings:
dust, extinction – infrared: ISM: lines and bands — ISM: abundances — ISM: clouds — ISM: individual (W40) — ISM: molecules1. Introduction
Molecular species are useful diagnostics for understanding the physics and chemistry of the interstellar medium (ISM), and have been studied in various ways for many years. Most molecules are observed in dense molecular clouds via rotational emission lines in the radio band. These emission studies are indispensable to our understanding of galactic ecology and the ISM: They yield maps of dense regions, have very high spectral (velocity) resolution, and allow us to study complex molecules not otherwise observable.
There are some drawbacks to molecular emission studies, however. First, analysis of the line excitation is very model-dependent and can lead to significant systematic errors. Second, since spatial resolution is typically low (and varies from species to species), it is sometimes hard to discern whether emission from different species comes from the same location within a cloud. This makes comparisons among species difficult.
Molecular absorption line observations have some important advantages over emission line studies. First, absorption from different species observed in the same line of sight are more likely to coexist spatially, thus reducing geometrical ambiguities and allowing more reliable inter-species comparisons. Second, because the unexcited molecules are observed directly, column density determinations are not as model-dependent as for emission studies, and hence more accurate. Third, some molecular species (notably H2 and C2) are essentially unobservable in the radio due to lack of a dipole moment. These species can sometimes be observed via electronic transitions in the ultraviolet (e.g., Shull & Beckwith (1982)), or through rotational-vibrational transitions in the visible or infrared (e.g. Federman et al. (1994); Lacy et al. (1994)). And finally, molecular abundances derived from absorption measures can easily be compared to line-of-sight bulk properties (e.g., extinction, polarization, and atomic abundances) which are also derived from absorption measures.
CO and C2 have transitions at 2.3 m and 8775 Å, respectively, which can be observed in absorption. The primary drawback to studying molecular absorption lines in the infrared (IR) is finding a suitable background star. The target must be bright in the IR yet fortuitously placed behind a substantial amount of absorbing material.
In our effort to find background sources for absorption line studies in regions also accessible to emission-line studies, we have selected the target W40 IRS 1a, an OB star embedded within the radio source W40. This source appears well-suited for our purposes; Though dim in the visible () it is bright in the IR (), and lies behind about 9 magnitudes of extinction in (). W40 itself is a blister-type H II region breaking out of a local molecular cloud, about 400 pc away towards the galactic center (Zeilik & Lada (1978); Crutcher & Chu (1982)). A group of hot stars (most likely B-class) is bathing the region with ionizing radiation; W40 IRS 2a (OS 2a) seems to be producing most of the energy (Smith et al. (1985)). IRS 1a is brighter than 2a in the optical and near-IR indicating somewhat greater extinction toward IRS 2a. Crutcher and Chu (1982) mapped 12CO and 13CO, HCO+, HCN and H emission toward W40, generating a comprehensive kinematic interpretation of the region. Vallée et al. (1987, 1991, 1992, and 1994) have done extensive studies on the properties of the molecular cloud and its interaction with the H II region using C II recombination lines, radio continuum emission, and CO emission. The existence of circumstellar dust shells around W40 IRS 1a, 2a and 3a ( K and ) has been suggested based on broad-band IR imaging and continuum measurements in the millimeter and sub-millimeter (Smith et al. (1985); Vallée & MacLeod (1994)).
Both CO and C2 are important interstellar molecules. CO is the most abundant molecule in the ISM after molecular hydrogen, and has a number of important roles: The CO emission lines at 2.6 mm and shorter are not only responsible for cooling molecular clouds but also serve as tracers for H2 and dense molecular gas (e.g., Magnani & Onello (1995) and references therein). C2 is much less abundant than CO and has been observed primarily in diffuse and translucent clouds (e.g. van Dishoeck & Black (1989); Lambert, Sheffer, & Federman (1995)). Like H2, C2 has no dipole moment and hence no pure rotational spectrum. It is a very useful diagnostic of cloud physical conditions such as kinetic temperature, density, and radiation field intensity (van Dishoeck & Black (1982); van Dishoeck (1984)). Both CO and C2 are important to carbon chemistry everywhere in the ISM.
CO absorption at 2.3 m () has not been observed as frequently as the v = 1 - 0 band at 4.7 m, most likely owing to the smaller transition probabilities. It is, however, easier to observe at 2.3 m since the thermal background from the Earth’s atmosphere is much lower than at 4.7 m. Black and Willner (1984) and Black et al. (1990) used the lines at 2.3 m to study the physical conditions and chemistry toward NGC 2024, NGC 2264 and AFGL 2591. Recently, Lacy et al. (1994) were able to observe both CO and H2 absorption near 2.3 m toward NGC 2024 IRS 2 yielding for the first time a direct measure of the H2/CO ratio in a molecular cloud.
Absorption lines of C2 have been used to address a number of problems in the ISM, including: Diffuse interstellar cloud chemistry (e.g. Lambert, Sheffer, & Federman (1995)), carbon chemistry in translucent clouds (e.g. van Dishoeck & Black (1989)), molecular cloud envelopes (e.g. Federman et al. (1994)), and the line of sight structure toward Oph (e.g. Crawford (1997)). Federman et al. (1994) provide a good compilation of C2 measurements up to 1992.
In this paper we report on absorption-line studies of CO and C2 toward W40 IRS 1a. The line of sight is discussed in the next section. In Section 3 we describe our observations and the results, and in Section 4 we discuss their implication for the physical state of the material in this line of sight. The final section contains a brief summary of our conclusions.
2. Line Of Sight
Very little is known about the interstellar sightline to W40 IRS 1a. Both Crutcher and Chu (1982) and Smith et al. (1985) infer . The average extinction due to diffuse material over 400 pc is about 0.6 mag (see Spitzer (1978), p. 155). Therefore the obscuring material is most likely local to the W40 region and more dense than the diffuse ISM. In addition, Crutcher and Chu (1982) found a molecular 13CO component in front of the W40 H II region with km s-1, cm-2, and , further suggesting that the sightline passes through cold material, most likely associated with the neighboring molecular cloud.
The line of sight intersects at least 3 distinct physical regimes. As noted above there appears to be some cold foreground material, perhaps associated with the nearby molecular cloud. Closer to W40 IRS 1a there must be a photon-dominated region (PDR), and closer still, the W40 H II region itself. If W40 IRS 1a has a circumstellar dust shell, it is not clear what its effect on the CO and C2 spectra might be. A warm dust shell might be associated with an elevated gas temperature, and hence the appearance of high- molecular rotational lines.
The H II region is roughly 0.9 pc across and has an electron density of 200 cm-3 (based on results in Crutcher and Chu [1982] and a distance of 400 pc). The column density of ionized hydrogen associated with the H II region should be about cm-2, assuming spherical geometry and that all hydrogen is ionized. Using the relation of total hydrogen column density to extinction found in Bohlin, Savage, & Drake (1978), the H II region should contribute mag to the line-of-sight extinction. This, of course, assumes a standard gas-to-dust ratio, which may not apply to H II regions in general. The contribution to could increase or decrease depending primarily on the nature of any grain-destroying shocks which may have passed through the region. In either case, the H II region probably does not strongly contribute to the total extinction on the line of sight to W40 IRS 1a. In addition, molecules like CO and C2 cannot survive in the harsh H II environment, so the H II region should not contribute to the line-absorption for these molecules either.
There is almost surely a photon-dominated region (PDR) on the line of sight to W40 IRS 1a, which could account for as much as , nearly the entire measured visual extinction (see Hollenbach (1990) for a good discussion). Hydrogen is expected to be neutral or molecular throughout the PDR. CO and perhaps C2 cannot survive in the regions of the PDR closest to the H II region. The effect of dust in PDRs is poorly understood, and so a quantitative treatment of these regions in general is difficult.
In summary, CO and C2 absorption lines should sample the cold material in the foreground, at least part of the PDR, and none of the H II region. A circumstellar dust shell, if it exists, would most likely only contribute to high- molecular absorption. The visual extinction () should arise almost entirely in the foreground material (which may be part of the local molecular cloud) and the PDR, though we note that the PDR could in theory produce all of the observed extinction.
3. Data and Analysis for 12CO and C2 toward W40 IRS 1a
3.1. C2 Observations at 8775 Å
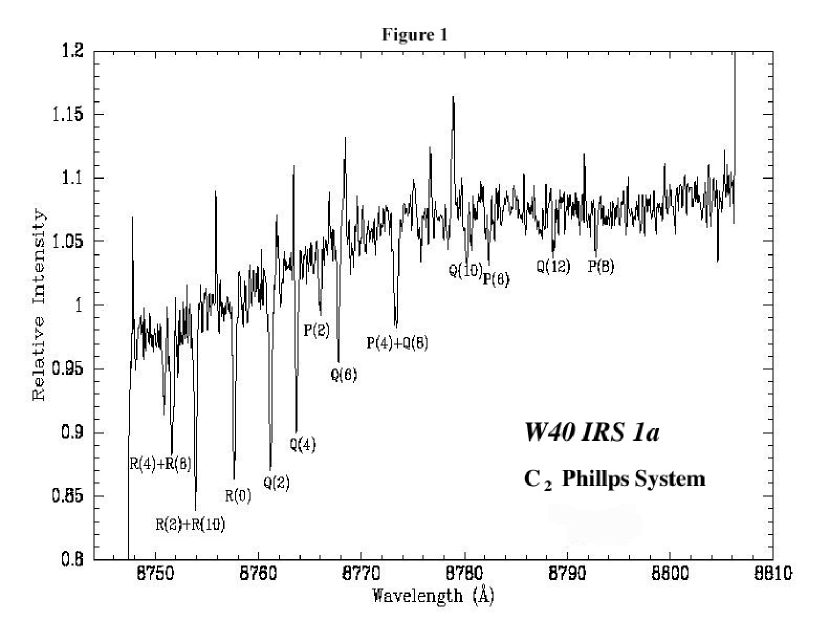
The observations of W40 IRS 1a were obtained with the Cassegrain echelle spectrograph and the RCA CCD camera on the 4-m Mayall telescope at Kitt Peak National Observatory on the night of UT 16 June 1983. Two spectra, each of one hour’s duration, were recorded in the region of the 2-0 band of the Phillips system (A – X) of C2. The entire 2-0 band was contained in a single order with its center near 8775 Å and with a nominal reciprocal dispersion of 0.074 Å per pixel at the face of the CCD chip. Quartz lamp and thorium-argon spectra were obtained for flat-fielding and wavelength calibration. An 84 m wide slit was employed, providing a nominal resolution of 0.15 Å which in turn corresponds to approximately 2 pixels on the chip.
The two consecutive one-hour frames were co-added and averaged. Similarly, two separate flat-field frames were co-added and averaged, and the result was divided into the averaged stellar frame to produce the final photometric spectrum. Both flat-field and stellar frames were bias-corrected. The average of fifteen bias frames was first subtracted from the flat-field and stellar frames, after which a second-order bias correction was accomplished by subtracting from the average stellar and flat-field frames the mean row biases obtained from the masked bias columns of each.
The final spectrum was extracted by collapsing the three columns along the slit direction which contained the maximum signal. This spectrum is shown in Figure 1. Spikes are due to cosmic ray hits and possibly OH airglow lines. Rotational lines in all three branches (P, Q and R) were identified, with the rotational quantum number reaching as high as 12 for the Q-branch. Unfortunately, there were problems with the wavelength calibration at the telescope and we were not able to derive a precise measure for the radial velocities of the C2 lines. Equivalent widths for these lines were determined using standard spectral reduction procedures in the NOAO/IRAF package, and column densities for each of the rotational levels were calculated from the rotational lines using a simple Gaussian curve-of-growth (c.f. Spitzer (1978)). Initially, the -value derived by Erman et al. (1982) was used. Recently, the Phillips system transition probabilities have been refined (see Lambert, Sheffer, & Federman (1995) and references therein) and the column densities have been adjusted to reflect the new -value derived by Lambert, Sheffer, and Federman (1995), . The data for each line and the column densities for each are shown in Tables 1 and 2. Several of the lines exhibited effects of saturation, and an estimate of the Doppler constant () was derived by requiring that rotational lines originating from the same rotational energy level yield the same rotational population for that level. This method is a simple extension of the doublet ratio method used in the analysis of saturated atomic species. The best value for the Doppler constant was found to be 1.25 km s-1. The data are not included due to high uncertainty: Only the Q12 line was observed and it is very weak.
3.2. 12CO Observations at 2.3 m
The rotational-vibrational lines for CO fall near 2.3 m, within the K band. Since the oscillator strengths are smaller, the lines are not as saturated as their cousins at 4.7 m. In addition, it is somewhat easier to observe at 2.3 m, as the sky emission at 4.7 m is much greater and more problematic. Contamination from stellar CO absorption should be negligible since W40 IRS 1a appears to be a hot O or B star, which would not allow stellar CO to survive (Crutcher & Chu (1982); Smith et al. (1985)). Circumstellar gas and dust, if it exists, could affect the high- molecular levels.
Ro-vib transitions at 2.3 m for 12CO were observed UT 11 June 1994 and UT 21 July 1997 using the CSHELL IR spectrometer at NASAs Infrared Telescope Facility (IRTF) on Mauna Kea. The IRTF is a 3 meter primary, off-axis cassegrain yielding f/13.67 at the spectrometer slit. The CSHELL is a cryogenically cooled echelle spectrometer with a 256 x 256 SBRC InSb detector array (Greene et al. (1993)). We used the 0.5 ″ slit which gives . Only the R0, 1, and 2 transitions were detected (Figure 3) with upper limits placed on R3, 4 and 5. A summary of the observations is shown in Table 3. The data were obtained and reduced following typical IR observing procedures which we briefly summarize below.
Dark frames were coadded and subtracted from the flat-field image for each wavelength setting. W40 IRS 1a and the standard stars were observed in both the “A” and “B” beams (each beam places the spectrum in a different spatial location on the detector). Beam differences (A-B and B-A) were calculated to eliminate sky emission, then coadded and normalized using the flat field for the appropriate wavelength setting. Wavelength calibration was achieved using Ar, Kr, and Xe lamps with 3 lines per wavelength setting. One dimensional spectra for W40 IRS 1a, the standard stars, and the calibration lamps were then extracted from the detector images using the APALL task in IRAF.
Once the wavelength solution was applied, telluric absorption features were identified in both the standard stars and W40 IRS 1a spectra. Telluric lines were eliminated from the W40 IRS 1a spectra using the IRAF task TELLURIC, which shifts and scales the standard star spectrum before dividing into the object spectrum. It is important to note that merely dividing the standard star spectrum into the object spectrum does not produce the true object spectrum without telluric features. To properly remove telluric features, one must generate an expected object spectrum, convolve it with the standard star spectrum, and compare to the actual observed object spectrum. Lacy et al. (1994) give a good discussion of this technique. We opted to merely divide, however, as our data quality did not warrant more sophisticated techniques.
The R0, 1, and 2 lines are shown in Figure 3. These lines imply km s-1, in contrast with the 8 km s-1 foreground molecular material seen in emission (Crutcher & Chu (1982)). Since emission line data sample a large, beam-averaged area, and absorption lines just a pencil beam, we do not necessarily expect velocities derived from both to agree. We merely note that they are not wildly different.
corresponds to a resolution of km s-1. The R0, 1, and 2 lines all have FWHM km s-1 and hence are not well-resolved. After continuum normalization, each line was directly integrated for equivalent width. Errors reflect continuum placement ambiguity and are of high confidence (). All the widths (along with transition information and errors) are given in Table 4. Widths for the R3, R4 and R5 lines are 2 upper limits based on the noise in the continuum at the expected line position.
The equivalent width of any absorption line is dependent on the column density of the species and, if saturated, the velocity parameter b (c.f. Spitzer (1978)). We generated a model curve of growth (COG) using km s-1, as determined from the C2 lines. Each 12CO equivalent width was fit to the COG independently and the column density for each rotational level () is given in Table 5. The R2 through R5 lines were clearly optically thin while the R0 and R1 lines were more optically thick, falling on the transition from the linear portion to the saturated part of the COG. If the -value for CO is greater than 1.25 km s-1, then the R0 and R1 lines become more optically thin and their abundances drop by 2 and 0.5 cm-2 respectively. Summing the abundances for each line gives a total column density of cm-2 (assuming 12CO to be the dominant isotope). Depending on the excitation of the higher levels, this value could be slightly too small, and if km s-1, then it would be too high. Our column density for CO is nearly identical to that inferred by Crutcher & Chu (1982) for the foreground, cm-2.
3.3. CO Ice Band at 4.7 µm
In an effort to detect the CO ice band at 4.7 µm we made observations with moderate spectral resolution at the United Kingdom IR Telescope (UKIRT) using the CGS4 on 19 August 1998. All observations were carried out while nodding along the slit to remove atmospheric emission. The total integration time on W40 IRS 1a was 11.2 minutes at an average airmass of 1.45. The spectrum for W40 IRS 1a was ratioed by BS 7236 (B9V) to remove telluric absorption features. The S/N is at 4.67 µm and no CO ice feature is apparent. An upper limit for the optical depth of the band is (2), implying cm-2 (Tielens & Allamandola (1987)). The depletion of CO into icy mantles for the W40 IRS 1a sightline must be less than 1 %.
4. Discussion
4.1. Excitation Conditions and the Foreground Cloud Physical Properties
We have three basic diagnostics for the temperature and density toward W40 IRS 1a. The 13CO emission data imply , much lower than the nearby molecular cloud, (Crutcher & Chu (1982)). Excitation conditions can also be derived from the rotational populations of CO and C2.
The rotational level populations of the C2 Phillips system () are attained via radiative pumping. Lifetimes of these levels are so long that collisions and upward electronic transitions are the most important depopulation mechanisms. Hence the rotational populations reflect the competition between pumping and collisions and are non-thermal in general (van Dishoeck & Black (1982)). For densities greater than cm-3 the and levels are very nearly thermal. Otherwise, the populations depend on the thermal temperature, , and the radiation parameter, , where is the collision partner density (usually HH), is the effective cross section for collisional de-excitation, and is the scaling factor for the radiation field in the far-red (van Dishoeck & Black (1982)).
Total molecular abundance and excitation temperatures were calculated from models which fit a Maxwell-Boltzmann population distribution to the observed rotational level abundances. As had been found for other relatively dense clouds (Lutz & Crutcher (1983)), the rotational abundances could not be fit with a single temperature distribution, presumably as a result of radiative pumping (Chaffee et al. (1980); van Dishoeck & Black (1982)). Consequently, we fit these data with a two-temperature model used by Lutz and Crutcher (1983): J-levels 4 through 10 were fit with an excitation temperature () of 126 K, which we associate with the effects of radiative pumping. After correcting the populations in J = 0 and 2 for the contributions from the 126 K population distribution, we derived a J=2/J=0 excitation temperature of 39 K, which we associate with the thermal distribution of the gas. The resulting total column density of C2 towards W40 IRS 1a is cm-2, based on a Boltzmann distribution for both temperatures. This is the highest column density of C2 yet seen in absorption. Figure 2 shows the final fits.
In comparing the results for W40 IRS 1a to the radiative pumping models calculated by van Dishoeck (1984), we found that they are best characterized by her model with a kinetic temperature of 40 K and a radiation parameter, of . Assuming , cm2 (van Dishoeck & Black (1989)), and that hydrogen (H I + H2) is the only important collision partner, we get cm-3 for the W40 IRS 1a sightline. Since the value of is not known to better than a factor of 2 (van Dishoeck & Black (1989)), our value for is equally imprecise. In addition, for an enhanced (or depleted) radiation field, the estimated collision (hydrogen) density would scale accordingly.
Rotational transitions of CO are primarily excited by collisions with hydrogen. De-excitation can occur via collisions with hydrogen or by spontaneous line emission. The critical density at which collisions begin to overtake spontaneous emission is around 3000 cm-3. More detailed studies of the excitation, photodissociation, and chemistry have been conducted by van Dishoeck & Black (1988) and Warin, Benayoun, & Viala (1996). In general it is found that the rotational populations of CO are sub-thermal except for the first few levels in dense cases (Warin, Benayoun, & Viala (1996)). Hence the assumption of LTE will almost always produce excitation temperatures which underestimate the actual thermal temperature (). Recent work by Wannier, Penprase, & Andersson (1997) suggests that the dominant form of CO excitation in diffuse and translucent clouds can be line emission from nearby molecular clouds, if the clouds have similar velocity vectors.
As a start, we constructed a Boltzmann plot for the 12CO data (Figure 4). Fitting the temperature to all lines gives K. This value is similar to that found by Cruther & Chu (1982), but it is important to note that the excitation temperatures for 13CO and 12CO are different in general (Warin, Benayoun, & Viala (1996)). Since the thermal temperature is greater than the CO rotational temperature in general, K, which is consistent with the C2 analysis. Warin, Benayoun, & Viala (1996) have constructed models of CO excitation for the dense, translucent, and diffuse cloud regimes, including UV photodissociation. These models show very clearly that the excitation temperature is much lower than the thermal temperature for diffuse and translucent clouds. The excitation of CO in dense clouds is nearly thermal and . If we assume that the cloud(s) toward W40 IRS 1a are dense, then K. For diffuse and translucent clouds, the level populations observed can be scaled (see Section 4.2 of Warin, Benayoun, & Viala [1996]) to derive “pseudo-LTE” rotational populations, i.e. representative LTE populations for the actual thermal temperature of the gas. A slope can be fitted to these populations and a thermal temperature inferred. If the cloud(s) toward W40 IRS 1a are translucent, then the R0 population is reduced by (changes in R1 and R2 happen to be negligible). The resulting populations imply K (see Figure 4), which still does not agree with the C2 analysis. It is not clear, however, that the models constructed by Warin, Benayoun, & Viala (1996) apply to our line of sight: The UV field is probably higher than normal near W40, and it seems very likely that there are multiple clouds on the sightline.
Since the cloud(s) on the W40 IRS 1a line of sight are very near the W40 molecular cloud, and the LSR velocities of both are similar (5 and 8 km s-1), the excitation for 12CO may be at least partially radiative. Comparing to models constructed by Wannier, Penprase, & Andersson (1997) it is apparent that our K is degenerate: It can be accounted for by many combinations of radiative excitation, collision partner density, and kinetic temperature. The C2 excitation conditions can help constrain those for 12CO. If we assume K, the density of the gas can range from 0 to 450 cm-3, depending on the efficiency of radiative excitation. Collisional excitation becomes dominant as approaches 450 cm-3 (which we use as an upper limit). If we further assume cm-3 (as indicated by the C2 data), then the excitation of CO can only be explained by collisional and radiative processes combined.
A summary of the W40 IRS 1a sightline cloud physical properties based on the CO and C2 data in this paper as well as the CO emission study by Crutcher and Chu (1982) is given in Table 6. As discussed in Section 2, we assume that nearly all of the absorption on this line of sight arises in one cloud complex (single or multiple components) local to the W40 region, since it is only 400 pc distant (i.e., the cloud(s) cannot be diffuse). The physical conditions are best determined by C2: cm-3 and K. The CO emission and absorption values and limits agree very well. The cloud(s) are clearly not dense enough to be considered molecular, but could be considered translucent. Translucent lines of sight typically have and can be studied via both absorption lines (UV, optical, and/or IR), and radio emission lines. In addition, translucent material is expected in the outer envelopes of molecular clouds (van Dishoeck & Black (1989)). We postulate that the W40 IRS 1a sightline is composed of multiple translucent components associated with the W40 molecular cloud.
4.2. Molecular Abundances
CO and C2 abundances have been determined jointly for a number of sightlines, a sample of which is shown in Table 7. W40 IRS 1a is one of few sightlines allowing a direct comparison of CO and C2 in absorption. The abundance ratio we derive is CO/C2 (2). The depletion of CO onto dust is negligible (), in view of our failure to detect CO ice, but the C2 depletion has not been assessed. Note that the CO/C2 ratio increases from diffuse to translucent and molecular regimes indicating (to first order) that the formation/destruction rates favor CO over C2 as cloud type changes. This may merely be due to self-shielding of CO, but other processes may also be in action: The data are not yet precise enough to tell.
Assuming all hydrogen is molecular, we can estimate the amount of H2 on the W40 IRS 1a line of sight from . Using an H2/CO ratio of (based on the direct comparison of H2 and CO IR absorption lines toward NGC 2024 IRS 2 (), Lacy et al. (1994)), we find cm-2. The H2:CO ratio is derived from a direct comparison of weak absorption lines and hence should be reliable, but is based on only one data point: NGC 2024 IRS 2. If this sightline is abnormal in any way, then the ratio does not necessarily apply to other lines of sight such as W40 IRS 1a.
4.3. Dust Indicators
The calculated by Crutcher and Chu (1982) and Smith et al. (1985) assumes a “normal” extinction law (), which may be incorrect. The ratio of visual to selective extinction, , is a grain size distribution indicator (Cardelli, Clayton, & Mathis (1989)): implies an abundance of small grains compared to the typical size distribution, whereas implies that larger grains dominate the extinction. As interstellar clouds collapse the dust grains tend to agglomerate, eliminating the smaller particles (Jura (1980)). If the line of sight toward W40 IRS 1a does indeed sample the edge of a molecular cloud, then we would expect a population of larger grains and . Smith et al. (1985) found = 2.2 for W40 IRS 1a and assuming it is an OB star, . For , we get a range in of 7.5 to 12.5, which agrees with the previous work by Crutcher and Chu (1982) and Smith et al. (1985).
Our calculated value of can be used to predict the amount of CO expected toward W40 IRS 1a. As discussed in Section 2, however, the extinction and CO absorption may not be well-correlated in the PDR, leading us to slightly overestimate based on . Conversely, most studies of the CO/ ratio have not addressed the depletion of CO into ice mantles (which may be as high as 40 %, Chiar et al. (1995)). Since CO is almost entirely in the gas-phase for the W40 IRS 1a line of sight, these studies will underestimate the predicted CO column density. Using radio maps, spectroscopic data, and star counts in the Taurus and Oph clouds, Frerking, Langer, and Wilson (1982) found:
| (1) |
for in cm-2 and . This relation predicts cm-2 (with COC18O) for our line of sight, very nearly the same as we have measured. Interestingly, it may be that the PDR effect nearly balances the depletion effect.
There is no strong correlation between C2 and (van Dishoeck & Black (1989)) though other dust indicators have not been investigated. The lack of correlation may be due to the fact that many of the stars included in C2 absorption studies to date have been distant supergiants where some of the sightline extinction is caused by diffuse clouds, which lack abundant C2.
Comparing the W40 IRS 1a sightline to others in Table 7, it is apparent that CO and C2 generally increase with but the data are too scattered to draw any strong conclusions.
The measurement of CO and C2 absorption toward Cyg OB2 No. 12, the classic diffuse cloud line of sight with , is quite interesting. Lutz and Crutcher (1983) found cm-2 (adjusted for new Phillips system -values in Lambert, Sheffer, and Federman (1995)), about half of the abundance on the W40 IRS 1a sightline. Recently, McCall et al. (1998) measured CO IR absorption toward Cyg OB2 No. 12 yielding cm-2, a factor of 60 less than what we find for W40 IRS 1a over nearly the same total visual extinction. The 4.7 m CO ice feature is not seen on this line of sight; therefore, depletion of CO onto ice mantles cannot readily explain the discrepancy. This clearly shows that the gaseous CO to dust ratio changes from diffuse to denser environments.
As an interesting side note, we have compared the total hydrogen column density (assuming all of it to be molecular) for both W40 IRS 1a and NGC 2024 IRS 2 to the hydrogen/reddening correlations found by Bohlin, Savage, and Drake (1978) and Dickman (1978) (Figure 5). The for NGC 2024 IRS 2 assumes (Lacy et al. (1994); Jiang, Perrier, & Lena (1984)) and ranging from 3 to 5. The correlations (“intercloud” and “cloud”) from Bohlin, Savage, and Drake (1978) are based on L absorption for lightly reddened sightlines with , while the relation from Dickman (1978), derived from CO emission, is good to . In Figure 5 we have extrapolated out to . The data from W40 IRS 1a and NGC 2024 IRS2 agree with the extrapolated relations surprisingly well, within factors of 2 or so.
5. Conclusions
We have used 12CO and C2 IR and visible absorption lines to investigate the line of sight toward W40 IRS 1a. The C2 data were obtained at the 4 m Mayall Telescope at KPNO and the 12CO data from the CSHELL on the IRTF. The CO ice band at 4.7 µm was not detected. This sightline is clearly much more dense than diffuse, based on and a distance of only 400 pc (we calculate a range in of 7.5 to 12.5, assuming a population of large grains). Our 12CO and C2 data show:
1. The C2 excitation conditions, K and cm-3, agree with limits determined from CO emission and absorption. Since the is large and both absorption and emission measures are available, we postulate that the W40 IRS 1a sightline has multiple translucent components.
2. The non-detection of CO ice indicates a CO depletion of .
3. Comparing to other sightlines in Table 7, we find an overall increase in and with increasing . The data, however, are too scattered to draw any further conclusions at this point. The ratio of CO to C2 appears to increase from diffuse to translucent and molecular sightlines probably due to the self-shielding of CO.
4. The column density of CO toward W40 IRS 1a is times that found for Cyg OB2 No. 12, the classic diffuse line of sight (McCall et al. (1998)), despite very similar values. This is not a depletion effect, and suggests that the CO-to-dust ratio changes from diffuse to dense environments.
5. Finally, the relationship of hydrogen column density to interstellar reddening (Bohlin, Savage, & Drake (1978); Dickman (1978)) was found to be roughly consistent with recent data out to (Figure 5). Contrary to the CO-to-dust ratio, the hydrogen-to-dust ratio appears to be valid from diffuse to dense regimes.
References
- Black & Willner (1984) Black, J. H. & Willner, S. P. 1984, ApJ, 279, 673
- Black et al. (1990) Black, J. H., van Dishoeck, E. F., Willner, S. P., & Woods, R. C. 1990, ApJ, 358, 459
- Bohlin, Savage, & Drake (1978) Bohlin, R. C., Savage, B. D., & Drake, J. F. 1978, ApJ, 224, 132
- Cardelli, Clayton, & Mathis (1989) Cardelli, J. A., Clayton, G. C., & Mathis, J. S. 1989, ApJ, 345, 245
- Chackerian and Tipping (1983) Chackerian, C. & Tipping, R. H. 1983, J. Molec. Spectrosc., 99, 431
- Chaffee et al. (1980) Chaffee, F. H., Jr., Lutz, B. L., Black, J. H., Vanden Bout, P. A., & Snell, R. L. 1980, ApJ, 236, 474
- Chiar et al. (1995) Chiar, J. E., Adamson, A. J., Kerr, T. H., & Whittet, D. C. B. 1995, ApJ, 455, 234
- Crawford (1997) Crawford, I. A. 1997, MNRAS, 290, 41
- Crutcher & Chu (1982) Crutcher, R. M. & Chu, Y. 1982, Regions of Recent Star Formation, 53, Roger, R. S. & Dewdney, P. E. eds.
- Dickman (1978) Dickman, R. L. 1978, ApJS, 37, 407
- Erman et al. (1982) Erman, P., Lambert, D. L., Larsson, M., & Mannfors, B. 1982,ApJ, 253, 983
- Federman et al. (1994) Federman, S. R., Strom, C. J., Lambert, D. L., Cardelli, J. A., Smith, V. V., & Joseph, C. L. 1994, ApJ, 424, 772
- Federman et al. (1999) Federman, S. R., Lambert, D. L., van Dishoeck, E. F., Andersson, B-G, & Zsargo, J. 1999, in prep
- Frerking, Langer, & Wilson (1982) Frerking, M. A., Langer, W. D., & Wilson, R. W. 1982, ApJ, 262, 590
- Gredel et al. (1992) Gredel, R., van Dishoeck, E. F., de Vries, C. P., & Black, J. H. 1992, A&A, 257, 245
- Gredel, van Dishoeck, & Black (1994) Gredel, R. , van Dishoeck, E. F., & Black, J. H. 1994, A&A, 285, 300
- Greene et al. (1993) Greene, T. P., Tokunaga, A. T., Toomey, D. W., & Carr, J. S. 1993, Proc. SPIE, 1946, 313
- Hollenbach (1990) Hollenbach, D. J. 1990, ASP Conference Series Vol. 12, The Evolution of the Interstellar Medium, L. Blitz ed., p. 167
- Jiang, Perrier, & Lena (1984) Jiang, D. R., Perrier, C., & Lena, P. 1984, A&A, 135, 249
- Jura (1980) Jura, M. 1980, ApJ, 235, 63
- Lacy et al. (1994) Lacy, J. H., Knacke, R., Geballe, T. R., & Tokunaga, A. T. 1994, ApJ, 428, L69
- Lambert, Sheffer, & Federman (1995) Lambert, D. L., Sheffer, Y., & Federman, S. R. 1995, ApJ, 438, 740
- Lutz & Crutcher (1983) Lutz, B. L. & Crutcher, R. M. 1983, ApJ, 271, L101
- Magnani & Onello (1995) Magnani, L. & Onello, J. S. 1995, ApJ, 443, 169
- Mantz & Maillard (1974) Mantz, A. W. & Maillard, J.-P. 1974, J. Molec. Spectrosc., 53, 466
- McCall et al. (1998) McCall, B. J., Geballe, T. R., Hinkle, K. H., & Oka, T. 1998, Science, 279, 1910
- Shull & Beckwith (1982) Shull, J. M. & Beckwith, S. 1982, ARA&A, 20, 163
- Smith et al. (1985) Smith, J., Bentley, A., Castelaz, M., Gehrz, R. D., Grasdalen, G. L., & Hackwell, J. A. 1985, ApJ, 291, 571
- Spitzer (1978) Spitzer, L.Jr. 1978, Physical Processes in the Interstellar Medium, (New York: Wiley)
- Tielens & Allamandola (1987) Tielens, A. G. G. M. & Allamandola, L. J. 1987, Physical Processes in Interstellar Clouds, eds. G. E. Morfill & M. Scholer, p. 333, Dordrecht: Reidel
- Vallée (1987) Vallée, J.P. 1987, A&A, 178,237
- Vallée & MacLeod (1991) Vallée, J. P. & MacLeod, J. M. 1991, A&A, 250, 143
- Vallée, Guilloteau & MacLeod (1992) Vallée, J. P., Guilloteau, S. & MacLeod, J. M. 1992, A&A, 266, 520
- Vallée & MacLeod (1994) Vallée, J. P. & MacLeod, J. M. 1994, AJ, 108, 998
- van Dishoeck (1984) van Dishoeck, E. F. 1984, PhD Thesis, Leiden University
- van Dishoeck & Black (1982) van Dishoeck, E. F. & Black, J. H. 1982, ApJ, 258, 533
- vna Dishoeck & Black (1988) van Dishoeck, E. F. & Black, J. H. 1988, ApJ, 334, 771
- van Dishoeck & Black (1989) van Dishoeck, E. F. & Black, J. H. 1989, ApJ, 340, 273
- Wannier, Penprase, & Andersson (1997) Wannier, P., Penprase, B. E., & Andersson, B-G 1997, ApJ, 487, L165
- Warin, Benayoun, & Viala (1996) Warin, S., Benayoun, J. J., & Viala, Y.P. 1996, A&A, 308, 535
- Zeilik & Lada (1978) Zeilik, M. & Lada, C. J. 1978, ApJ, 222, 896
| Transition | Rest Wavelength (Å) | Equivalent Width (mÅ) |
|---|---|---|
| R0 | 8757.7 | |
| R2 | 8753.9 | aaR2 and R10 are blended |
| Q2 | 8761.2 | |
| P2 | 8766.0 | |
| R4 | 8751.6 | bbR4 and R8 are blended |
| Q4 | 8763.7 | |
| P4 + Q8 | 8773.3 | |
| R6 | 8750.8 | |
| Q6 | 8767.7 | |
| P6 | 8782.3 | |
| P8 | 8792.6 | |
| Q10 | 8780.1 | |
| Q12 | 8788.5 |
| (K) | cm-2) | |
|---|---|---|
| 0 | 0.000 | |
| 2 | 15.635 | |
| 4 | 52.114 | |
| 6 | 109.430 | |
| 8 | 187.572 | |
| 10 | 286.526 | |
| TotalaaBased on Boltzmann Analysis for both 39 and 126 K |
| Wavelength Range (m) | 12CO Lines | Int. Time (min) | S/NaaS/N for the regions surrounding the applicable lines. | Standard Stars |
|---|---|---|---|---|
| 2.334-2.340 | R3, R4 and R5 | 25 | 90 | BS 6714, 7110 and 5 Aql |
| 2.340-2.346 | R0,1, and 2 | 25 | 90 | Spica |
| Transition | Rest Wavelength (m)aaMantz & Maillard (1974) | -value ()bbChackerian and Tipping (1983) | Equiv. Width (mÅ) |
|---|---|---|---|
| R0 | 2.34530523 | 8.78 | |
| R1 | 2.34326929 | 5.89 | |
| R2 | 2.34127497 | 5.33 | |
| R3 | 2.33932336 | 5.11 | |
| R4 | 2.33741273 | 5.00 | |
| R5 | 2.33554435 | 4.94 |
| (K) | cm | |
|---|---|---|
| 0 | 0 | |
| 1 | 5.532 | |
| 2 | 16.60 | |
| 3 | 33.19 | |
| 4 | 55.32 | |
| 5 | 82.98 | |
| Total |
| Species | (km s | (km s-1) | (cm | (K) | ccH H2 (cm-3) | |
|---|---|---|---|---|---|---|
| C2 | … | 1.25 | 39 and 126bb K component due to radiative pumping. | … | ||
| 13CO Em.aaCrutcher & Chu (1982) | 8 | … | … | … | ||
| 12CO | … | ddAssuming K, see Section 4.1 | … |
| Sightline | (cm-2)aaAll column densities derived from UV or IR absorption lines except where noted. | (cm-2)bbWhere appropriate, the column density for C2 has been adjusted to account for the new -value derived by Lambert, Sheffer, and Federman (1995). | CO/C2 | Cloud TypeccCloud Types: D – Diffuse, T – Translucent | ReferencesddReferences: 1 – McCall et al. (1998), 2 – Lutz & Crutcher (1983), 3 – Gredel, van Dishoeck, & Black (1994), 4 – Federman et al. (1994) and references therein, 5 – Lambert, Sheffer, & Federman (1995), 6 – Gredel et al. (1992), 7 – Federman et al. (1999) | |
|---|---|---|---|---|---|---|
| W40 IRS 1a | (18) | (14) | T | 7.5 – 12.5 | This Work | |
| Cyg OB2 #12 | 2(16) | (14) | D | 1, 2 | ||
| HD94413 | 0.7–1.2(16)eeFrom mm emission lines | 2.8(13) | 250–430 | T | 2.4 | 3 |
| HD154368 | 0.6–1.5(16)eeFrom mm emission lines | 4.6(13) | 130–330 | T | 2.5 | 3 |
| HD169454 | 0.55–1.8(16)eeFrom mm emission lines | 5.6(13) | 100–320 | T | 3.3 | 3 |
| Per | 1.1(15) | 1.8(13) | 60 | D | 0.9 | 4 |
| HD27778 | 2.5(16) | 3.0(13) | 830 | T | 1.2 | 4 |
| Oph A | 1.9(15) | 2.1(13) | 90 | T | 1.4 | 4,7 |
| Oph | 2.3(15) | (13) | 130 | D/T | 0.96 | 4 |
| 20 Aql | 3(15) | 4.2(13) | 71 | D/T | 0.99 | 4 |
| HD207198 | 2.6(15) | 2.4(13) | 110 | T | 1.9 | 4 |
| HD21483 | 1.0(18) | 7.4(13) | 100 - | T | 1.7 | 4 |
| Per | 1.2(15) | 2.8(13) | 43 | D/T | 1.0 | 4 |
| X Per | 5.0(15) | 4.2(13) | 120 | T | 1.4 | 4 |
| HD 26571 | 6.0(16) | 8.8(13) | 680 | D/T | 0.9 | 4 |
| AE Aur | 1.3(15) | 4.6(13) | 28 | T | 1.6 | 4 |
| HD110432 | 1.0(15) | 2.4(13) | 42 | T | 1.2 | 4 |
| Sco | 1.0(12) | D | 0.19 | 5 | ||
| Sco | 1.2(13) | D | 0.62 | 5 | ||
| Sco | 4.0(13) | D | 0.68 | 5 | ||
| Oph | 3.0(14) | 2.8(13) | 11 | T | 1.2 | 4 |
| 9 Cep | 1.7(13) | 1.0(13) | 2 | DffPossibly more than one cloud. | 1.5 | 4 |
| HD 210121 | 3.0(15)eeFrom mm emission lines | 5.2(13) | 58 | T (High Lat.) | 6 | |
| Cep | 1.4(15) | 1.4(13) | 100 | DffPossibly more than one cloud. | 1.8 | 4 |
Note. —