A DEEP AND ULTRA-DEEP ISOCAM COSMOLOGICAL SURVEY THROUGH
GRAVITATIONALLY LENSING CLUSTERS OF GALAXIES††thanks: ISO is an ESA
project with instruments funded by ESA Member States (especially the PI
countries: France, Germany, the Netherlands and the United Kingdom) and
with the participation of ISAS and NASA.
Abstract
We present imaging results and source counts from an ISOCAM deep and ultra-deep
cosmological survey through gravitationally lensing clusters of galaxies at
7 m and 15 m. A total area of about 53 sq.arcmin was covered in
maps of three clusters. The lensing increases the sensitivity of the survey.
A large number of luminous mid-infrared (MIR) sources were detected behind the
lenses, and most could be unambiguously identified with visible counterparts.
Thanks to the gravitational amplification, these results include the faintest
MIR detections ever recorded, extending source counts to an unprecedented
level.
The source counts, corrected for cluster contamination and lensing distortion
effects, show an excess by a factor of 10 with respect to the prediction of a
no-evolution model, as we reported for A2390 alone in
??. These results support the A2390 result that the
resolved 7 m and 15 m background radiation intensities are
(1.70.5)10-9 and (3.31.3)10-9
W m-2 sr-1 respectively, integrating from 30 Jy to 50 mJy.
Key words: ISO; infrared astronomy; gravitational lensing; galaxy clusters; number counts; morphology.
1. INTRODUCTION
Following the identification of the first cosmological gravitational lens by ?? the theoretical and observational exploitation of the lensing phenomenon developed rapidly. In 1987 luminous giant arcs were discovered in the fields of some galaxy clusters by ??, and independently by ??, and these were soon recognised to be Einstein rings (??). Since then observations of cluster-lenses have been extended to wavelengths other than the visible (e.g. ?? for the NIR, and ?? for the Sub-mm region). At the same time models describing the lensing have been refined (??) to the point where source counts made through a cluster lens can be corrected to yield the counts which would be found in the absence of the lens.
We report key results of a deep-survey programme, initiated almost a decade ago as part of the ′′Central Programme′′ of the ISO mission, and which has extended the exploitation of the gravitational lensing phenomenon to the Mid-infrared (MIR) for the first time by using ISOCAM (??) on ESA’s ISO spacecraft (??).
The programme achieved deep and ultra-deep (ISOCAM) imaging through a sample of gravitationally lensing clusters of galaxies, benefiting from the lensing to search for background objects to a depth not otherwise achievable. Lensing amplifies sources and, for a given apparent flux limit, suppresses confusion, due to the apparent surface area dilation. To the flux-limits of this sample, even rich foreground galaxy clusters are essentially transparent at 15 m.
2. OBSERVATIONS, DATA-REDUCTION AND DATA-ANALYSIS
2.1. Observations
We observed the fields of the well-known gravitationally lensing galaxy clusters Abell 370, Abell 2218 and Abell 2390. A total area of about 53 sq.arcminutes was covered. Table 1 lists the observational parameters of the survey which used CAM’s 6.7 m (LW2) and 14.3 m (LW3) filters. By employing the CAM 3 arcsec per-pixel field-of-view (PFOV) and raster step sizes which were multiples of 1/3 pixel, over many raster steps, we achieved a final mosaic pixel size of 1 arcsec. The diameter of the PSF central maximum is, in arcseconds, 0.84, and the FWHM is about half that. The final 1 arcsec pixel size improved source separation and allowed a better cross-identification with observations at other wavelengths. This strategy differs from many other CAM deep surveys which used the 6 arcsec per-pixel field-of-view. The 5 sensitivity limits are given in Table 1 and depend on the lensing cluster in question. These limits refer to apparent source brightness before correction for the effects of lensing. For the clusters observed, the highest-magnification regions of the lenses give amplifications of 5 to 10 - so with this method we could in principle make 5 detections in LW2 and LW3, of sources with intrinsic brigtnesses as low as 6Jy and 13Jy respectively, if any such faint background source falls in the regions of strongest lensing. Typical magnifications are about 2 over the central few square-arcmin of the clusters.
Lensing also causes a surface dilation effect over the area probed. This spatial dilation is stronger towards the core of the cluster and increases with source-plane redshift. These effects need to be corrected during analysis in order to compare results with blank sky counts (e.g. in the Hubble Deep field and Lockman Hole – ??; ??; ??; ??).
| FIELD | FILTER † | Readouts | Raster | Raster | dm | dn | area | depth | No. of times | Tot. time |
|---|---|---|---|---|---|---|---|---|---|---|
| per step | steps X | steps Y | arcsec | arcsec | (sq.arcmin) | 5Jy) | repeated | (sec.) | ||
| Abell 2390 | LW2 | 13 | 10 | 10 | 7 | 7 | 5.3 | 33 | 4 | 29300 |
| LW3 | 13 | 10 | 10 | 7 | 7 | 5.3 | 67 | 4 | 29300 | |
| Abell 2218 | LW2 | 14 | 12 | 12 | 16 | 16 | 16 | 2 | 22000 | |
| LW3 | 14 | 12 | 12 | 16 | 16 | 16 | 150 | 2 | 22000 | |
| Abell 370 | LW2 | 10 | 14 | 14 | 22 | 22 | 31.3 | 2 | 22688 | |
| LW3 | 10 | 14 | 14 | 22 | 22 | 31.3 | 330 | 2 | 22688 |
(*) in ??. () LW2 and LW3 filters have reference wavelengths 6.7 and 14.3 m, respectively.
2.2. Data reduction and analysis
The reduction of ISO faint source data is extremely challenging and many work-years have been invested in developing effective and reliable techniques. The ultimate performance is particularly sensitive to the effectiveness with which the detector’s global responsive transient and cosmic-ray-induced glitches can be removed from the data. Two substantially independent data reduction approaches were applied. These are described in detail in the ISOCAM Faint Source Report (?? - available on the ISO www page). We particularly refer to Sections 3.3 and 3.4 of that document, and related sections. Key techniques employed to perform photometry and to extract source-lists and sensitivity limits are described in Section 5 of the report and also in ??.
Detailed lensing models of the three clusters used have been produced by ?? and (1999), and ??. By correcting for the lens magnification and surface dilation effects, contamination by cluster galaxies (mainly at 7 m), and non-uniform sensitivity of our maps, we can derive number counts to compare with blank sky counts. The object density per flux bin was computed using magnification-dependant surface areas derived from the lensing models so dividing the maps into sets of sub-maps. The unreliable data at the boundaries of the maps were discarded.
3. RESULTS
In Section 2.1. the potential limiting sensitivity of this survey was described (6 and 13 Jy at 5 in LW2 and LW3 respectively). Achieving this potential is a matter of luck with respect to source distribution behind the lens. In practice, the faintest 15 m source detected was intrinsically an 18 Jy source amplified to 80 Jy (a 6 detection).
Fake-source simulations are described in ??, and show that our 80% completeness levels in LW3 (for which we report source counts here) before accounting for lensing are : 500, 250 and 100Jy for A370, A2218 and A2390, respectively. Our simulations for A370 and A2218 are still preliminary so their associated completeness levels may be adjusted slightly when the full analysis is finished. Lensing has a variable effect over the field so it is not possible to state a global completeness level after correction for lensing. Rather, we stopped counting at the 50% completeness flux level in the highest magnification bins we could use. This was an intrinsic 33 Jy at 15 m for A2390, corresponding to a 5 threshold for counting a source.
3.1. Cluster images at 15 m
Overlays onto visible images of ISOCAM LW3 (15 m) deep images through the three clusters can be found in figures 1, 2 and 3. (See also ?? for additional ISO data on A2218.)
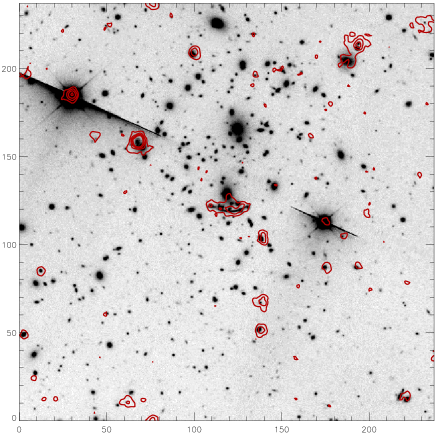
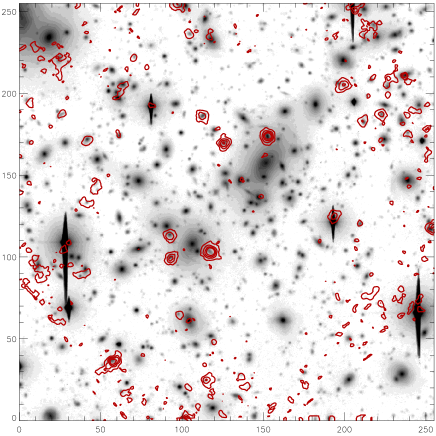
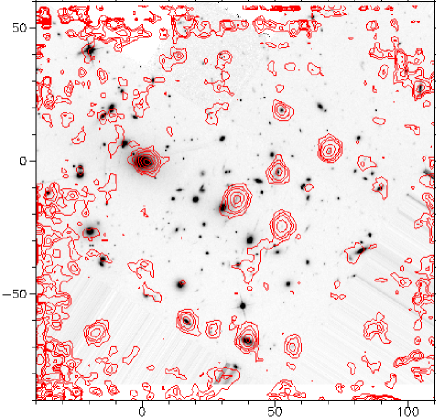
From these images we can remark that we generally do not see the optical arc(lets) at 15 m. We see a Large Number of MIR sources, shown from spectroscopic, photometric or lensing redshifts to be behind the lens. These are, in effect, IR arc(let)s.
Thanks to our high-resolution images we have been able to unambiguously identify 90% of sources with (sometimes extremely faint) counterparts in deep NIR and visual (HST/WFPC2 and ground-based) images. Spatial resolution is good enough to allow recognition of IR correlations with the visual morphology of objects. (E.g. The ISO detection peak matches the bright visual knot in the straight arc (??) near the centre of the A2390 map.)
We found that at 7 m about half the sources are cluster galaxies, the other half are lensed background sources. We infer that almost all 15 m sources are lensed background galaxies because most sources for which we have spectroscopic redshifts are, while the photometric and lensing-inversion redshifts for the remaining sources are consistent with locations beyond the cluster. This indicates that, at 15 m, the cluster-core becomes transparent, similar to the Sub-mm case (??).
Some ISO targets have extremely red optical and NIR colours. It appears that 15 m imaging favours selection of star-forming galaxies and dusty AGNs that are not evident in UV/optical surveys.
3.2. Number counts and source properties
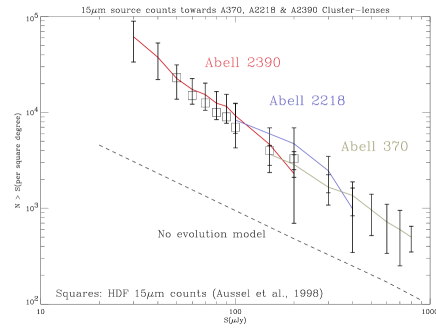
We have extracted 15 m source counts for the three clusters taking only 5 detections into account for statistical studies. The analysis performed for A370 and A2218 is provisional, and is being refined. It is expected, however, that the final results will differ only in detail. We find a total of 71 sources within our survey area (see Table 1), with 30, 23 and 18 from A2390, A2218 and A370 respectively.
The 15 m counts show a steadily increasing excess by a factor of order 10 over no-evolution models (see Figure 4, and ??). These results confirm the Lockman hole result of ??, and agree with the HDF counts of ??. There is no sign of flattening of the counts at the faintest levels. The slope stays close to -1.5 0.3 down to the 30 Jy limit. These source densities favour extreme evolution models.
Integrating the number counts over our A2390 flux range (30 Jy to 200 Jy) and over other ISOCAM surveys (??) up to 50 mJy we find that the resolved background light is and W m-2 sr-1 at 15 m and 7 m, respectively. The 15m lower limit is close to the upper limit from the gamma-CMBR photon-photon pair production (??).
4. CONCLUSIONS
The method of looking through gravitational lenses served to extend ISO coverage of background sources to the deepest levels, especially at 15 m. The results suggest that abundant star formation occurs in very dusty environments at z1. Caution must be employed to take account of the effects of dust in inferring global star formation history from UV or optical luminosities of high-z galaxies. We will present a more complete description of these MIR observations, including 7 m and 15 m photometry. in a forthcoming paper (??). A detailed study of the optical properties of the MIR galaxies may reveal the nature of the evolving or new population of luminous IR sources.
ACKNOWLEDGMENTS
The ISOCAM data presented in this paper was analysed using “CIA”, a joint development by the ESA Astrophysics Division and the ISOCAM Consortium. The ISOCAM Consortium is led by the ISOCAM PI, C. Cesarsky, Direction des Sciences de la Matiere, C.E.A., France.
References
-
Altieri et al. 1998
Altieri, B., Metcalfe, L., Ott, S. et al. 1998,
http://www.iso.vilspa.esa.es/users/
expl_lib/CAM_list.html
- Altieri et al. 1999 Altieri, B., Metcalfe, L., Kneib, J-P. et al. 1999, A&A, in press, astro-ph/9810480
- Aussel et al. 1998 Aussel, H., Cesarsky, C.J., Elbaz, D., Starck, J.-L. 1998, A&A in press, astro-ph/9810044
- Barvainis et al. 1999 Barvainis., R., Antonucci R., Helou., G. 1999, in preparation.
- Bezecourt et al. 1999 Bezecourt., J., Kneib, J.-P., Soucail, G., Ebbels, T. 1999, submitted to A&A, astro-ph/9810199
- Cesarsky et al. 1996 Cesarsky, C.J., Abergel, A., Agnese, P. et al. 1996, A&A 315, L32
- Elbaz et al. 1998 Elbaz, D., Aussel, H., Cesarsky, C. J. et al., 1998, Proc. of 34th Liege Int. Astr. Coll. on the NGST, astro-ph/9807209
- Franceschini et al. 1994 Franceschini, A., Mazzei, P., De Zotti, G., Danese, L. 1994, ApJ 427, 140
- Kessler et al. 1996 Kessler, M.F., Steinz, J.A., Anderegg, M. et al. 1996, A&A 315, L27
- Kneib et al. 1996 Kneib, J-P., Ellis, R.S., Smail, I., Couch, W.J., Sharples, R.M. 1996, ApJ 471, 643
- Kneib et al. 1999 Kneib, J-P., et al. 1999, in preparation
- Lynds and Petrosian 1986 Lynds, R., Petrosian, V. 1986, Bull. Am. Astr. Soc. 18, 1014
- Metcalfe et al. 1999 Metcalfe, L., et al. 1999, in preparation
- Paczynśki 1987 Paczynśki, B. 1987, Nat 325, 572
- Pelló et al. 1991 Pelló, R., LeBorgne, J.F., Soucail, G., Mellier, Y., Sanahuja, B., 1991, ApJ 366, 405
- Rowan-Robinson et al. 1997 Rowan-Robinson, M., Mann, R., Oliver, S. et al. 1997, MNRAS 289, 490
- Smail et al. 1993 Smail, I., Ellis, R., Aragoń-Salamanca, A. et al. 1993, MNRAS 263, 628
- Smail et al. 1997 Smail, I., Ivison, R.J., Blain, A.W. 1997, ApJ 490, L5
- Soucail et al. 1987 Soucail, G., Mellier, Y., Fort, B., Mathez, G., Cailloux, M. 1987, The Messenger, 50, 5
- Stanev and Franceschini 1997 Stanev, T., Franceschini, A. 1997, ApJ 494, L159
- Taniguchi et al. 1997 Taniguchi, Y., Cowie, L., Sato, Y. et al. 1997, A&A, 328, L9
- Young et al. 1980 Young, P., Gunn, J.E., Oke, J.B., Westphal, J., Kristian, J. 1980, ApJ 241, 507