The M31 population of supersoft sources
Abstract
The 1991 ROSAT PSPC M31 X-ray point source catalog has been screened in order to set up a sample of candidate supersoft sources in this galaxy, additional to the 16 supersoft sources already known in M31 (Supper et al. 1997). Selection criteria used were based on hardness ratios (“X-ray colors”), as developed in an earlier paper (Kahabka 1998). An additional criterion to be fulfilled was that the observed count rate is in agreement with the expected steady-state luminosity for a source with these hardness ratios. This condition constrained mainly the hydrogen absorbing column towards the source. 26 candidates not correlating with foreground stars and M31 supernova remnants have been found to fulfil one of the selection criteria. They can be considered to be candidate supersoft sources in M31. This comprises 6% of all point sources in this galaxy. For these candidates absorbing hydrogen column densities, effective temperatures and white dwarf masses (assuming the sources are on the stability line of surface nuclear burning) are derived. An observed white dwarf mass distribution is derived which indicates that the masses are constrained to 0.90 .
The entire population of supersoft sources in M31 is estimated taking a theoretical white dwarf mass distribution into account and under the assumption that the observationally derived sample is restricted to white dwarf masses above . Taking into account that the gas and the source population have different scale heights a total number of at least 200-500 and at most 6,000-15,000 sources is deduced (depending on the used galaxy model), making use of the population synthesis calculation of Yungelson (1996).
The spatial distribution favors a disk (or spiral-arm) dominated young stellar population with a ratio of 1/(4-7) of bulge/disk systems, very similar to what has been found for novae in the Milky Way but lower than favored for novae in M31 (1/2). Supersoft sources and Cepheids both show association with the M31 spiral arms and may belong to a younger stellar population. A mean space density of is inferred for the supersoft sources. Assuming that all supersoft sources with masses in excess of are progenitors of supernovae of type Ia, a SN Ia rate of is derived for M31 based on these progenitors. Supersoft sources might be able to account for 20-100% of the total SN Ia rate in a galaxy like M31.
Key Words.:
galaxies:individual:M 31 – binaries:close – X-rays:stars – stars:evolution – white dwarfs1 Introduction
Supersoft sources constitute an interesting new class of X-ray binary sources (cf. van den Heuvel et al. 1992). This is due to the fact that their spectra are extremely soft (effective temperatures of a few ) and their luminosities are substantial (). They thus can not only be studied in the Milky Way and the near-by Magellanic Clouds (LMC and SMC) but also in more distant galaxies (the Andromeda galaxy M31 and the spiral galaxy NGC 55). For a review see Hasinger (1994), Kahabka & Trümper (1996) and Kahabka & van den Heuvel (1997), see also Greiner (1996). They are considered to be at least one class of progenitors of type Ia supernovae (cf. Branch et al.1995, Livio 1996, Li & van den Heuvel 1997, Yungelson & Livio 1998, and Branch 1998).
In this article the observed sample of supersoft sources in the Andromeda galaxy (M31) is studied. A distance of 700 kpc is adopted (slightly different distances of 690 and 725 kpc are used in other literature). The inclination of the galaxy is 77.5o. The inner “apparent bulge” has a radius of 3 kpc and the bulge is truncated at a radius of 6.4 kpc. The disk extends to a radius of 20 kpc (Hatano et al. 1997). First a number of candidate supersoft sources in M31 is derived from the 1991 X-ray point source catalog (retrieved from CDS via anonymous ftp 130.79.128.5) making use of the hardness ratios (“X-ray colors”) HR1, HR2 and the count rate information.
For the 26 candidates a hydrogen column () distribution and a white dwarf mass distribution is derived assuming non-LTE white dwarf atmosphere spectra. The observationally derived white dwarf mass distribution is compared with the mass distribution predicted from population synthesis calculations and the number of the population is corrected accordingly. The observationally derived distribution is compared with a galaxy scale height distribution and the population is corrected accordingly. This allows to constrain the whole active population distributed over the whole galaxy. Assuming objects with masses (and respectively) contribute as progenitors of type Ia SNe and explode after an evolutionary time scale of a SN Ia rate is derived for M31 from this population. This rate is compared with the total M31 SN Ia rate.
2 The sample of supersoft sources in M31
2.1 The SW-sample
15 firm candidate supersoft sources have been found in the 1991 ROSAT PSPC observations of M31 by Supper et al. (1997), cf. Greiner, Supper & Magnier (1997) by applying to the ROSAT PSPC hardness ratio HR1 which is defined as
| (1) |
with S = counts in channel 11-41 (roughly 0.1-0.4 keV), H = counts in channel 52-201 (roughly 0.5-2.1 keV). The selection criterion for a supersoft source is:
| (2) |
A 16-th supersoft source, a recurrent transient has been discovered by White et al. (1994). We call this sub-sample of 16 sources the Supper-White (SW) sample.
It has been shown by Kahabka (1998) that the individual spectral parameters giving information on the white dwarf masses of these 16 M31 supersoft sources can be constrained if the ROSAT PSPC hardness ratios HR1 and HR2 and the count rate as given in the catalog of Supper et al. (1997) are taken into account. The definition of HR2 is
| (3) |
with H1 = counts in channel 52-90 (roughly 0.5-0.9 keV), H2 = counts in channel 91-201 (roughly 0.9-2.0 keV). The hardness ratios HR1 and HR2 and the count rates have been compared with theoretical values derived using non-LTE white dwarf atmosphere spectra. As a result we found that for all these 16 sources the white dwarf masses were quite large .
In the present work non-LTE models of white dwarf atmospheres are used (Hartmann, private communication) extending to effective temperatures as low as . Absorbing hydrogen columns and effective temperatures have been determined in a - plane from the overlap of the 90% confidence parameter regions as determined from the HR1, HR2 and count rate constraints in that plane. In order to calculate the HR1-effective temperature planes somewhat reduced errors (0.85 errors) have been used. This has the effect of bounding the hydrogen column to which is consistent with a minimum due to the galactic foreground column. In Table 1 values are given for the SW-sample taking these new constraints into account. These values differ only slightly from those derived in Kahabka (1998). Count rates are given for the broad (0.1-2.4 keV) band. It should be noted that although the standard deviations for some sources are very large (which might suggest that these sources are not detected significantly) all these sources have been detected significantly in the soft (0.1-0.4 keV) band (see Table 5 of Supper et al. 1997). The high standard deviations in the 0.1-2.4 keV band are due to the fact that in this band most of the counts are background ones from the 0.4-2.4 keV range.
White dwarf masses are determined under the assumption that the source is on the stability line of surface hydrogen burning (cf. Iben 1982). The source may even be on the plateau of the Hertzsprung-Russell diagram with radius expansion. Then its mass would be even larger. This method has been applied to the Beppo-SAX observation of CAL87 and CAL83 and reasonable white dwarf masses of and have been derived respectively (Parmar et al. 1997, 1998).
2.2 The complimentary sample (C-sample)
The SW sample cannot be complete as it has been shown that supersoft sources are expected to cover a much wider range in HR1 (Kahabka 1998). Actually all values of HR1 in the range are possible in case the hottest (most massive) and more strongly absorbed () sources are included. Sources lying deep inside the galaxy disk or even located below the galaxy disk are expected to be at least in part even more strongly absorbed and are not covered by the selection criterion used for the SW sample. It may well be that part of this population is detectable but in order to investigate this point the calculations of model atmosphere spectra have to be extended to values in excess of the present upper bound of .
| Source name | rate | HR1 | HR2 | Supper | Remark | ||||
| ( | ( | () | () | Cat./Id. | |||||
| the SW-sample | |||||||||
| SWa | RX J0037.4+4015 | 0.310.31 | -0.930.31 | 0.020.71 | 1.4-1.7 | 3.7-4.3 | 0.92-0.98 | 3 | [3,H] |
| SWb | RX J0038.5+4014 | 0.800.28 | -0.920.08 | -0.490.53 | 1.2-1.8 | 3.7-4.5 | 0.92-1.00 | 12 | [1,H] |
| SWc | RX J0038.6+4020 | 1.730.29 | -0.930.06 | 0.320.66 | 1.1-1.4 | 4.0-4.6 | 0.96-1.02 | 18 | [3,H] |
| SWd | RX J0039.6+4054 | 0.440.44 | -0.920.02 | -0.040.71 | 1.3-1.6 | 3.9-4.4 | 0.94-0.99 | 39 | [2,H] |
| SWe | RX J0040.4+4009 | 0.850.32 | -0.940.06 | -0.900.10 | 1.2-1.6 | 3.6-4.4 | 0.94-0.99 | 78 | [1,H] |
| SWf | RX J0040.7+4015 | 1.260.32 | -0.940.06 | -0.310.64 | 1.1-1.5 | 3.7-4.5 | 0.92-1.00 | 88 | [2,H] |
| SWg | RX J0041.5+4040 | 0.320.18 | -0.950.05 | -0.620.44 | 1.4-1.9 | 3.4-4.1 | 0.90-0.96 | 114 | [1,H] |
| SWh | RX J0041.8+4059 | 0.490.24 | -0.930.07 | -0.630.43 | 1.3-1.9 | 3.6-4.4 | 0.92-0.99 | 128 | [1,H] |
| SWi | RX J0042.4+4044 | 1.690.32 | -0.930.07 | -0.070.70 | 1.0-1.4 | 3.8-4.6 | 0.94-1.02 | 171 | [2,H] |
| SWj | RX J0043.5+4207 | 2.150.55 | -0.920.08 | -0.270.66 | 1.0-1.4 | 3.9-4.8 | 0.95-1.03 | 245 | [1,H] |
| SWk | RX J0044.0+4118 | 2.460.42 | -0.940.06 | 0.110.81 | 0.9-1.3 | 3.9-4.7 | 0.95-1.02 | 268 | [3,H] |
| SWl | RX J0045.5+4206 | 3.140.34 | -0.890.07 | -0.290.65 | 1.0-1.3 | 4.4-4.9 | 0.99-1.04 | 309 | [2,H] |
| SWm | RX J0046.2+4144 | 2.150.39 | -0.930.07 | 0.62.40 | 1.2-1.7 | 3.8-4.7 | 0.94-1.02 | 335 | [2,H] |
| SWn | RX J0046.2+4138 | 1.120.40 | -0.910.09 | -0.270.65 | 1.0-1.4 | 3.8-4.7 | 0.94-1.02 | 341 | [2,H] |
| SWo | RX J0047.6+4205 | 1.050.36 | -0.920.07 | 0.060.70 | 1.6 | 4.0 | 1.03 | 376 | [3] |
| SWt | RX J0045.4+4154 | 29.61.0 | +0.780.03 | -0.590.03 | 4.0-4.2 | 8.4-8.5 | 1.26-1.27 | [2,H] | |
| complimentary sample to the SW-sample (C-sample) | |||||||||
| C17 | RX J0039.7+4030 | 2.030.30 | -0.850.10 | -0.830.53 | 1.2-1.6 | 4.4-4.9 | 0.99-1.04 | 45 | [1,H] |
| C18 | RX J0047.0+4201 | 0.900.33 | -0.840.22 | -0.730.30 | 0.8-2.1 | 3.2-4.6 | 0.87-1.01 | 358/a | [1] |
| C19 | RX J0043.9+5148 | 1.290.36 | -0.380.24 | -0.870.40 | 1.8-3.4 | 4.6-5.3 | 1.01-1.06 | 259 | [1,H] |
| C20 | RX J0040.5+4034 | 1.300.30 | -0.370.23 | -0.680.29 | 1.8-3.4 | 4.6-5.3 | 1.01-1.06 | 82/a | [1] |
| C21 | RX J0041.8+4015 | 3.180.58 | -0.350.14 | -0.630.27 | 1.7-2.2 | 5.0-5.4 | 1.04-1.07 | 129 | [2,H] |
| C22 | RX J0047.0+4157 | 1.790.43 | -0.140.24 | -0.770.22 | 2.2-4.0 | 5.0-5.9 | 1.04-1.11 | 356/a | [1,H] |
| C23 | RX J0039.4+4050 | 2.930.36 | -0.050.12 | -0.360.16 | 2.6-3.3 | 5.5-5.9 | 1.08-1.11 | 35 | [2,H] |
| C24 | RX J0044.4+4200 | 1.170.31 | 0.160.30 | -0.580.24 | 3.5-5.4 | 5.3-6.5 | 1.06-1.15 | 280 | [2,H] |
| C25 | RX J0043.7+4127 | 1.120.32 | 0.210.40 | -0.440.33 | 3.2-7.0 | 5.2-7.0 | 1.11-1.21 | 252 | [2,H] |
| C26 | RX J0042.8+4115 | 40.141.06 | 0.280.02 | -0.180.03 | 1.4-1.5 | 7.4-7.5 | 1.21-1.22 | 208/* | [2,H] |
| C27 | RX J0040.0+4100 | 2.040.32 | 0.330.17 | -0.270.17 | 4.1-5.2 | 6.1-6.7 | 1.12-1.17 | 58 | [2,H] |
| C28 | RX J0042.2+4048 | 0.580.24 | 0.360.50 | -0.720.45 | 4.0-10 | 4.5-7.2 | 1.10-1.20 | 156 | [1] |
| C29 | RX J0046.3+4238 | 3.100.64 | 0.370.24 | -0.320.20 | 3.4-6.0 | 6.1-7.2 | 1.12-1.20 | 342 | [2,H] |
| C30 | RX J0045.4+4219 | 1.190.33 | 0.390.32 | -0.520.28 | 4.6-5.8 | 5.9-6.9 | 1.11-1.18 | 307 | [2,H] |
| C31 | RX J0043.4+4118 | 6.860.62 | 0.480.08 | -0.360.09 | 3.6-4.2 | 6.9-7.2 | 1.18-1.20 | 240/e | [3] |
| C32 | RX J0043.3+4120 | 6.740.62 | 0.490.08 | -0.640.09 | 3.8-4.4 | 6.9-7.2 | 1.18-1.20 | 235 | [2,H] |
| C33 | RX J0045.2+4136 | 2.440.45 | 0.490.24 | -0.410.19 | 4.2-6.4 | 6.3-7.4 | 1.14-1.21 | 297/e | [2] |
| C34 | RX J0039.7+4039 | 0.870.23 | 0.500.35 | -0.650.23 | 4.8 | 5.9 | 1.11 | 44/a | [1] |
| C35 | RX J0046.1+4136 | 0.250.25 | 0.510.48 | -0.740.27 | 3.0 | 6.0 | 1.12 | 330 | [1] |
| C36 | RX J0043.6+4126 | 2.400.38 | 0.550.20 | -0.770.13 | 4.5-6.7 | 6.5-7.5 | 1.15-1.21 | 249/e | [1] |
| C37 | RX J0040.1+4021 | 0.460.19 | 0.620.33 | -0.780.28 | 6.8 | 6.0 | 1.12 | 62 | [1] |
| C38 | RX J0042.6+4043 | 1.550.31 | 0.630.22 | -0.970.18 | 5.6 | 6.4 | 1.14 | 185 | [1] |
| C39 | RX J0042.9+4059 | 0.900.28 | 0.640.31 | -0.710.25 | 5.3 | 6.3 | 1.14 | 212/e | [1] |
| C40 | RX J0047.6+4132 | 0.320.32 | 0.750.26 | -0.850.70 | 4.4 | 7.0 | 1.19 | 374 | [1] |
| C41 | RX J0042.6+4159 | 1.750.82 | 0.850.14 | -0.680.25 | 4.4 | 7.4 | 1.21 | 183 | [1] |
| C42 | RX J0044.2+4026 | 0.070.07 | 0.890.13 | -0.840.16 | 5.0 | 8.0 | 1.24 | 271 | [1] |
Remarks: quality flag [1] = full overlap of HR1, HR2, CPS contours, [2] = medium overlap of HR1 and CPS contours and overlap of HR2 contours considering uncertainties, [3] = full overlap of HR1 and CPS contours but no overlap of HR2 contour possibly due to source confusion in the hard band for the SW-sample of supersoft sources in M31 (Supper et al. 1997, White et al. 1994, cf. Greiner, Magnier & Hasinger 1997) and for the C-sample, [H] = histogram flag, entry in -histogram, sources identified as (a) or (e) have no entry in the black histogram, index and tentative identification from the Supper (1997) catalog (a = foreground star, e = SNR, * = bulge source).
The SW-sample per definition has no correlation with either a foreground star nor a supernova remnant. We define a complementary sample (the C-sample) as the sample covering a much wider range of candidates fulfilling the conditions:
| (4) |
The C-sample comprises 26 objects and is given in Table 1. It turns out to contain 4 objects correlating with foreground stars and 4 with supernova remnants. If all identifications are correct then this sample reduces to 18 objects. We introduce quality flags (1=high, 2=medium and 3=low) to qualify the overlap of the HR1, HR2 and count rate constraints in the -plane. “high” means that all three contours overlap, “medium” means that the HR1 and the count rate contour overlap and the HR2 contour overlap within 3-, “low” means that the HR1 and the count rate contour overlap and the HR2 contour does not overlaps within 3-. Especially objects C31 and C33 which have quality flags L and M respectively and correlate with SNRs may be discarded. Object C36 shows the characteristics of a perfect candidate (all the H1, H2 and CPS contours overlap) and a correlation with a SNR may be by chance. C18, C20, C22 and C34 correlate with foreground stars but show contour overlap. If they are indeed stars then their temperatures must be very low (possibly M stars).
A discussion of the individual candidate sources of the C-sample is beyond the scope of this article. Interestingly source C26 is located in the bulge of M31 and (if the classification is correct) could harbor a very massive white dwarf very similar to the SWt transient (cf. Table 1). This source may be recurrent or/and very luminous. The latter point is confirmed by the high detected count rate of (cf. the SWt transient has a very similar count rate of ).
3 Estimating the total population
In the work of DiStefano & Rappaport (1994) a population of supersoft sources has been derived e.g. for the M31 galaxy by making certain assumptions about their spatial distribution, temperature and luminosity distribution. Here the work of DiStefano & Rappaport can be significantly extended as the sample derived from the observations has been enlarged significantly and a white dwarf mass distribution and a hydrogen column density distribution is derived for this sample.
3.1 The observation derived distribution
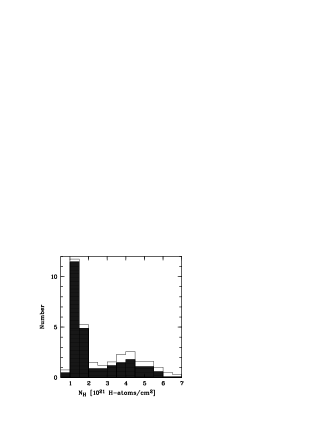
In Figure 1 the distribution of supersoft sources from Table 1 with well determined values is shown as a histogram. Each source is distributed with fractional numbers into a number of bins determined by the uncertainty of the value of given in Table 1. Errors for these fractional numbers have been calculated in the following way. Distribution of the same fractional numbers in a range of bins which is twice as large (twice the error) reduces the fractional number per bin by a factor of 2. Therefore we used 0.5 the fractional value per bin as the error per bin. Two histograms are given. The white histogram comprises all sources (i.e. 32) for which the could be constrained reasonably well, the black histogram comprises objects (i.e. 26) not coinciding with foreground stars or M31 supernova remnants. The fact that for a comparatively large sample of 26 objects hydrogen column densities can be inferred allows to probe their spatial distribution in the galaxy disk assuming a simple scale height law like an exponential law. This method allows not only to probe their distribution but also to derive a mean scale height of the detectable population. It might well be required to extend this analysis to much larger values in excess of in order to cover the more deeply embedded objects. We extended our calculations to absorbing column densities as high as and applied them e.g. to the source with the catalog index 156 (cf. Table 1). We find that this source is consistent to be highly absorbed (), the total column density of the M31 disk at that location is .
3.2 The derived white dwarf mass distribution
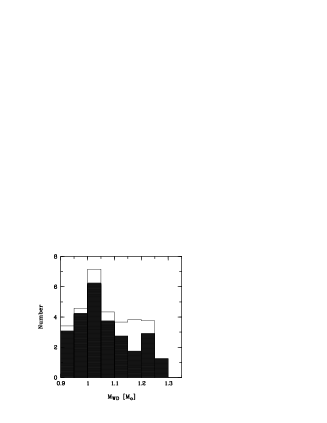
Deriving a mass distribution of a galaxy population is by far not trivial. In case of white dwarfs in supersoft sources it appears to be possible to derive reliable estimates of the masses using certain assumptions which have to be shown in later work to be correct or at least not completely unreasonable (cf. discussion in Kahabka 1998). From the numbers in Table 1 a mass distribution has been set up (cf. Figure 2). Each source is distributed with fractional numbers into a number of bins determined by the uncertainty of the value of given in Table 1. The histogram comprises all objects (i.e. 26) not coinciding with foreground stars or M31 supernova remnants for which the mass could be constrained reasonably well. The figure shows that only objects with masses in excess of can be detected which is in agreement with the expected detection limit in ROSAT PSPC count rates for the used exposure time of the observations (cf. Kahabka 1998). The reason is simply that for lower white dwarf masses the X-ray luminosities ate too low to be detectable.
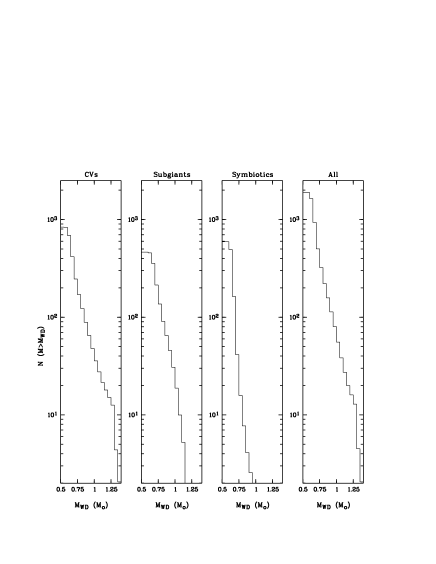
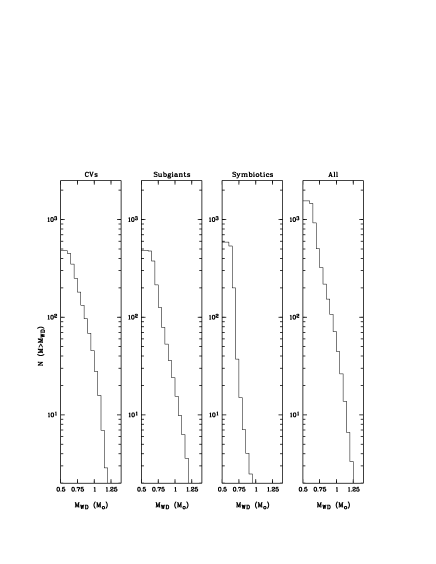
In Figure 3 the cumulative number distribution of white dwarfs in supersoft sources with masses is given as deduced for the Milky Way in the calculations of Yungelson et al. (1996) for the - and the hydrogen-burning shell approximation. is the time it takes the white dwarf to decline by 3 magnitudes in its bolometric luminosity. Four distributions of supersoft sources are given for each approximation, the distribution of the CV class, the subgiant, symbiotic class and the total distribution. The total distributions have been used in our further discussion, e.g. to derive from the observed white dwarf distribution the predicted total distribution. In the approximation 113 (out of 1895) objects are expected to be seen in the Milky Way with white dwarf masses in excess of after correction for the limited visibility due to the constraint and about 226 and objects in the twice as large M31 galaxy (see section 3.3). In the hydrogen-burning shell approximation 107 (out of 1553) objects are expected to be seen in the Milky Way with white dwarf masses in excess of after correction for the limited visibility due to the constraint and about 214 objects in the twice as large M31 galaxy. If one assumes that one is complete for masses in excess of then the observed number of 4 systems (cf. Figure 2) would give a total population of 500 in the approximation and a total population of 2000 in the hydrogen-burning shell approximation (as 16 for a population of 1895 are predicted in the and 3.3 for a population of 1553 in the hydrogen-burning shell approximation). The number of the total population deduced from the first approximation appears somewhat small for the M31 galaxy.
3.3 Correcting for the and distribution
Using the observationally derived and distribution one can, by comparing with the predicted distributions infer a total number of the population.
In a simple approach a double exponential description as e.g. introduced in DiStefano & Rappaport (1994) can be used to describe the source and the distribution. The scale height of the source distribution is assumed to be different from the scale height of the distribution . Expressing the density distribution of the gas and hence the distribution as
| (5) |
where z is the distance from the galaxy plane, the gas density, and the gas (roughly the hydrogen) column density at the base of the galaxy disk and expressing the source distribution as
| (6) |
with the integrated (total) number of sources in the upper hemisphere of the galaxy disk (half of the total population) and the exponential scale height of the source population, then one gets from Equation 5
| (7) |
Then Equation 6 can be reduced to
| (8) |
Setting
| (9) |
and
| (10) |
then Equation 8 reduces to
| (11) |
Equations 8 and 11 give the expected number of sources (above the galaxy disk) and within the normalized interval . From the distribution of observed numbers per interval the scale height ratio can be derived (as well as the total number of the population ). This distribution has a powerlaw behavior with slope (h-1). If the slope of the source distribution equals the slope of the gas distribution then the scale height ratio is . The scale height for the gas may be in the range 150-600 pc for the M31 galaxy (cf. Braun 1991).
4 Constraining the scale height ratio and the total population from the normalized histogram
We now will derive from Equation 11 the total population of supersoft sources in M31 and the scale height of this population with respect to the scale height of the M31 gas. In a first step we define the models used for the M31 gas, in a second step we derive the scaled distribution and in a third step we apply a least-square fit to the scaled distribution.
4.1 Possible -models
From Equation 8 follows that the scaled distribution has to be considered in order to derive the relative scale height of the source distribution and the total number of the population. We now discuss two possible models for the -distribution: a schematic one by Supper (1997) and a detailled based on radio observations.
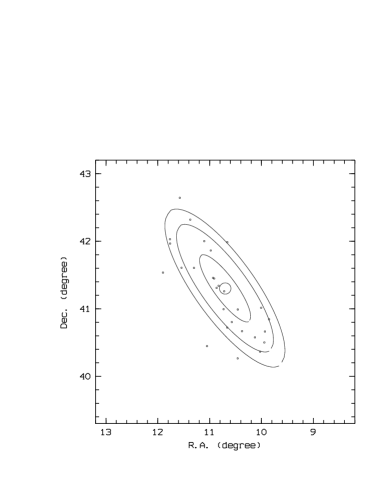
4.1.1 the Supper- model
In a first approach we use the galaxy model given in Figure 12 of Supper (1997). The galaxy is divided into 3 concentric ellipsoids covering the disk and one circle at the central bulge. The positions of the candidate supersoft sources have been projected onto the galaxy disk (cf. Figure 4). The disk of M31 may be warped and flaring at the outer part (cf. Evans et al. 1998). Such a warping and flaring of the M31 disk may affect the scale height assumptions of those supersoft sources which are found in annulus III of the -model of Supper (1997). This point deserves further investigation (cf. the galactocentric dependence of a galaxy scale height given by Evans et al. 1998 for the M31 disk, cf. also Braun, 1991).

4.1.2 the Urwin- model
As a more refined model for the distribution in M31 the Urwin (1980) model is used. The radial distribution of the hydrogen column is calculated from the profile given in Figure 8 of Urwin (1980) making use of the equation given in Dickey & Lockman (1990)
| (12) |
with the brightness temperature , the integral is over the velocity profile. With an inclination of of the galaxy a maximum column density of is derived for the NE HI profile and a maximum of for the SW profile. The HI profile (not corrected for inclination) as determined from Equation 12 with taken from Figure 8 of Urwin (1980) is shown in Figure 5.
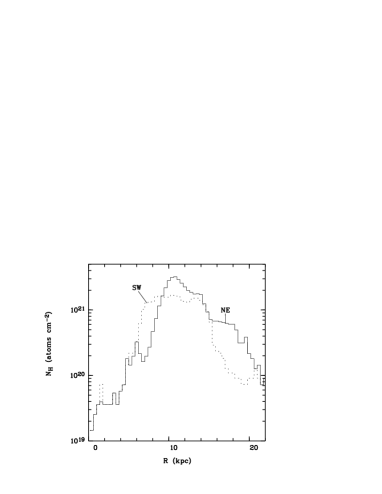
We do not take molecular hydrogen into account. We just mention that a value of has been measured at the location RA (1950) = , Decl (1950) = due to molecular hydrogen (cf. Urwin 1980, page 257).
4.2 Expected incompleteness of coverage as a function of hydrogen column density and white dwarf mass
In Kahabka (1998) the theoretically expected source count rate has been derived at the distance of M31 from non-LTE white dwarf atmosphere models (model M4) for white dwarf masses in the range under the assumption the source is on Iben’s stability line of surface hydrogen burning (cf. Iben 1982). We extended these calculations (model M5) to white dwarf masses as low as (cf. section 2.1). Taking the theoretical white dwarf mass distribution derived by Yungelson (1996) into account a number/count rate diagram was calculated as a function of the hydrogen column. The result is given for models M4 and M5 in Figure 6. From this diagram the completeness correction factor as a function of the hydrogen column has been derived making the following assumption. The X-ray survey of M31 by Supper (1997) is according to Fig. 13 of Supper complete for ROSAT PSPC count rates . From our Fig 6 the fractional number of sources seen for a specific hydrogen column assuming a cut-off count rate of is derived. This fraction is equal to 1.0 for hydrogen columns . The inverse of this fraction has been used as the correction factor to derive the completeness corrected normalized histogram making use of the specific galaxy model. Making e.g. use of the Supper galaxy model it follows that for all annuli of the galaxy ellipse (including the bulge) completeness is not guaranteed and the lower hemisphere population is only partially seen. This agrees with the rather small fraction of 0.22 of the total galaxy population found for i.e. at the other side of the midplane of the disk of M31. From Figure 6 it becomes clear that for only candidates with masses are detectable. This means adding the mean foreground of in Supper’s model annulus III is opaque for the lower hemisphere population with but the bulge and annulus II are transparent for somewhat less massive white dwarfs ().
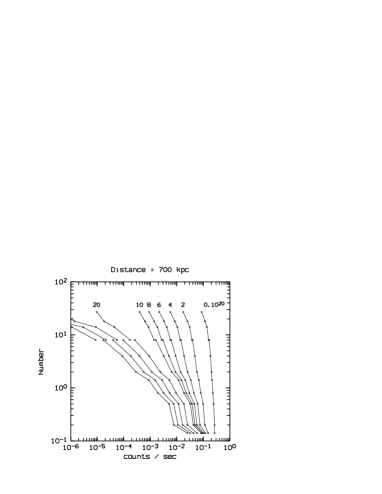
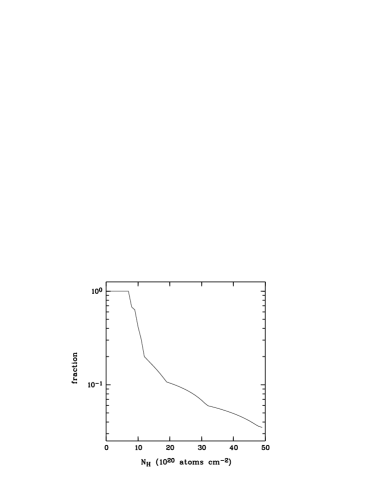
Making use of the number/count rate distribution derived from model M4 and M5 the fraction of objects seen for different hydrogen columns has been calculated and the result is given in Figure 7. This fraction is equal to 1.0 for columns below , which means completeness is fulfilled, and decreases for increasing columns.
4.3 Number of supersoft sources expected for the Supper- model
The scaled values have been derived making use of the ranges given in Table 1, deriving the local values from the Supper model and by applying the completeness correction. The scaled histogram is plotted in Figure 8. This distribution extends from n=0 to n=2 and comprises both hemispheres of the galaxy. It turns out that of the 18 sources in the distribution 22% (4 of 18) fall below the galaxy disk. This may not be unexpected as the masses and hence temperatures of the white dwarfs involved are substantial and the total of the galaxy disk is only in one ellipse large enough (i.e. ) to hide the lower hemisphere population nearly completely.
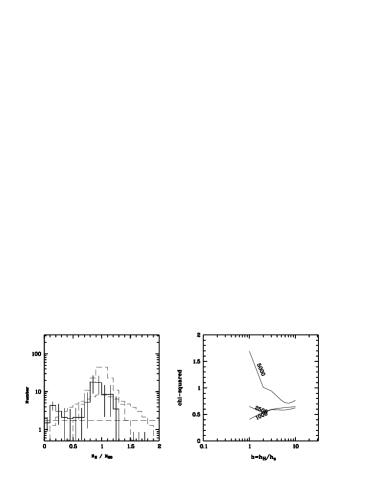
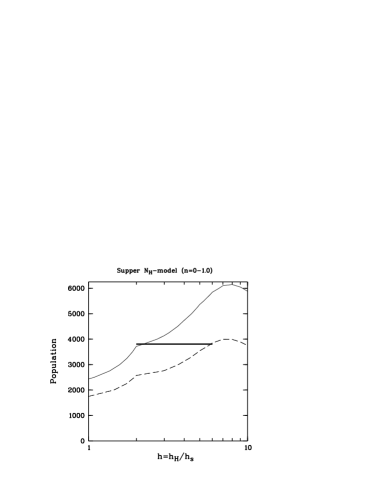
The total population can be inferred with Equation 11. Using the number of the corrected population above and below the galaxy disk of 80 (which is uncertain in the range 30-130 considering the errors, cf. Figure 8) and assuming that only a fraction of 6.0% of the whole population in the and of 6.9% in the hydrogen-burning shell approximation is covered as only objects with white dwarf masses in excess of 0.90 are detected a total population of 1300 (500-2200) and 1200 (430-1900) respectively is derived for the Andromeda galaxy. These numbers are consistent with the range of 800-5000 supersoft sources predicted from the population synthesis calculations of DiStefano & Rappaport (1994). The distribution would be consistent to be centered at . This fits with a disk population of a scale height significantly smaller than the gas scale height. A scale height ratio can be constrained from this histogram. This means the scale height of the source distribution can be determined with Equation 9 if the scale height of the gas distribution is known. As a function of galactocentric radius varies from 150 pc to 600 pc (Braun 1991). A chi-squared fit has been applied to the normalized distribution. The result of a chi-squared fit of Equation 11 to the distribution given in Figure 8 is given in Figure 9. The range of the population follows from the chi-squared fit to the measured distribution taking the errors into account. A total population of 1,800-5,800 sources is obtained for h-values 1h6, which means for a source population which is more confined to the galaxy disk than the gas distribution. If there is a large population of supersoft sources in M31 then the sources are very confined to the galaxy plane. There may exist a number of the order 200 hot () and X-ray luminous planetary nebula nuclei in a spiral galaxy of the size of M31 according to the estimates of Iben & Tutukov (1985). They can be a minor sub-population of a larger population of luminous supersoft sources but with a larger scale height (h1). From the formal fit of Equation 11 to the normalized distribution (making use of the Supper- model) we would exclude that a population of hot and luminous planetary nebula nuclei (of order of 200 objects) alone account for the observed sample.
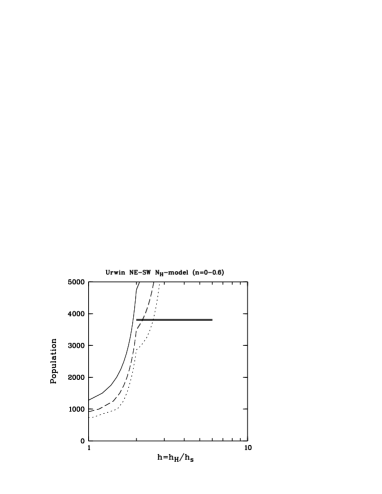
4.4 Number of sources expected with the Urwin- model
The normalized histogram is also calculated by making use of the Urwin model for the north-eastern (NE) part of the galaxy. This model consists of a radial distribution with 57 rings. This distribution has been converted into a galaxy model of M31 by assuming an inclination of the galaxy of (cf. Figure 4). This is a more refined model than the Supper- model. The normalized distribution is given in Figure 10. This distribution appears to cover only parts of the normalized -bins. The main histogram extends over the range =0.0-0.6. This fact can be explained if one considers the galactocentric distribution (12-16 kpc) of the sources which fall into this interval (cf. section 5) and the projected hydrogen columns of the M31 galaxy for these radii. The hydrogen columns are that large that indeed only part of the upper hemisphere population is detectable in agreement with the histogram extending to values well below n=1.0. The entries in the histogram for n are from the population found at radii 18-23 kpc. Here the projected hydrogen columns of are lower and the lower hemisphere population is detectable. But this part of the histogram is not very significant. We constrain our fit of Equation 11 only to the n=0.0-0.6 regime. This allows to constrain the size of the population and the scale height ratio. As we do not cover the top of the distribution we are not able to determine an upper bound for the population. Only by constraining the scale height ratio to realistic values for stellar populations we can determine an upper bound for the population.


The size of the population as derived with the Urwin- model is consistent to be in the range 1000-10,000 sources for a scale height ratio h=1-5 (cf. Figure 11).
As a refined model the radial profiles of the north-eastern (NE) and the south-western (SW) galaxy as given in Urwin (1980) have been used to calculate a -map of the galaxy and to deduce the hydrogen-column at the location of each supersoft source. The normalized distribution has been calculated which is given in Figure 12. This distribution extends over a similar range as for the Urwin model. A fit of Equation 11 to this distribution for a population is given in Figure 13 as a function of the scale height ratio . This distribution again extends mainly over the n=0.0-0.6 interval (see discussion above). The size of the population is 1000-10,000 for a scale height ratio h=1-5. There are sources from Table 1 which fall beyond the n=2 limit and are rejected (in the specific -model). For the NE-SW Urwin model these sources are found either at radii 15 kpc or at radii 5 kpc. The nature of these sources is unclear or the -model is still too crude (but see discussion in section 5). Some sources correlate with a foreground star or a M31 supernova remnant. Another possibility is that these sources are located at a large distance from the galaxy plane (500 pc) and are projected due to the considerable inclination of the galaxy towards the wrong reference hydrogen column. But this appears to be quite unlikely.
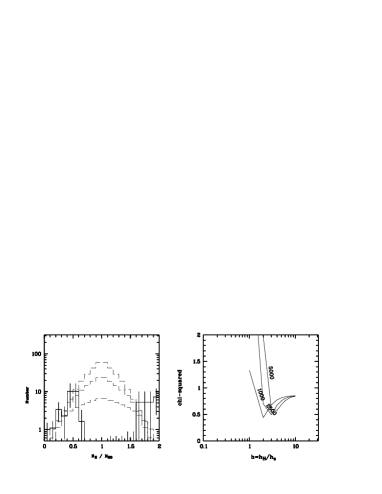
The NE-SW model may describe the distribution of the hydrogen column in M31 in a good approximation. It becomes evident that in the range of galactocentric radii 12-16 kpc where most supersoft sources are found the hydrogen column is that large that only part of the upper hemisphere population is visible. The total population can be constrained dependent on the scale height ratio.
In Table 2 the size of the population of supersoft sources in M31 as derived from different galaxy models is summarized. In the Supper model numbers have been derived from the n=0-1 histogram (the complete upper galaxy hemisphere) and in the Urwin model from the n=0-0.6 histogram (60% of the upper galaxy hemisphere). Interestingly the range of the population derived from different models does not differ much. This may be due to the fact that the errors associated with the (corrected) numbers are substantial due to the small number of selected sources. In order to better confine the range of the population detections of supersoft sources in the 12-16 kpc ring for values n0.6 are required. Such sources are heavily absorbed, they have hydrogen columns according to Figure 6 and they are only detected in the ROSAT 1991 survey of Supper if the white dwarf mass is in excess of (see possible candidates in the C-sample, cf. Table 1).
| population/1000 | ||||
|---|---|---|---|---|
| model | fit applied to | h=1 | 2 | 5 |
| Supper | (0n1.0) | 1.8-2.5 | 2.5-3.8 | 3.5-5.3 |
| Urwin | (0n0.6) | 1.5 | 5 | 15 |
| Urwin-NE-SW | (0n0.6) | 0.5-1.3 | 2-5 | 5-15 |
4.5 Comparison with the galactic population
There is evidence that the group of observed galactic supersoft sources is larger than assumed. Patterson (1998) proposes three sources to belong to this family, e.g. V Sge, T Pyx and (possibly) WX Cen. These blue and optically bright binary systems have orbital periods of 12, 2, and 10 hours. Assuming distances of 1.3, 2.5, and 1.4 kpc the objects are found 200, 430, and 16 pc above the galactic plane. The two “standard” galactic supersoft sources RX J0925.7-4758 and RX J0019.8+2156 are 33 and 840 pc above the galactic plane assuming distances of 1 kpc. Assuming an exponential z-distribution (cf. Equation 6) and assuming a scale height for the source population the total population can be constrained in order to be consistent with this sample. This is an independent consistency check for the distribution and size of the galactic sample. Assuming a scale height of 150 pc the population has to be greater than 270 in order to explain the discovery of one source such as RX J0019.8+2156 at such a large scale height. Assuming a much smaller scale height of 30 pc the probability of observing one RX J0019.8+2156 is negligible. The scale height of a population of supersoft sources which can explain RX J0019.8+2156 has to be larger than 105 pc if the total population is 3000. This is not a problem as 105 pc is still a small scale height for stellar populations. T Pyx is a recurrent supersoft source which is found 200 pc above the galactic plane. T Pyx may harbor a massive white dwarf as it has a recurrence period of 20 years. According to the population synthesis calculations of Yungelson (1996) there may be 113 galactic supersoft sources which are more massive than . These sources can become recurrent supersoft sources with such a recurrence period (cf. Kahabka 1995). Assuming a scale height of 105 pc for the source distribution 2 sources are expected to be found at a distance from the galactic plane as large as in T Pyx (430 pc). To observe one T Pyx is therefore in full agreement with this number. The distance from the galactic plane of all other supersoft sources is considerably smaller and is in agreement with such a population. The conclusion is that the prediction of a population of 1900 supersoft sources in the Milky Way by the population synthesis calculations of Yungelson (1996) is in agreement with the so far discovered galactic population if the scale height is 100 pc. One expects then 0.6 systems to be observed at the distance from the galactic plane of 840 pc, the distance of RX J0019.8+2156.
Assuming a scale height for the galactic supersoft sources of 100 pc and a scale height for the gas of 200-600 pc a value (Equation 9) is derived. Scaling with the mass ratio of the Andromeda galaxy and the Milky Way galaxy, which is about 2, one expects from the population synthesis calculations of Yungelson (1996) that there exists a population of 3800 supersoft sources in M31. Such a population having is consistent with the chi-squared fit to the normalized distribution given in Figure 9, 11 and 13. There is still the possibility of a bi-modal population consisting of a more extended population (e.g. the CV-type supersoft sources) and a more to the galaxy plane confined population (e.g. the subgiant class). We fitted such a bi-modal population to the normalized histogram of Figure 12 and find that an extended () population of 500 sources and a confined (h10) population of sources is possible.
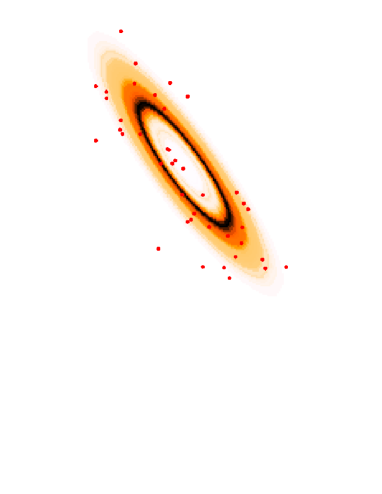
5 The spatial distribution
The 26 supersoft sources found in M31 are distributed over the whole galaxy disk (cf. Figure 4 for the distribution of the SW and the C-sample, cf. also Figure 14 and Figure 15). This may be in favor for a disk population. Recent spatial studies of novae in M31 using a Monte Carlo simulation have been performed by Hatano et al. (1997). From this study it follows that the ratio of bulge to disk population is about 1/2 similar to the ratio of bulge to disk mass of this galaxy although there is some controversy about this subject. In comparison for the Milky Way a ratio of 1/7 is found both for the novae and the mass. The M31 bulge has in the model of Hatano a radius of 6 kpc (equivalent to a projected size of 0.5o). A more extended discussion on the distribution of novae in M31 can e.g. be found in Capaccioli et al (1989), Rosino et al. (1998) and Yungelson et al. (1997). Interestingly there are 6 of the 31 (likely) candidate supersoft sources found in the bulge region. But three of these objects correlate eiher with a galactic foreground star or a M31 supernova remnant. A ratio 1/(5-10) is derived for supersoft sources detected in the bulge compared to objects detected in the disk. This ratio reduces to 1/(4-7) if only “accepted” systems are considered (cf. Figure 15). There may be a chaining of supersoft sources (from the C-sample) along a (12-16) kpc arm (cf. Figure 4,5, 14 and 15). This feature may also be found in the model of Hatano (cf. his Figure 3). The spatial distribution of the SW-sample (with a mean radius of 14 kpc) is consistent with a 12-16 kpc spiral arm of the M31 galaxy (cf. Figure 6 of Braun 1991). Another grouping of supersoft sources in a 18-21 kpc ring (cf. Figure 15) may be connected to a 18-24 kpc spiral arm (cf. Braun 1991). There are no detections within the 6-12 kpc ring (the only exception may be the source with the catalog index 212). In this ring the (projected) hydrogen column reaches values up to .
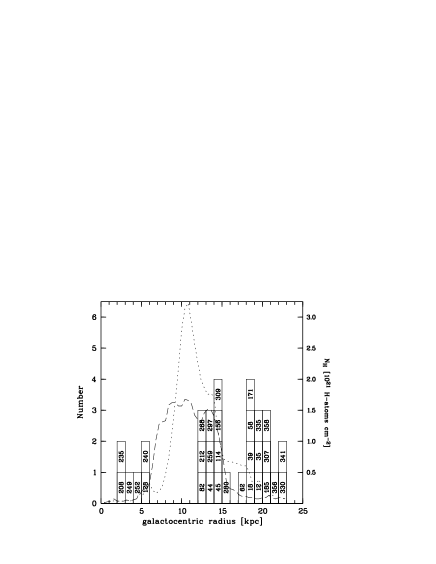
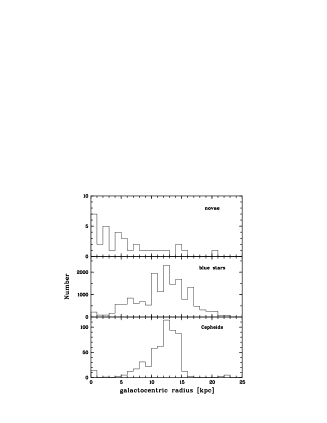
In Figure 15 we also show the galactocentric distribution of the M31 novae (from Sharov & Alksnis 1991, 1992), blue stars (B-V0.3) and Cepheids (from Magnier et al. 1992, 1997 and Haiman et al. 1994). Novae belong to an old stellar population and are preferentially detected in the bulge (at galactocentric radii 6 kpc). Blue stars belong to a young stellar population and trace the galaxy light. Cepheids belong to a somewhat older population. The distribution of Cepheids trace the spiral arms of M31 where recent star formation is taking place. They are found (in the distribution) predominantly within 8-15 kpc. For a consideration of the completeness of the Cepheid sample see Magnier et al. (1997). Actually there could be a second Cepheid peak at galactocentric radii 18-22 kpc where another M31 spiral arm is found and where a peak in the supersoft distribution is found. But the Magnier survey apparently did not cover this region.
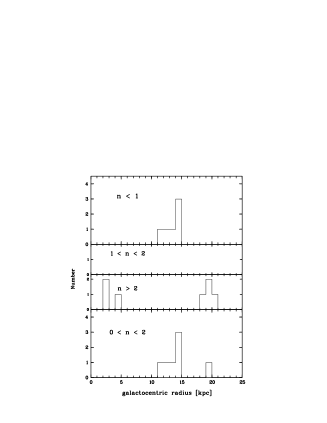
While novae appear to be bulge-dominated in the observational sample most possibly due to the low dust content of the M31 bulge supersoft sources appear to be to a less degree bulge-dominated and are more likely associated with the spiral arms. Considering only objects with 0n2 then supersoft sources are found within galactocentric radii of 5-25 kpc. They are not found in the bulge of M31, but within the range of Cepheids and blue stars and at 18-22 kpc. Bulge sources at galactocentric radii r6 kpc are only found in the “intrinsically absorbed” sample. They may be consistent with classical or symbiotic novae as these objects show high intrinsic absorption and tend to belong to an old population. The M31 supersoft sources may belong to a younger population similar to the Cepheids but to an older population than blue stars. Hatano et al. assume a scale height of the M31 novae of 350 pc. We find that the scale height of the M31 supersoft sources is consistent to be smaller (100-150 pc, at 5 kpc) which favors a younger stellar population and is in agreement with the supported view that slightly evolved main-sequence stars or subgiants are involved (van den Heuvel et al. 1992). A mean space density can be inferred for the population of supersoft sources in M31 (assuming that they are homogeneously distributed in a disk of radius 20 kpc and have a scale height of 150 pc) of . One could suspect from Figure 15 that we see two different sub-populations of supersoft sources, one in the bulge at galactocentric radii 6 kpc, possibly associated with (classical and symbiotic) novae, one at radii 12-16 kpc and 18-20 kpc respectively tracing spiral arms and possibly associated with subgiants and CV-type supersoft sources and one at radii 18-22 kpc also associated with a spiral arm and possibly associated with subgiants and CV-type supersoft sources.
6 Estimating a SN Ia rate inferred from the population of supersoft sources in M31
Assuming a total number of 1000-10,000 active supersoft sources in M31 as follows from an analysis in paragraph 4.3 and applying the cumulative mass distribution from Figure 3 gives a fraction of 26% in the and 32% in the hydrogen-burning shell approximation for white dwarf masses in excess of . Assuming that all objects with white dwarf masses in excess of explode as type Ia supernovae after a typical life time of years, a SN Ia rate of is inferred (in both approximations). Assuming that all objects with white dwarf masses in excess of explode as type Ia supernovae after a typical life time of years (cf. Yungelson et al. 1995), a SN Ia rate of is inferred (for the two approximations). Supersoft sources could then contribute up to a rate of . Capellaro (1997) assuming our Galaxy to be a spiral of type Sb or Sc, detected a Type Ia supernova rate of which for M31, with is about two times larger mass, means: . It thus seems that the supersoft X-ray sources can make a major contribution to the Type Ia SN rate in M31.
In is interesting to note that the historical supernova SN 1885 (S And) might be a subluminous SN Ia (Chevalier & Plait 1988, Fesen et al. 1998). This supernova is located in the bulge of M31.
7 Conclusions
From the 1991 ROSAT PSPC M31 X-ray point source catalog a sample of 26 candidate supersoft sources has been derived using one of the selection criteria or , and assuming that the observed count rate is in agreement with the expected steady-state luminosity. For these candidates absorbing hydrogen column densities, effective temperatures and white dwarf masses (assuming the sources are on the stability line of atmospheric nuclear burning) are derived. The observed white dwarf mass distribution of supersoft sources in M31 appears to be constrained to masses . The whole population of supersoft sources in M31 is estimated accordingly to be at least 1000 and at most 10,000 taking a theoretical white dwarf mass distribution and a double exponential scale height distribution for the gas and the source distribution into account and under the assumption that the observationally derived sample is restricted to white dwarf masses above . This range of a population has to be compared with the range of a population of 800-5000 sources as predicted from population synthesis calculations. We find the source population scale height to be 300 pc for a scale height for the gas of 150-600 pc. This is consistent with a young stellar population. Assuming a life time as a steadily nuclear burning white dwarf (a supersoft source) of and that all supersoft sources with masses in excess of are progenitors of supernovae of type Ia, a SN Ia rate of is inferred for M31 based on these progenitors. Supersoft sources then comprise 20-100% of the SNe Ia progenitors for a total estimated SN Ia rate of .
Acknowledgements.
I thank W.Hartmann from SRON for providing the LTE and non-LTE white dwarf atmosphere spectra. I thank D. Bhattacharya for discussions. I thank Gene Magnier for making me the positions of the M31 Cepheids and blue stars available. I thank E.P.J. van den Heuvel for reading the manuscript. I thank an anonymous referee for critical reading of the manuscript and useful comments. P.K. is a Human Capital and Mobility fellow. This research was supported in part by the Netherlands Organisation for Scientific Research (NWO) through Spinoza Grant 08-0 to E.P.J. van den Heuvel.References
- (1) Branch D., Livio M., Yungelson L.R., et al., 1995, PASP 107, 1019
- (2) Branch D., 1998, ARA&A 36, 17
- (3) Braun R., 1991, ApJ 372, 54
- (4) Brinks E., & Shane W.W., 1984, A&AS 55, 179
- (5) Cappellaro E., Turatto M., Bennetti S., et al., 1993, A&A 273, 383
- (6) Cappellaro E., Turatto M., Tsvetkov M., et al., 1997, A&A 322, 431
- (7) Chevalier R.A., & Plait P.C., 1988, ApJ 331, L109
- (8) Dickey J.M., & Lockman F.J., 1990, ARA&A 28, 215
- (9) DiStefano R., & Rappaport S., 1994, ApJ 437, 733
- (10) DiStefano R., 1996, Supersoft X-Ray Sources, Lecture Notes in Physics 472, Springer, 193
- (11) Ebisawa K., Asai K., Mukai K., et al., 1996, see Greiner 1996, 91
- (12) Evans NW., Gyuk G., Turner M.S., et al., 1998, ApJ 501, L45
- (13) Fesen R.A., Gerardy C.L., MClin K.M., et al., 1998, ApJ (subm.)
- (14) Greiner J., 1996, Supersoft X-Ray Sources, Lecture Notes in Physics 472, Springer, 75
- (15) Greiner J., Supper R., & Magnier E.A., 1997, in Supersoft X-Ray Sources, ed. J. Greiner, LNP 472, Springer, 75
- (16) Haiman Z., Magnier E.A., Lewin W.H.G., Lester R.R., et al., 1994, A&A 290, 371
- (17) Hartmann H.W., & Heise J., 1997, A&A 322, 591
- (18) Hasinger G., 1994, Rev.Mod.Astr. 7, 129
- (19) Hatano K., Branch D., Fisher A., 1997, ApJ 487, L45
- (20) Heise J., van Teeseling A., & Kahabka P., 1994, A&A 288, L45
- (21) Iben I.Jr., 1982, ApJ 259, 244
- (22) Iben I.Jr., & Tutukov A.V., 1985, ApJS 58, 661
- (23) Kahabka P., 1995, A&A 304, 227
- (24) Kahbaka P. & Trümper J., 1996, Supersoft ROSAT Sources in the Galaxies. In IAU Symposium No. 165, Compact Stars in Binaries, ed. J. van Paradijs, E.P.J. van den Heuvel & E. Kuulkers, Dordrecht: Kluwer, 425
- (25) Kahabka P. & van den Heuvel, 1997, ARA&A 35, 69
- (26) Kahabka P., 1998, A&A 332, 189
- (27) Li X-D, & van den Heuvel E.P.J., 1997, A&A 322, L9
- (28) Livio M., 1996, see Greiner 1996, 183
- (29) Magnier E.A., Lewin W.H.G., van Paradijs J., et al., 1992, A&AS 96, 379
- (30) Magnier E.A., Prins S., Augusteijn T., et al., 1997, A&A 326, 442
- (31) Parmar A.N., Kahabka P., Hartmann H.W., et al., 1997, A&A 323, L33
- (32) Parmar A.N., Kahabka P., Hartmann H.W., et al., 1998, A&A 332, 199
- (33) Patterson J., Kemp J., Shambrook A., et al., 1998, PASP 110, 380
- (34) Sharov A.S., & Alksnis A., 1991, Ap&SS 180, 273
- (35) Sharov A.S., & Alksnis A., 1992, Ap&SS 190, 119
- (36) Singh K.P., Barrett P., White N.E., et al., 1995, ApJ 455, 456
- (37) Supper R., Hasinger G., Pietsch W., et al., 1997, A&A 317, 328
- (38) van den Heuvel E.P.J., Bhattacharya D., Nomoto K., & Rappaport S.A., 1992, A&A 262, 97
- (39) van Teeseling A., Heise J., & Kahabka P., 1996, in Compact Stars in Binaries, IAU Symposium 165, ed. J. van Paradijs, E.P.J. van den Heuvel, and E. Kuulkers, Kluwer, 445
- (40) Walterbos R.A.M., & Kennicutt R.C., 1988, A&A 198, 61
- (41) Yungelson L.R., Livio M., Tutukov A., et al., 1995, ApJ 447, 656
- (42) Yungelson L.R., Livio M., Truran J.W., et al., 1996, ApJ 466, 890
- (43) Yungelson L.R., Livio M., Tutukov A., 1997, ApJ 481, 127
- (44) Yungelson L.R., Livio M., 1998, ApJ 497, 168