Recent results on intermediate polars
Abstract
I review recent activity in the field of intermediate polars, concentrating on: the mode of accretion (disc-fed, disc-overflow or discless); accretion curtains (the transition region and the accretion footprint); X-ray pulse profiles (occultation and absorption effects); accretion columns (mass determinations, line-broadening, the soft X-ray component), and outbursts in intermediate polars.
Department of Physics, Keele University, Staffordshire ST5 5BG, U.K.
1 Introduction
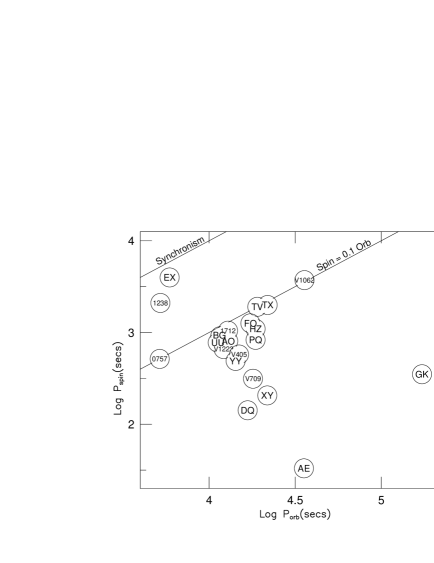
The intermediate polars (IPs) have been reviewed comprehensively by Patterson (1994) and Warner (1995), see also Hellier (1995; 1996). Here I discuss areas of current activity, mainly from the observational side, and with an X-ray bias. A good place to start is with a (fairly conservative) census of currently known systems, presented on the now traditional spin–orbit diagram (Fig. 1). Compared to previous versions we have a tripling of the known systems below the gap, with RX 1238–38 (Buckley et al. 1998) and RX 0757+63 (Tovmassian et al. 1998) joining EX Hya.
2 Accretion Mode
Almost all IPs show a dominant X-ray periodicity at the spin period (a defining characteristic). Some, though, show additional X-ray periodicities, particularly at the beat frequency – (where = spin frequency and = orbital frequency). This was seen first in TX Col (Buckley & Tuohy 1989) and subsequently in at least 5 others (e.g. Hellier 1991; 1998). The now-standard interpretation is that some of the accretion stream overflows the initial impact with the disc and connects directly onto field lines, producing ‘flipping’ between the poles on the beat period (e.g. Hellier 1991). This has become known as ‘disc-overflow’ or ‘stream-overflow’ accretion. It appears to be variable, judging by the changing ratio of the spin and beat amplitudes in stars such as FO Aqr and TX Col (Hellier 1991; Norton et al. 1997; Wheatley, this volume).
| Star | P (s) | P (h) | m | Star | P (s) | P (h) | m | |
|---|---|---|---|---|---|---|---|---|
| EX Hya | 4022 | 1.638 | 13 | PQ Gem | 833 | 5.19 | 14.5 | |
| V1062 Tau | 3700: | 9.96: | 15.1 | AO Psc | 805 | 3.59 | 13.5 | |
| RX 1238–38 | 2147 | 1.41: | 16 | V1223 Sgr | 746 | 3.37 | 13 | |
| TX Col | 1911 | 5.72 | 15 | V405 Aur | 545 | 4.15 | 14.6 | |
| TV Col | 1910 | 5.49 | 14 | RX 0757+63 | 515 | 1.44 | 16 | |
| WX Pyx | 1558 | 17 | YY Dra | 529 | 3.96 | 16 | ||
| RX 0153+74 | 1414 | GK Per | 351 | 47.9 | 14 | |||
| FO Aqr | 1254 | 4.85 | 13.5 | V709 Cas | 313 | 5: | 14.6 | |
| HZ Pup | 1210 | 5.1 | 18.5 | XY Ari | 206 | 6.06 | 23 | |
| RX 1712–24 | 927 | 3.4: | 14 | DQ Her | 142 | 4.65 | 15 | |
| BG CMi | 913 | 3.23 | 14.5 | AE Aqr | 33 | 9.88 | 11 | |
| UU Col | 864 | 3.45 | 17.6 |
References in Patterson 1994, and Hellier et al. 1998 (RX 1238–38); Still et al. 1998 (V405 Aur); Tovmassian et al. 1998 (RX 0757+63); O’Donoghue et al. 1996 (WX Pyx); Motch et al. 1996 (RX 0153+74, V709 Cas); unpublished (HZ Pup); Buckley et al. 1997 (RX 1712–24); Burwitz et al. 1996 (UU Col).
This idea was criticised by Murray at this conference using the following argument. The overflowing stream can’t penetrate further in than the ballistic distance of minimum approach to the white dwarf, . If the disc disruption, , occurs inside , the overflowing stream would re-impact on the disc, not the magnetosphere. If, though, , it is unclear whether a disc can form. Murray et al. (1999, see also this volume) propose that spiral shocks could provide an alternative means by which material at the magnetosphere retains knowledge of orbital phase, and hence produces sideband periodicities.
My preference is still for the disc-overflow model, because in X-ray lightcurves the dominant sideband periodicity (where seen) is at – , rather than 2( – ) (e.g. Hellier 1992). The – ‘pole-flipping’ frequency arises naturally when two poles are fed from one location in orbital phase, as from a stream (e.g. Hellier 1991; Wynn & King 1992). A twin-armed spiral leads most readily to twice this frequency, or 2( – ) (Murray et al. 1999, and this volume).
So can we overcome Murray’s argument? In addressing it we encounter a far more general problem for IP accretion (see also Warner 1996). I’ll use FO Aqr, often showing a – modulation (Hellier 1993; Beardmore et al. 1998), as a test case. Firstly, FO Aqr is almost certainly close to equilibrium rotation, since the – of the spin cycle has alternated between spin-up and spin-down over the last decade (Patterson et al. 1998). We can thus assume that the 1254-s spin period is also the Keplerian period at the inner edge of the disc (i.e. a critical fastness parameter 1). Using the standard formulae for CV parameters (as collected in Warner 1995), with = 4.85 hr and assuming M⊙, we find that as a fraction of the stellar separation, = 6%, the stream’s circularization radius, = 10%, and = 14%.
This is good news for the disc-overflow model, in that the stream would hit the magnetosphere. Indeed, this is insensitive to and applies to most IPs.111Only in GK Per, with its long 2-d orbit, would be well outside , and here Hellier & Livio (1994) proposed that a re-impact on the disc resulted in the X-ray QPO seen in outburst (though see Morales-Rueda, Still & Roche, this volume, for a contrary opinion). However, having is bad news for the disc (its angular momentum would dissipate). Since IPs do seem to be predominantly disc-fed (e.g. the dominance of X-ray pulsations at ; Hellier 1991), this is a general problem for the theory of magnetic accretion and points to the need for torques not currently taken into account, either produced by the disc-field interaction, or by the magnetic interaction of the two stars (e.g. Warner 1996). Note that Mason (1997), studying the large spin-down rate in PQ Gem, suggested that material was threading onto field lines well outside the co-rotation radius, in contradiction to the standard theory (e.g. Ghosh & Lamb 1979).
If we rule out , the disc-overflow model can still work in the regime provided that the disc can form. Whether this is so is unclear, though if the centrifugal barrier of a spinning magnetosphere makes accretion inefficient, a build up of material could screen enough of the field to allow a disc to form. Lamb & Melia (1988) suggest that this always occurs.
Lastly, note that is set by the dense disc. If an overflowing stream is relatively tenuous (Mukai, Ishida & Osborne 1994 estimated that it carried only 2% of the accretion flow in FO Aqr) it could be penetrated by the field further out than the disc is, allowing stream–field interactions even with .
The above arguments also lead to the expectation that faster rotators, which have smaller magnetospheres, would be less likely to show disc-overflow sidebands; Norton et al. (1999) suggest that this is indeed the case.
2.1 Optical sidebands
As a result of the disc-overflow idea becoming popular to explain X-ray sidebands, some recent papers have used it to explain optical sidebands also. While this is possible, it should be remembered that there is nothing wrong with the traditional appeal to reprocessing of spin-pulsed X-rays by the secondary and/or hot-spot. Indeed, detailed studies of the phasing of the optical beat period often support this (e.g. Hellier, Cropper & Mason 1991). The reason that this won’t work in the X-ray is that the combination of the solid-angle of the target and the albedo to X-ray reflection means that the amplitude can be at most a few percent of that of the spin-pulsed X-rays. (See also Wickramasinghe & Ferrario, this volume, for an account of optical sidebands.)
One thing that has proved puzzling is the occasional observation of optical pulsations at 2( – ), with little or nothing seen at – (e.g. in TV Col and RX 1238–38; Buckley & Sullivan 1992; Buckley et al. 1998). A twin-armed spiral shock could well explain this (e.g. Murray et al. 1999) since reprocessing off diametrically-opposite sites would double the frequency and so give 2( – ) rather than – .
2.2 Stream-fed accretion
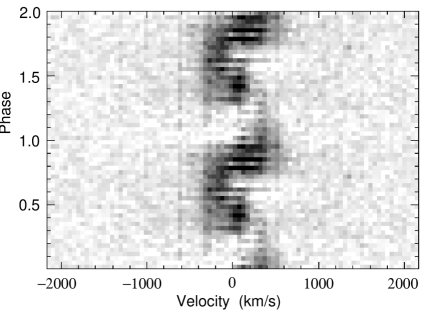
Through Buckley et al.’s papers (1995, 1997) we know of one system, RX 1712–24, that appears to accrete solely by a stream, since – , rather than , dominates the X-ray lightcurves. Fig. 2 shows unpublished H profiles folded on the – cycle, which appear to show the stream flipping in velocity between the poles, as expected in a discless accretor. We heard relatively little about RX 1712–24 at this conference, partly because the tumbling of the magnetosphere beneath the stream produces chaotic variability that is hard to analyse. For instance a Fourier transform of an ASCA lightcurve (unpublished) shows significant power only at 2( – ), in contrast to the – detected by Buckley et al. (1997).
3 Curtain-fed accretion
At this conference I presented ‘spin-cycle tomograms’ of several IPs. The technique of Doppler tomography can be applied as readily to data folded on the spin cycle as on the orbital cycle, only the interpretation is different. Fig. 3 shows tomograms of AO Psc and PQ Gem (for a fuller account see Hellier 1997a, 1999). That of AO Psc shows the accretion curtain from the upper pole in the “3 o’clock” position. Note that it subtends 100∘ at the origin, implying that the (line-emitting) accretion curtain covers this range of azimuth.
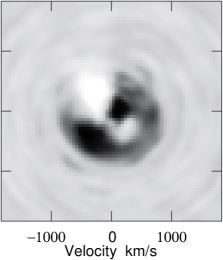
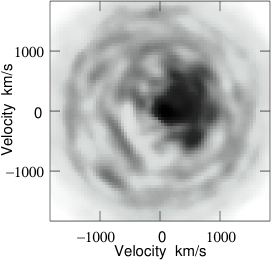
The PQ Gem tomogram shows emission from both upper and lower poles. In contrast to several IPs, which show maximum blueshift from the upper curtain when it points away from us (e.g. Hellier, Cropper & Mason 1991), the curtains in PQ Gem appear twisted. If they followed the expected pattern (maximum blueshift at spin maximum) the poles would lie symmetrically on the -axis in the tomogram, but they are rotated by 40∘. Encouragingly, there is independent evidence from the X-ray lightcurves (Mason 1997) and from polarimetry (Potter et al. 1997) for the same effect, with material accreting predominantly along field lines ahead of the magnetic poles.
3.1 The transition region
I flag the transition region between the disc and field since it is the biggest area of uncertainty in IPs. We are still discussing whether it is an orderly transition from a ‘normal’ disc to magnetically-channeled infall, or whether the ‘disc’ is a sea of diamagnetic blobs floating in the magnetic field (e.g. Wynn & King 1995). The transition region, of course, determines the accretion footprint. Given the relatively small accretion areas deduced from observations (see below) my hunch is that the transition region is relatively abrupt and ordered, and that diamagnetic blobs are not able to cross field lines much.
Observationally we find it hard enough to measure , never mind the width of the transition region . We also can’t deduce from the magnetic fields since we have secure values only for the 3 IPs showing polarised light [these are PQ Gem at 9–21 MG (Väth et al. 1996; Potter et al. 1997), RX 1712–24 at 9–27 MG (Väth 1997), and BG CMi at 2–6 MG (Chanmugam et al. 1990)]. If someone succeeded in finding , though, quoting Patterson (1994), “the treasure trove of the world’s data, accumulated over decades and still awaiting a proper interpretation, is theirs for the taking”. Spin-cycle tomography (see above), offering hints of twisted and azimuthally-extended curtains, is perhaps the likeliest way forward.
3.2 The accretion footprint
If the transition region is hard to pin down, how about the other end of the curtain, the accretion footprint? We have fewer observational constraints than in AM Her stars. This is because, whereas AM Hers have (typically) one dominant accretion region, IPs accrete equally onto two opposite regions (see below) making the interpretation of their lightcurves much harder. Recently, though, the deeply-eclipsing IP XY Ari has provided secure results. The egress from X-ray eclipse in 2 s (Fig. 4) limits the accretion region to 0.002 of the white dwarf area during quiescence (Hellier 1997b). At the peak of outburst, however, the accretion region at the upper pole is visible at all spin-phases, which implies that it must be extended into an almost-complete azimuthal ring (Hellier, Mukai & Beardmore 1997). There is no constraint on the azimuthal extent during quiescence. Thus accretion regions seem to be thin ribbons, covering small areas, but extended in magnetic longitude. This, of course, is what we expect from tracing back field lines from the disc-disruption region (e.g. Rosen 1992), but confirmation from data is encouraging.

Additional information comes from the black-body-like soft components in the X-ray spectra of some IPs. Their fluxes lead to fractional areas 10-5 (Haberl & Motch 1995), and presumably the hard-X-ray is smaller still.
4 X-ray pulse profiles
The X-ray spin pulses in IPs are potentially the biggest clue to the accretion regions on the white dwarf, however their interpretation is still not settled. Progress is currently hampered by ambiguity in the models, in that there are many ways of creating a quasi-sinusoid; considerations include occultation, photo-electric absorption, electron scattering, the effect of non-zero shock heights, and offset or asymmetric dipoles. Although I don’t have space for a comprehensive account, I can outline the current state of thought.
Firstly, let me claim that all IPs accrete roughly equally onto two opposite poles and that both poles contribute to the pulsation. The theoretical justification is that we have never found magnetic monopoles; that a disc feeds both poles roughly equally (asymmetries have only a minor effect out at ), and that even a stream distributes material evenly onto both poles when averaged over the beat cycle. [In contrast, stream accretion in a phase-locked AM Her can greatly favour one pole.] The observational evidence is the fact that IP hard-X-ray lightcurves never go to zero flux [as occurs in AM Her stars when only one pole accretes and that pole is on the far side of the white dwarf]. Indeed, when the ‘IP’ RX 1914+24 was observed to have zero flux for half its cycle, Cropper et al. (1998a) proposed that it must be an ultra-short-period AM Her star, which appears to have been confirmed by further data (Ramsay et al., this volume).
There is one exception to the above, which is XY Ari in outburst.222We don’t see DQ Her’s white dwarf at all, judging by the high inclination and lack of X-rays. This star has a very high inclination ( 80∘), a short spin pulse (and thus a small equilibrium ), and during outburst the increased mass transfer reduced by a factor of two. The combination of all three allowed the disc to block the line-of-sight to the lower pole (Hellier et al. 1997), but this exception under extreme conditions reinforces the point that normally both poles must be seen. Many past IP papers have considered only the upper pole, since this is conceptually easier, but this simplification is no longer profitable.
4.1 Occultation
Two symmetric, zero-height, accretion poles give no net modulation through occultation, since one site’s appearance compensates for the disappearance of the site diametrically opposite. A non-zero shock height, though, breaks the symmetry. At large shock heights ( 0.3) the upper pole is always visible; we see most of both poles when the upper pole points away (which I’ll call ‘phase 0’ for brevity), and at phase 0.5 the lower pole is mostly hidden, so the net modulation has a flux minimum at phase 0.5. This may apply to EX Hya (Hellier et al. 1991; Allan, Hellier & Beardmore 1998; Mukai, this volume). At lower, and more typical, shock heights ( 0.05) both poles can pass over the limb, and occultation produces maxima near phases 0.25 and 0.75, when both poles are visible because both are on the limb; the result is a small-amplitude, double-peaked modulation (Mukai, this volume). Such features, seen in, e.g., XY Ari and FO Aqr, have previously been ascribed to offset dipoles (e.g. Hellier et al. 1997; Beardmore et al. 1998). It will be difficult to separate these causes, though Mukai’s mechanism is the more natural.
4.2 Opacity
If you pour g s onto – of the white dwarf then a path length of 0.01–0.05 gives an electron-scattering optical depth of 1–100. Photoelectric absorption would extinguish soft X-rays unless, as expected, the flow is highly ionized. These numbers demonstrate that opacity in the post-shock flow is highly significant, and is likely to dominate the pulse profiles, given that occultation largely cancels out. This is confirmed by the finding that electron-scattering depths of a few are required to model the X-ray spectra over spin phase (e.g. Hellier et al. 1996) and by the observation of Compton-broadened K line profiles in some IPs (Hellier, Mukai & Osborne 1998).
For the high values of implied by the above the radial optical depth through the accretion shock and the pre-shock flow will exceed the horizontal optical depth, so that radiation will emerge preferentially through the sides of the accretion flow (see Fig. 5). This is the ‘accretion curtain’ model for producing large quasi-sinusoidal pulses with both poles acting in phase and with minima when the upper pole points towards the observer. It applies most securely to AO Psc, whose X-ray lightcurve shows a large-amplitude, sinusoidal pulse which is deeper at lower energies, and whose optical emission lines are redshifted during the minimum (see Hellier et al. 1991, 1996, and also see Kim & Beuermann 1995, 1996 for a theoretical model of the situation).
This can’t be the whole story, however, since many IPs (e.g. V405 Aur, YY Dra, GK Per, XY Ari) show smaller-amplitude, double-humped X-ray pulse profiles, rather than the ‘traditional’ quasi-sinusoid. One can perhaps explain this if the inclination and dipole offset conspire to keep the accretion curtain from crossing the line-of-sight, allowing occultation effects, due to non-zero shock heights or asymmetric dipoles, to take over. The curtain would never cross the line-of-sight for inclinations where is the dipole offset and (18∘ for = 10 ) is the magnetic colatitude of accretion. Many of the IPs showing quasi-sinusoids (FO Aqr, AO Psc, BG CMi) do seem to be medium-inclination systems (as judged by grazing eclipses and/or X-ray orbital dips; Hellier 1995) where curtain-caused dips would be greatest.
Another factor is that, as I’ve pointed out previously (Hellier 1996, see also Allan et al. 1996; Norton et al. 1999), the IPs showing double-humped pulses tend to be the faster rotators (e.g. V405 Aur, XY Ari, YY Dra, AE Aqr). Faster rotators will (in equilibrium) have smaller values of . I suggested that if smaller corresponded to larger values then the situation above could be reversed, and optical depths could be lowest radially. If so, the accretion regions would now act as searchlights, beaming X-rays outwards. As the two poles swept into view a double-humped pulse would result. This seems to be supported by UV data on the fastest rotator, AE Aqr (e.g. Eracleous et al. 1994).
It is unclear whether lowering does lead to a larger : this would happen if was constant as decreased, but not if it was a fixed fraction of (the latter would give the same fractional change in ). Since velocities and therefore velocity dispersions are greater for smaller , though, one might expect a relatively larger , but the theory of this topic is sparse.
One problem with the above idea is that one of the stars showing a double-hump, and thus needing a higher , is V405 Aur, where the measured black-body is only 10-5 (Haberl & Motch 1995). Thus the picture is unclear and to make progress we need further detailed investigations of the individual stars.
4.3 X-ray spectroscopy
Potentially, X-ray spectra resolved over spin phase should sort out the pulse-formation mechanisms. However, we are finding that even with the spectral resolution of ASCA, this is not necessarily so. The reason is that accretion curtains are found to be patchy, multi-phase absorbers complete with electron scattering, giving a much flatter energy signature than simple photoelectric absorption (e.g. Ishida 1991; Hellier et al. 1996). Also, since the bottoms of accretion columns occult most readily, and are cooler than the shock, occultation can produce the same deeper-at-low-energies signature as absorption. In at least two cases [RX 1238–38 (Hellier et al. 1998) and EX Hya (Allan et al. 1998)] we have been unable to distinguish the two processes with ASCA data. Observations with a higher S/N and greater energy range (e.g. with XMM) will be required.
5 Accretion columns
We have a good theoretical understanding of the temperature and density profile of the accretion column for a given white dwarf mass (e.g. Aizu 1973), and we have increasingly good X-ray spectra (from Ginga, ASCA, RXTE and soon XMM). Can we combine the two to probe accretion columns?
5.1 White dwarf masses
In principle we can use a temperature/density profile, together with plasma codes, to construct model X-ray spectra, and deduce the white dwarf masses by fitting to observations (e.g. Cropper, Ramsay & Wu 1998, see also this volume; Beardmore & Osborne 1999). This is easier in IPs than in AM Hers since we can neglect cyclotron cooling, and consequently we can assume that electrons and ions have the same temperature (e.g. Imamura & Durisen 1983).
There are, though, still considerable uncertainties, including clumpiness in the flow; opacity affecting the spectral shape (and if this includes electron scattering of 1 it will affect all energies); the contribution of X-rays reflected by the white dwarf surface; the uncertainty in (which sets the shock height); uncertainty in the shape of the accretion region (which affects path lengths); the need for a low-temperature cutoff where the column goes optically thick as it merges with the white dwarf; and the mass-radius relation of a hot white dwarf possessing an accreted hydrogen envelope.

Given this it is perhaps not surprising that there are still discrepancies between masses derived by this method and those from other methods (the X-ray spectra tend to give higher masses — see Ramsay et al. 1998; Cropper et al., this volume). However, the estimates by different methods are currently converging, and with some more tuning the X-ray spectra could turn into powerful tools for deriving the white dwarf masses of a whole class.
One factor I haven’t seen discussed is that most treatments assume that the accretion flow falls into the white dwarf from infinity. In an AM Her, with quasi-radial infall from the point, this is a fair assumption, but in an IP, assuming disruption of the disc at , it is unclear how much, in any, of the Keplerian velocity translates into speed down field lines. If we assume freefall only from 10 then the kinetic energy at the white dwarf is reduced by 10%. Further, the enforced co-rotation with rapidly-spinning field lines will produce a centrifugal force which further slows the infall. A simple calculation, including a centrifugal force term in the freefall, shows that for a fast rotator (in equilibrium at 7 ) the two effects combine to a 21% reduction in kinetic energy. This is, for example, sufficient to remove the remaining discrepancy between estimates of XY Ari’s white dwarf mass by this method compared to methods using its eclipse (see Cropper et al., this volume).
5.2 Broadened lines

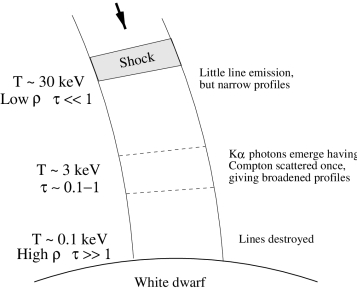
Another potential probe of the accretion column occurs through the discovery of broadened iron K lines in the X-ray spectra of some IPs (Hellier et al. 1998; Fig. 7). We showed that Doppler broadening was an insufficient explanation, and concluded that Compton scattering in the post-shock region was broadening the lines. We suggested the picture drawn schematically in Fig. 8, where the hot, optically-thin, upper region radiates little line emission. In the dense, optically-thick, lower region, line photons are destroyed by multiple scatterings. In the transition region, however, resonant trapping of K photons allows them to be Compton-scattered once and only once as they emerge. The degree of broadening is thus a probe of the column temperature at the transition to optical thickness. This could explain why some IPs show broad lines while others don’t: if the transition to optical thickness occurs at temperatures too low for significant iron K emission then only narrow lines will be seen.
5.3 Soft IPs
Owing to ROSAT we know of three IPs (PQ Gem, V405 Aur & UU Col; Mason et al. 1992; Haberl et al. 1994; Burwitz et al. 1996) that show soft black-body components similar to those in AM Her stars (a fourth star, RX 1914+24, I now class as an AM Her, see Cropper et al. 1998a).
People have often supposed that IPs have larger values than AM Hers, since IPs accrete from a disc over a range of azimuth, whereas AM Hers accrete from a narrow stream. The soft components in IPs, however, are convincing me otherwise. Firstly, they have measured temperatures (38–57 eV) in the range that AM Hers do, whereas larger areas would lead to lower temperatures. Secondly, the areas derived from their fluxes (e.g. 10-5 for V405 Aur at 300 pc; Haberl & Motch 1995) are no higher than those found for AM Hers (see Stockman 1995).
Why is this? In an AM Her, the radial infall of the stream helps it to punch a hole in the magnetosphere. It breaks up into blobs which become magnetically controlled at different field strengths (and hence different radii) depending on their size and density. Thus the ballistic-to-magnetic transition occurs over a large volume, corresponding to a large footprint on the white dwarf. This appears to have been observed in spectroscopy of the accretion stream (Sohl & Wynn, this volume). In contrast, passage through a disc in an IP will destroy blobs, and during disc-disruption the tangential Keplerian velocity won’t help the material to penetrate the field. The field lines are, presumably, scooping up material at a near-constant rate as they rotate, and since diffusion times are longer than spin cycles, this is likely to occur at a constant radius. Although the theory of this is uncertain, it could lead to a homogenous, rather than blobby, accretion flow. The small would map to a smaller footprint on the white dwarf, compensating for the larger range of azimuth.
Two further observations support this idea. Firstly, AM Hers can show high-amplitude, erratic, soft-X-ray lightcurves, as individual blobs hit the photosphere (Heise et al. 1985); nothing as dramatic has been seen in IPs. Secondly, whereas the soft component is widespread in AM Hers, and thought to be mainly due to blobs penetrating the photosphere and thermalising, only 3 of 23 IPs show comparable soft components, suggesting a general absence of blobby accretion.
So why do those 3 show soft components? We expect some soft emission from irradiated areas around the accretion region in all IPs, but what does it correlate with? With only 3 systems this is hard to answer, but it doesn’t seem to be field strength: PQ Gem and RX 1712–24 both have 10–20 MG fields but the former shows a soft component and the latter doesn’t. Nor does it appear to be absorption: that to RX 1712–24 is no higher than that to V405 Aur (Motch & Haberl 1995). Inclination? Tricky to say, since inclination estimates are only reliable for eclipsing systems. Accretion rate? These estimates are always unreliable! Could the heated regions be veiled by the accretion curtain? Perhaps, but in simple pictures the column-base at one of the poles should always be seen at some spin phase. Thus, this topic remains unsolved.
6 Outbursts
Despite the fact that, even up to 1998, authors have stated that outbursts are discordant with an IP classification, at least 6 confirmed IPs have shown outbursts (e.g. Warner 1996; Hellier et al. 1997). I want to publicise the fact that there appear to be two types of outburst. YY Dra, GK Per & XY Ari all show ‘normal’ dwarf-nova-like outbursts, with any differences being explained by their occurrence in a truncated disc (e.g. Angelini & Verbunt 1989). The other three, EX Hya, TV Col & V1223 Sgr, show shorter, lower-amplitude outbursts with a range of observational properties at odds with normal behaviour (Hellier et al. 1997 and references therein). It appears that the normal instability is suppressed and replaced by a different instability (see Warner 1996). We don’t know what this is, though secondary-star instabilities have been suggested, but it remains a topic in need of attention by theorists. Can the outbursts in these 3 stars be explained within the standard disc-instability paradigm?
References
Aizu K., 1973, Prog. Theo. Phys., 19, 1181
Allan A., Hellier C., Beardmore A.P., 1998, MNRAS, 295, 167
Allan A., Horne K., Hellier C., et al., 1996, MNRAS, 279, 1345
Angelini L., Verbunt F., 1989, MNRAS, 238, 697
Beardmore A.P., Mukai K., Norton A.J. et al., 1998, MNRAS, 297, 337
Beardmore A.P., Osborne J.P., 1999, MNRAS, submitted
Buckley D.A.H. et al. 1995, MNRAS, 275, 1028
Buckley D.A.H. et al. 1997, MNRAS, 287, 117
Buckley D.A.H., Cropper M., Ramsay G. et al., 1998, MNRAS, 299, 83
Buckley D.A.H., Tuohy I.R., 1989, ApJ, 344, 376
Buckley D.A.H., Sullivan D.J., 1992, in ‘Viña del Mar Workshop on Cataclysmic Variable stars’, ed N. Vogt, ASP Conf. Ser. 29, p387
Burwitz V., Reinsch K., Beuermann K., Thomas H.-C., 1996, A&A, 310, L25
Chanmugam G., Frank J., King A.R., Lasota J.-P., 1990, ApJ, 350, 13
Cropper M. et al. 1998a, MNRAS, 293, 57
Cropper M., Ramsay G., Wu K., 1998, MNRAS, 293, 222
Eracleous M. et al. 1994, ApJ, 433, 313
Ghosh P., Lamb F.K., 1979, ApJ, 234, 296
Haberl F., Motch C., 1995, A&A, 297, L37
Haberl F., Thorstensen J.R., Motch C. et al., 1994, A&A, 291, 171
Heise J. et al. 1985, A&A, 148, L14
Hellier C., 1991, MNRAS, 251, 693
Hellier C., 1992, MNRAS, 258, 578
Hellier C., 1993, MNRAS, 265, L35
Hellier C., 1995, in ‘Cape workshop on magnetic cataclysmic variables’, eds, Buckley D.A.H., Warner B., ASP Conf. Ser. 85, p185
Hellier C., 1996, in ‘CVs and related objects’, Kluwer, p143
Hellier C., 1997a, MNRAS, 288, 817
Hellier C., 1997b, MNRAS, 291, 71
Hellier C., 1998, Adv. Space Res., 22(7), 973
Hellier C., 1999, ApJS, in press
Hellier C., Beardmore A.P., Buckley D.A.H., 1998, MNRAS, 299, 851
Hellier C., Cropper M., Mason K.O., 1991, MNRAS, 248, 233
Hellier C., Livio M., 1994, ApJL, 424, L57
Hellier C., Mukai K., Beardmore A.P., 1997, MNRAS, 292, 397
Hellier C., Mukai K., Ishida M., Fujimoto R., 1996, MNRAS, 280, 877
Hellier C., Mukai K., Osborne J.P., 1998, MNRAS, 297, 525
Imamura J.N., Durisen R.H., 1983, ApJ, 268, 291
Ishida M., 1991, PhD thesis, University of Tokyo
Kim Y., Beuermann K., 1995, A&A, 298, 165
Kim Y., Beuermann K., 1996, A&A, 307, 824
Lamb D.Q., Melia F., 1988, in ‘Polarised radiation of circumstellar origin’, p45
Mason K.O., Watson M.G. et al., 1992, MNRAS, 258, 749
Mason K.O., 1997, MNRAS, 285, 493
Motch C. et al., 1996, A&A, 307, 459
Mukai K., Ishida M., Osborne J.P., 1994, PASJ, 46, L87
Murray J.R., Armitage P.J., Ferrario L. et al., 1999, MNRAS, 302, 189
Norton A.J., Beardmore A.P., Allan A., Hellier C., 1999, A&A, submitted
Norton A.J., Hellier C., Beardmore A.P. et al., 1997, MNRAS, 289, 362
O’Donoghue D., Koen C., Kilkenny D., 1996, MNRAS, 278, 1075
Patterson J., 1994, PASP, 106, 209
Patterson J. et al. 1998, PASP, 110, 415
Potter S.B., Cropper M., Mason K.O. et al., 1997, MNRAS, 285, 82
Ramsay G., Cropper M., Hellier C., Wu K., 1998, MNRAS, 297, 1269
Rosen S.R., 1992, MNRAS, 254, 493
Still M.D., Duck S.R., Marsh T.R., 1998, MNRAS, 299, 759
Stockman H.S., 1995, in ‘Cape workshop on magnetic cataclysmic variables’, eds, Buckley D.A.H., Warner B., ASP Conf. Ser. 85, p153
Tovmassian G. H. et al., 1998, A&A, 335, 227
Väth H., 1997, A&A, 317, 476
Väth H., Chanmugam G., Frank J., 1996, ApJ, 457, 407
Warner B., 1995, Cataclysmic variable stars, Cambridge University Press
Warner B., 1996, Astr. Space Sci., 241, 263
Wynn G.A., King A.R., 1992, MNRAS, 255, 83
Wynn G.A., King A.R., 1995, MNRAS, 275, 9