A search for gravitational lensing in 38 X-ray
selected clusters of galaxies
Abstract
We present the results of a CCD imaging survey for gravitational lensing in a sample of 38 X-ray-selected clusters of galaxies. Our sample consists of the most X-ray luminous ( 2 1044 erg s-1) clusters selected from the Einstein Observatory Extended Medium Sensitivity Survey (EMSS) that are observable from Mauna Kea ( 40o). The sample spans a redshift range of 0.150.823 and includes 5 clusters with 0.5. CCD images of the clusters were obtained in excellent seeing. There is evidence of strong gravitational lensing in the form of giant arcs (length , axis ratio ) in 8 of the 38 clusters. Two additional clusters contain shorter arclets, and 6 more clusters contain candidate arcs that require follow-up observations to confirm their lensing origin. Since the survey does not have a uniform surface brightness limit we do not draw any conclusion based on the statistics of the arcs found. We note, however, that 60% (3 of 5) of the clusters with 1045 erg s-1, and none of the 15 clusters with 41044 erg s-1 contain giant arcs, thereby confirming that high X-ray luminosity does identify the most massive systems, and thus X-ray selection is the preferred method for finding true, rich clusters at intermediate and high redshifts.
The observed geometry of the arcs, most of which are thin, have large axis ratios (10), and are aligned orthogonal to the optical major axes of the clusters, indicate the cluster core mass density profiles must be compact (steeper than isothermal). In several cases, however, there is also some evidence, in the form of possible radial arcs, for density profiles with finite core radii.
Key Words.:
galaxies: clusters: general – gravitational lensing – X-Rays : galaxies – Cosmology: observations : dark matter1 Introduction
Gravitational lensing by clusters of galaxies is recognized as a powerful cosmological tool. By measuring the various properties of the gravitationally magnified and distorted mirages of background galaxies (the so-called arcs and arclets), we can learn important information about both the lensing cluster and the faint, distant, lensed background galaxies. In principle, cluster lenses may provide a means to study normal galaxies at high redshift (); galaxies that would be out of reach of even our largest telescopes if not for the magnification of the lensing clusters. These galaxies are likely to be free from selection effects since they lie serendipitously behind the foreground clusters and are not selected because they are intrinsically bright, or are luminous radio or X-ray emitters. The majority of the arcs and arclets discovered so far are very blue, and are believed to come from the ubiquitous background population of faint blue galaxies (FBGs) seen in deep field galaxy surveys (Tyson 1988; Colless et al. 1990 and 1993; Lilly, Cowie & Gardner 1991; Koo and Kron 1992; Lilly et al. 1995 among others). It may be possible to use gravitational lensing to constrain the redshift range of the FBGs by examining the frequency of lensing as a function of cluster redshift (i.e.: Tyson, Valdes & Wenk, 1990; Miralda-Escudè 1993b; Smail, Ellis and Fitchett, 1994). But for all its potential as a probe of distant galaxies, cluster gravitational lensing is presently finding its most useful application as a tool for studying the clusters themselves. Cluster lens systems are relatively common compared to lensed QSOs because the high space density of the faint blue galaxies provides a convenient background grid whose distortion we can observe around any sufficiently massive and concentrated foreground cluster. Lensing can be used to measure the cluster mass, independent of assumptions about virialization of the galaxies or hydrostatic equilibrium of the hot X-ray-emitting intracluster gas. Moreover, gravitational lensing provides a means to explore the actual shape of a cluster’s total mass distribution, both visible and dark matter, at small radii ( kpc) using strong gravitational lensing (giant arcs), and at large radii using weak gravitational lensing (Miralda-Escudè 1991 & 1992; Kaiser, 1992; Kaiser & Squires 1993; Mellier et al. 1994; Broadhurst, Taylor & Peacock 1994; Smail, Ellis, & Fitchett, 1994; Kaiser, Squires & Broadhurst 1996; Schneider, 1996; Squires et al. 1996a and 1996b, Squires et al. 1997; Geiger & Schneider, 1998; Clowe et al. 1998).
Clearly, a large, homogeneous sample of clusters of galaxies spanning a broad range of redshift would be extremely valuable. Previous attempts to investigate the statistics or frequency of lensing have relied on optically-selected clusters with all of the problems inherent to the optical selection (see Lynds & Petrosian 1989; Smail et al. 1991). It is well known that projection and contamination problems can be avoided if clusters are selected based on their primary baryonic constituent—the hot, intracluster gas that is a copius emitter of X-rays—rather than on the optical galaxies which are merely trace components. We entered this investigation with two primary goals: first, to discover new cluster lens systems, and second, to systematically study a complete sample of distant clusters whose selection criteria were well defined and designed to avoid the contamination and superposition problems. The sample was selected from the Einstein Observatory Extended Medium Sensitivity Survey (EMSS) list of clusters given by Gioia et al. (1990a).
Le Fèvre et al. (1994) presented preliminary results from an analysis of lensing in a subsample of the 16 most X-ray luminous and distant EMSS clusters (0.2 and erg s-1). Note, however, that this subsample was extracted from the list of Henry et al. (1992) and did not include the 3 added clusters with 0.5 (MS 1137+66, MS 045103, MS 105403; Gioia & Luppino 1994) since their redshifts were not known at the time. For the most part, the Le Fèvre et al. data consisted of and “snapshots” taken with the CFHT that allowed identification of the brightest arcs that might be present in these clusters. From this preliminary subsample, they concluded that bright arcs with large axis ratios () were fairly common in X-ray selected clusters, and that this high frequency of lensing implied that the mass density profiles of the lensing clusters must be compact ( kpc; see also Hammer et al. 1993; Wu & Hammer 1993; Hammer et al. 1997).
In this paper, we present the results from the 38-cluster sample. In §2, we discuss the properties of the EMSS galaxy cluster sample and our selection criteria for this survey. We describe the optical observations and data reduction and calibration in §3. In §4, §5 and §6 we present our data and describe in detail those clusters that contain giant arcs. In addition to the obvious lensing cases, we also describe those systems with candidate arcs whose lensing origin needs follow-up confirmation, either with deeper imaging or spectroscopy. In §7, we investigate the lensing fraction as a function of both redshift and X-ray luminosity. We also discuss the constraints the EMSS cluster lenses place on the cluster mass density profiles. Finally, in §8, we summarize our results and discuss the prospects for future work.
Throughout this paper, we assume a cosmology where =50 km s-1 Mpc-1, =, but we occasionally use both conventional parameterizations of the Hubble constant, and , depending on the context of the discussion.
2 The EMSS arc survey cluster sample
The Einstein Observatory Medium Sensitivity Survey (EMSS; Gioia et al. 1990a, Stocke et al. 1991, Maccacaro et al. 1994) has been for many years the only large and sensitive X-ray catalog from which an X-ray selected sample of distant clusters can be drawn. Consequently, the EMSS cluster sample has been under study by a number of groups for a variety of cosmological investigations (Annis 1994; Gioia et al. 1990b; Henry et al. 1992; Vikhlinin et al. 1998b; Henry, 1997; Fahlman et al. 1994; Luppino & Kaiser 1997; Clowe et al. 1998; Luppino & Gioia 1995; Carlberg et al. 1997a, 1997b and 1998; Donahue et al. 1998). These investigations range from the study of galaxy evolution in X-ray selected clusters, in evolution of the X-ray luminosity and of the temperature function of clusters, in detection of weak gravitational lensing and consequent mass estimates, to determination of cluster virial masses and of the cosmological density parameter . Some of these studies have made X-ray followed up observations of individual clusters using theROSAT or ASCA satellites (Donahue & Stocke 1995; Donahue 1996; Donahue et al. 1998; Gioia et al. 1998a).
Until the ROSAT North Ecliptic Pole (NEP) region (Henry et al. 1995; Mullis, Gioia & Henry 1998) of the all-sky survey is completely identified, the EMSS is the only large and sensitive X-ray catalog from which an X-ray selected sample of distant clusters can be drawn. Even if there are several EMSS-style cluster surveys working from the ROSAT data archive of pointed observations (Rosati et al. 1995 and 1998; Scharf et al. 1997; Collins et al. 1997; Vikhlinin et al. 1998a), most of these are still works in progress and do not cover a large area of sky ( 700 square degrees) as the EMSS, with the exception of the Vikhlinin et al. sample which covers about 160 square degrees, a fourth of the EMSS area.
During the course of this survey, the total number of clusters in the sample has fluctuated slightly. We added new distant EMSS clusters that previously had no measured redshift, but were obviously at distances 0.5 and, from their detected X-ray flux, clearly met our selection criteria. We also removed sources that, after follow-up observations, turned out not to be clusters. For example, three of the sources listed in Gioia and Luppino (1994), MS 12093917, MS 13331725 and MS 16106616, were removed from the cluster list after ROSAT observations revealed the they are unresolved (MS 120939 has been identified with a Bl Lac object by Rector, Stocke & Perlman, 1998, MS 13331725 is a star and MS 161066 is still unidentified).
There are presently 100 EMSS sources classified as clusters. The cluster subsample we chose for the arc survey was subjected to the following criteria. First, the sources had to lie North of declination to be observable from Mauna Kea. Second, the fluxes of the sources in the IPC detection cell had to exceed erg cm-2 s-1 after converting from IPC counting rates with a thermal spectrum of 6 keV temperature and correcting for the galactic absorption in the direction of each source, but with no IPC point response function correction applied. Third, we restricted our sample to clusters with redshifts 0.15, and fourth, we required that the X-ray luminosity be greater than erg s-1 to select for deep potential wells which are most likely to exhibit gravitational lensing. These criteria resulted in 38 clusters spanning a large redshift range () and an order of magnitude in X-ray luminosity (). For each of the 38 clusters optical, radio and X-ray data can be found in Gioia & Luppino (1994), including wide field CCD images (1 Mpc1 Mpc in the cluster frames).
Although we used X-ray selection to avoid obvious optical selection effects, it would not be fair to claim that the EMSS cluster sample is completely free from selection biases. As pointed out by Donahue, Stocke & Gioia (1992; hereafter DSG), the EMSS is not, strictly speaking, a flux limited sample. Instead, the detection of EMSS sources is limited by central surface brightness. Consequently, there may be a bias toward clusters with centrally peaked X-ray surface brightness since the EMSS detection algorithm was optimized for detecting point sources in the IPC detection cell. Clusters with more extended emission at lower surface brightness would have been resolved by the detector and may have been missed by failing to meet the minimum detection criterion in the central cell (note that this problem is more severe at lower redshifts). One might argue that the EMSS might preferentially select cooling flow clusters (Pesce et al. 1990; Edge et al. 1992) given the possible bias toward centrally peaked objects. DSG, however, make compelling arguments for why EMSS clusters cannot all be cooling flow clusters; namely that there do exist non-cooling flow clusters with large and small core radii. Moreover, clusters with large core radii tend to have lower and thus would be excluded from the EMSS sample for that reason. Additional evidence that the EMSS does not miss clusters which are not cooling flow clusters is given by the agreement between the X-ray luminosity function of the EMSS clusters with 0.140.2, and the X-ray luminosity function derived by earlier studies (Piccinotti et al. 1982) which use large-beam, non-imaging detector fluxes or with the X-ray luminosity function of the ROSAT Brightest Cluster Sample (Ebeling et al. 1997). The agreement indicates that this bias, if present in our sample, is small, or at least it is at work in the same manner in the non-imaging and in the ROSAT data.
3 Observations
Imaging observations of the clusters were carried out during the period from May of 1992 through January of 1994 using the University of Hawaii (UH) 2.2m telescope equipped with a Tektronix 2048 2048 pixel thinned, back-illuminated, anti-reflection-coated CCD mounted at the f/10 Cassegrain focus. The image scale was /24m-pixel and the field of view was ( Mpc Mpc at =0.15 and Mpc Mpc at =0.82). band images of all, and band images of most of the clusters were acquired using this configuration. We also took additional and images of a few selected clusters using both the UH 2.2 m and HRCam (McClure et al. 1989) on the CFHT. In total, there were 8 observing runs: May, June, September and October of 1992, February, May and November of 1993, and January of 1994. The majority of the data are of excellent quality. Except for the February 1993 run, the images were taken in photometric conditions and in good seeing. The seeing ranged from to FWHM with a median value of FWHM. The seeing for the images was slightly worse with a median of FWHM.
We chose the and bandpasses for the following reasons. The bandpass is ideal for observing the distant clusters in the redshift range spanned by the EMSS sample. Furthermore, the center wavelength of the filter occurs near the peak of the CCD quantum efficiency, and the night sky is darker than in a redder bandpass such as . Although gravitationally lensed arcs are known to be relatively blue, they are still easily detected in the band. The additional or band images were taken to allow us to recognize any gravitational arcs by their relative blue color compared to the red cluster galaxies.
In order to build up our long exposures, we used the standard “shift-and-stare” or “dithering” technique where we took a number of short integrations (typically 600 s or 900 s each) with the telescope shifted 20–30′′ between exposures, allowing us to assemble a median-filtered stack of the disregistered images to use for flattening the data. Typically, the set of all images in a single color spanning an entire night, and often an entire run (50–100 frames), were used to build the median skyflat. Each separate cluster image was first bias subtracted and then flattened with the normalized median flat. The final image was then produced by shifting the individual images into registration (integer pixel shifts) and adding them while cleaning them of cosmic ray hits.
4 Properties of the clusters and arcs
In this section, we summarize the optical, X-ray and radio data for the 38 EMSS clusters, and describe in detail those sources classified as gravitational lens systems. Updated optical coordinates for these clusters can be found in Gioia & Luppino (1994). The general properties of the clusters are presented in Table 1. Columns (1) and (2) list the name and redshift of each EMSS cluster. Columns (3), (4) and (5) contain the X-ray properties of the cluster: the detected flux in the IPC cell () and total flux () in erg cm-2 s-1, and the corrected cluster X-ray luminosity () in the 0.33.5 keV band in erg s-1 respectively. The total flux and X-ray luminosity have been corrected following the prescription outlined by Gioia et al. (1990b) and Henry et al. (1992), which accounts for any extended cluster emission that may have been present outside the IPC detect cell. This correction can be substantial at low redshift (0.2) but is small at high redshift.
![[Uncaptioned image]](/html/astro-ph/9812355/assets/x1.png)
Column (6) lists the Hα[NII] luminosities (in erg s-1) taken from Donahue, Stocke & Gioia (1992) who interpreted this line emission as evidence for a cooling flow. Not all of the clusters in our sample were observed by DSG, so only those clusters with an entry in this column have cooling flow measurements. Column (7) contains the 6 cm radio flux measured with the (Gioia et al. 1983; Stocke et al. 1991; Gioia & Luppino 1994). Columns (8) and (9) indicate the quality of the optical data on each cluster by listing the and limiting magnitudes () and the seeing. We obtained images for all 38 of the clusters, but images for only 22. For many of the clusters, however, we do have and/or images, and in several cases, these are quite deep. Finally, in column (10), we list the number of arcs () and arclets () seen in each cluster. The () and () symbols that precede some of the cluster names indicate those clusters that have giant arcs or candidate arcs and appear in Figures 2 and 6, and in Figures 7 and 8, respectively. For the purposes of this investigation, we define a giant arc as a large, elongated structure having a length 8′′ and an axis ratio . We consider both high surface brightness (“luminous”) arcs and fainter, low surface brightness ones as well. Arclets are simply short arcs (8′′) with axis ratios 310. The clusters in Table 1 have considerable variation in their optical appearance, ranging from poor, compact groups to rich regular and irregular clusters. Cases of multiple nucleus cD galaxies, and clusters with optical substructure exist. Eventually, a quantitative morphological classification (e.g. Bautz-Morgan) would be desirable, but such a classification requires galaxy photometry and often spectroscopy (to verify the cluster membership of the brightest galaxies) and is beyond the scope of this paper. We refer the reader to the band optical images published in Gioia & Luppino, 1994.
5 Clusters with giant arcs
Eight of the 38 EMSS clusters contain giant arcs. To extract quantitative information from cluster gravitational lenses, one needs a large, homogeneous, well-selected sample of clusters for which there exist measurements of the lengths, widths, radii of curvature, positions and orientations of any gravitational images. Arc lengths and widths are related to the size and ellipticity of the sources, while arc widths are also strongly affected by the steepness of the cluster mass density profile. The radii of curvature and orientation of the arcs depend primarily on the potential of the clusters, providing important clues about the density profile and mass substructure.
We note that making these measurements and attempting to force the often complex lensing configurations into a simplified geometry is difficult and problematic. We choose to list the arc location with respect to the brightest cluster member, which is often not the true center of mass. Measuring the arc length, width, and especially the radius of curvature is more difficult. The arcs often have structure along their length and variation in their width, and are usually too short for an accurate determination of their radius of curvature, . In spite of these difficulties, we at least attempt to estimate these quantities and list them in the tables for future use. We measure the arc total magnitudes by integrating all the flux from the arc to the point where the lowest isophote blends into the local sky background. In some cases where the arc is embedded in the halo of one or more galaxies, the flux from the arc is contaminated by light from this halo, and we attempt to subtract the halo flux in order to measure the true arc magnitude.
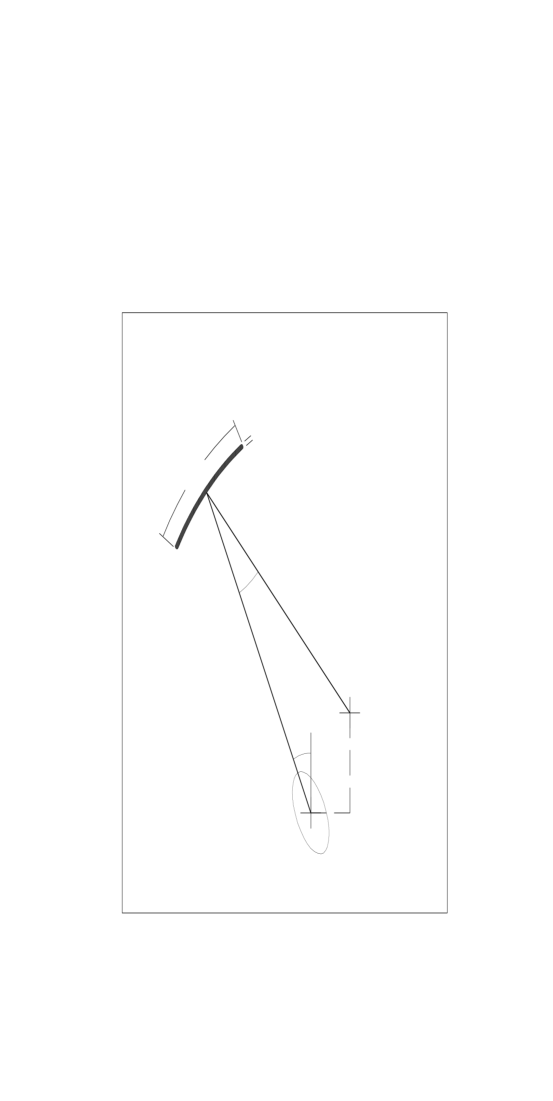
In Table 2 we list the observed properties of all the arcs in the eight clusters that contain at least one giant arc. Refer to the diagram in Figure 1 where we illustrate the various arc geometry terms. Columns (1), (2), and (3) contain the cluster name, the cluster (lens) redshift (), and the arc name or label respectively. The length, , seeing-deconvolved width, , axis ratio , and radius of curvature , are listed in columns (4), (5), (6) and (7). The radius of curvature can be determined by measuring the chord length across the two ends of the arc, and the sagittal depth from the arc to this chord, assuming the arc is circular. Column (8) contains the distance, , from the (approximate) center of the arc to the center of the cluster. Often the true cluster center is ill defined, so for our purposes, we take the position of the optically dominant galaxy as the cluster center unless otherwise specified. The angle listed in column (9) refers to the angular position of the center of the arc with respect to the center of the cluster, where 0o is defined as north and positive rotations are measured in the counterclockwise direction, while the angle , listed in column (10), is a measure of the orientation of the arc with respect to the cluster radius vector (again the ccw direction is positive). Column (11) contains the (approximate) position of the center of curvature (, ) with respect to the cluster center. These numbers are given in arcsec with E and N being the positive directions. Columns (12), (13) and (14) list the and magnitudes and colors of the arcs (note, and magnitudes for some of the arcs can also be found in Le Fèvre et al. 1994). Finally, column (15) contains references to more detailed studies for each cluster.

![[Uncaptioned image]](/html/astro-ph/9812355/assets/x4.png)
In the following subsections, we describe each giant arc system in detail.
5.1 MS 0302.71658
MS 0302.71658 at =0.426 was the first EMSS cluster found to contain a lensed arc (see Figure 2). The arc is first mentioned by Giraud (1991). Mathez et al. (1992) presented detailed observations of the cluster and 3 arcs: the long (), so-called “straight” arc A1 located between the two bright elliptical galaxies G1 and G2 (in the Mathez et al. labelling); a shorter arc A2 (8′′) to the south of the brightest cluster galaxy G1; and a faint arc A1W attached to the western end of A1. Giraud (1992) also showed limited evidence for variability in two additional arclets seen in images taken in 1989 and 1991. Models by Mathez et al. reproduce the geometry and shape of the arcs for assumed redshifts of 0.8 and 0.6 for A1 and A2 respectively.
In our -band CCD images taken in seeing we can easily see the 3 large arcs. We do not see the arclets mentioned by Giraud (1992). In Figure 3, we also show a true color image of the cluster core where we used the , and frames for the rgb colors. The giant arc between galaxies G1 and G2 (a combination of A1 and A1W) is over long and appears to be circular centered on G1. However upon closer inspection, we verify that the western and eastern components of A1 are both more-or-less straight and are folded at the point where they join to appear concave. Mathez et al. modeled the cluster potential as a bimodal configuration with the main mass deflector located near the position of the brightest cluster galaxy (BCG) and the secondary deflector located near the second ranked galaxy to the NW. This model is the simplest way to produce “straight” arc images as in the example of A2390 (Pello et al. 1991; Pierre et al. 1996).
Fabricant, Bautz & McClintock (1994) have obtained spectra of a number of galaxies in MS 03021658 (as well as the neighboring cluster MS 0302+1717) and find the cluster has a velocity dispersion of 921 km s-1. They also observe photometric and spectroscopic evidence of galaxy evolution (i.e. the Butcher-Oemler effect) with 20–30% of the galaxies having strong Balmer absorption and emission lines indicative of a recent episode of star formation. Carlberg et al. (1996) measure a lower value for the velocity dispersion of 64693 km s-1 using 27 galaxies. Ellingson et al. (1997) have produced a photometric and spectroscopic catalog for the galaxies in MS 03021658 bringing the total number of cluster members with measured redshifts to 94, but a new value for the velocity dispersion has not been published yet.
Kaiser et al. (1998) have performed a weak lensing study of the supercluster at 0.4 using deep and band images taken with the UH8K mosaic camera at the CFHT. The supercluster is composed by the three clusters MS 0302.71658 at z0.426, MS 0302.51717 at z0.425 (both X-ray selected) and of the optically selected cluster CL 030317, at z0.418, discovered by Dressler & Gunn in 1992. All of the major concentrations apparent in the X-ray and optical images are detected in the mass reconstructions, and indicate that most of the super-cluster mass, like the early type galaxies, is concentrated in the three X-ray clusters. A mean mass to light ratio for the clusters of M/LB 260h is obtained. The implication of the results for the cosmological density parameter is also discussed.
5.2 MS 0440.50204
MS 04400204 at =0.190 is an optically poor cluster with a compact, multiple-nucleus cD galaxy surrounded by a large halo in which are embedded a number of blue, circular structures that appear to be lensed arcs and arclets (Luppino et al. 1993). The largest arc has a length and remains unresolved in seeing. Most of the arcs and arclets lie on or near a 24′′ (100 kpc) radius critical line. Luppino et al. computed an enclosed mass and central mass-to-light ratio of and 110 respectively assuming a source redshift of . This cluster has been studied in detail by Gioia et al. (1998a) who present a combined analysis of X-ray imaging and spectroscopic data and HST data. From possible multiple images formed by gravitational lensing of five background sources, Gioia et al. derive limits to the mass distribution in the range 50100 kpc. For the central 100 kpc region, the possible range in projected mass is 6.69.5 M. At about 600 kpc from the center of the cluster a simple model fit to the X-ray data yields a mass of (1.30.2)1014 M. At 100 kpc, the lower limit mass from lensing is a factor 2 greater than the X-ray determined mass. In order to reconcile the different mass estimates, Gioia et al. tentatively explore a model where the mass profile increases more rapidly than the X-ray model at large radii.
5.3 MS 0451.60305
MS 0451.60305 is a spectacular example of a massive, X-ray-luminous, cluster of galaxies. The cluster has =0.55 and is therefore exceptionally luminous with erg s-1); the most luminous cluster in the EMSS and among the most luminous cluster X-ray source known.
The high X-ray luminosity is confirmed by Donahue & Stocke (1995) who obtained a 16 ksec ROSAT PSPC image of MS 04510305. They also see a slight elongation of the X-ray isophotes with roughly the same EW orientation as the optical galaxies. Donahue (1996) has also obtained ASCA data that yield a high value for the temperature of 10.41.2 keV. Combining the temperature of the gas with the image parameters of the ROSAT PSPC, Donahue obtains a total mass within a radius of 1 h Mpc of 9.7 h M. This value is in agreement with the masses implied by both the virial estimates using the velocity dispersion of 1371 km s-1 reported by the CNOC group (Carlberg et al. 1996, see also Ellingson et al. 1998, for a spectrophotometric catalog of the cluster galaxies) and with the weak lensing results by Clowe (1998).
Our deep CCD images reveal a rich cluster with a giant arc and at least one smaller arclet (see Figures 2, 4 and 5). A true color image is shown in Figure 4. This image is a 750 750 pixel subarray extracted from the much larger 20482 CCD frames, and was produced using the , , and CCD images (UH 88-inch) for the rgb colors. The integration times and seeing (FWHM) in the 3 colors were 4200 s and in , 7200 s and in , and 8400 s and in . The color image measures corresponding to 1.2 Mpc 1.2 Mpc in the cluster frame (7.39 kpc/arcsec at =0.55 for =50, =). The cluster has an obviously flattened (EW) morphology with red galaxies that are easily distinguished from the blue field population. Note that the core of the cluster appears to contain 2 bright galaxies, but the true color image reveals that the southern bright galaxy is quite blue and appears to be a foreground, face-on spiral.
The high contrast image in Figure 5 is the sum of the , and frames and is displayed to reveal the details of the giant arc, A1 and the bright arclet A2. Arc A1 is 9′′ long and is located =32′′ E of the brightest cluster galaxy. It appears to be marginally resolved, has variable surface brightness, and at least 1 break along its length. Upon close inspection, A1 appears to be another example of a “straight” arc, but precise measurement of the radius of curvature is difficult. We find a center-to-edge deviation from linearity of 1 pixel over the 41 pixel length of the arc, allowing us to place a lower limit on the radius of curvature of — only slightly larger than the distance to the BCG. Arclet A2 is 3′′.5 long, and is located 22′′ NW of the BCG. Lines drawn normal to this arclet and normal to arc A1 intersect at a point 7′′.5 W of the BCG. This point is 40′′ from A1 and is more consistent with the measured for A1. A2 also appears to be curved and its approximate center is consistent with this location.
In many ways, arc A1 resembles the original “straight” arc in the =0.231 cluster A2390 (Pello et al. 1991; Pierre et al. 1996). The A2390 arc is resolved, has breaks along its length, and has a spectroscopically-measured redshift of =0.913. Both the MS 04510305 arc A1 and the A2390 arc are orthogonal to the optical and X-ray major axes of their respective clusters (i.e. the arcs trace ellipses aligned with the optical and/or X-ray major axes). As we mentioned above, the lower limit on for A1 in MS 045103 is not significantly larger than the distance to the BCG and is reasonably consistent with the intersection point of the normals of A1 and A2. However, if , then, as in the case of A2390, we require a secondary mass concentration to the East of the cluster where there is no excess of optical galaxies, suggesting the presence of clumped dark matter.
However, a possible alternative way to produce nearly straight, elongated images is with a “marginal” lens (Kovner 1987b), i.e. a cluster with a relatively large core radius. In such cases, we would expect to see larger arc widths than with the small core radii clusters, whose arcs would be thin. Since the large arc in MS 045103 is marginally resolved, we must consider this situation seriously. Note, however, that the orientation of the arc, with respect to both the optical and X-ray major axes, supports our initial statement that the mass density profile is compact, and thus our interpretation that the shape of arc A1 implies mass substructure is the preferred one.
MS 0451.60305 is in the list of clusters detected by Doug Clowe (1998) using weak gravitational lensing. The mass distribution created with the Kaiser & Squires algorithm (1993) is centered on the bright central galaxy, but the broad EW structure evident in the galaxy distribution is absent. Instead a moderately large northern extension from the central peak present in the mass distribution is consistent with a (much weaker) structure seen in the cluster galaxy distribution.
5.4 MS 1006.01202
MS10061202 is a moderately luminous ( erg s-1) cluster at =0.221 with a flattened (NS), irregular morphology and an optical core containing a number of overlapped galaxy images, but with a central galaxy that has neither the size nor brightness to be called a cD. DSG have detected Hα and [NII] emission suggesting the presence of a cooling flow. Carlberg et al. 1996, measure a velocity dispersion of 906 km s-1 from 26 cluster members.
This cluster contains a remarkable assortment of faint, blue, linear structures that appear to be lensed images (Le Fèvre et al. 1994). There are three arclets, A1, A2, and A3, located 22′′–30′′ to the North of the BCG. All three arclets are oriented roughly perpendicular to the major axis of the optical galaxy distribution (see the image in Figure 2, this paper, and in Figure 1a in Le Fèvre et al.). The arclets have lengths ranging from 3′′.7 for A3 to 7′′.5 for A1. All three appear to be marginally resolved and have no apparent curvature, but they are so short that any slight curvature would be difficult to recognize. Furthermore, some portions of these arclets may be obscured by a bright (15) star located near the arclet positions. Presumably arclets A2 and A3 could be 2 pieces of the same large arc since lines extending perpendicular from the centers of these arclets intersect at the same point 58′′ to the SW, and the break between the two arclets occurs close to the foreground star. The length of A2 and A3 combined is 27′′. The longest single arc-like structure, A4, is located 67′′ NW of the BCG and is 10′′ long. There is some question whether this particular object is truly a gravitational lens image. The arc appears to be linear, with galaxies apparently at both ends, and might possibly be some kind of tidal tail from an interacting system. If A4 is a gravitational image, then this cluster may have a peculiar underlying mass distribution. The absence of curvature for A4 suggests the presence of a secondary deflector to the West, where there is no obvious excess of optical galaxies (see the wide field CCD image in Gioia & Luppino 1994). Furthermore, the orientation of A4 is odd when compared to the more-or-less orthogonal orientation of A1–3, although without detailed modelling, it is difficult to say anything quantitative at this time. Again, we note that an alternative interpretation is to consider this cluster an example of a marginal lens with a large core radius, rather than considering the absence of curvature in the arcs as evidence for invisible mass substructure.
5.5 MS 1358.46245
MS 13586245 is a very rich cluster at =0.328 and is extremely X-ray luminous with erg s-1. This cluster has been the focus of a number of investigations of galaxy evolution in distant, X-ray selected clusters (Luppino et al. 1991; Fabricant, McClintock & Bautz 1991; Annis 1994; Kelson et al. 1997), and displays the Butcher-Oemler effect with a photometrically and spectroscopically determined blue galaxy fraction of . During the course of these various investigations, lensed arcs were looked for but not seen, probably because the typical seeing in these data was of order 1.3′′–1.5′′. From WFPC2 images obtained with HST, Franx et al. (1997) discovered serendipitously an extremely red arc. Keck II spectra of the arc revealed to be the lensed image of a galaxy at z4.92, among the most distant galaxies known. Both Yee et al. 1998 and Fisher et al. 1998, have performed a spectroscopic survey of this rich cluster. Yee et al. find evidence for a second cluster at the same redshift as MS 13586245, located at the southern edge of the central cluster field. From their catalog of 232 cluster members Fisher et al. 1998 derive a mean redshift of z0.32830.0003 and a velocity dispersion of 1027 km s-1 in fair agreement the value of 98754 determined by Carlberg, Yee, & Ellingson 1997. Fisher et al. (1998) show that there is significant evidence for substructure in the central part of the cluster and that the distribution of line-of-sight velocities departs significantly from a Gaussian. They identify two subgroups with at least 1020 members and dispersions of 400 km s-1. Note that they concentrate on the main body of the cluster and that the second concentration found by Yee et al. south of the cluster center is outside the Fisher et al. field limits. The presence of two subclumps in the cluster, implies that MS 13586245 has not yet reached equilibrium and is still in the process of virialization and accretion of new members. van Dokkum et al. (1998) investigate the color-magnitude relation for MS 13586245 using a wide-field mosaic of multicolor WFPC2 images. A weak lensing study by Hoekstra et al. 1998, finds a total projected mass within 1 Mpc h of (4.40.6)M and a M/L ratio =(9013)h50 M/LV consistent with being constant with radius. These authors use the maximum probability extension of the original Kaiser & Squires (1993) algorithm and compare the resulting mass map to the result from a finite field construction algorithm developed by Seitz & Schneider (1996 and 1998). MS 13586245 was also studied with ROSAT and ASCA by Bautz et al. 1997, and by Allen (1998). The results by Allen, who takes into account the effects of cooling flows on the X-ray images and spectra, imply a projected mass of 4.2 M in excellent agreement with the weak lensing mass by Hoekstra et al. 1998.
As part of this survey, we obtained -band images in seeing with the UH 2.2 m telescope and -band images in seeing with HRCam on the CFHT. Although there are no bright arcs visible, we did find a large, very faint, curved arc located to the SW of the central galaxies, which corresponds to the red arc serendipitously discovered by Franx et al. 1997. The arc is barely discernable when the -band image is displayed with “normal” contrast at the top of Figure 6, but can be seen clearly in the high contrast image in the lower panel. The same faint, curved structure is also present in our -band CFHT images. The arc is located 23′′ (133 kpc) from the BCG and is 17′′ long with a small radius of curvature of (75 kpc). The center of curvature is displaced 13′′ SW of the BCG.
5.6 MS 1621.52640
MS16212640 is an optically rich cluster at =0.426 with one large, faint arc located close to the second brightest cluster galaxy (Luppino & Gioia 1992). The cluster X-ray luminosity is erg s-1. Note the listed in the original Luppino & Gioia (1992) paper assumed and used a point source correction rather than the cluster extended emission correction as applied later by Henry et al. (1992) and Gioia & Luppino (1994), and as used in this survey. Ellingson et al. (1997) published photometric and redshift catalogs of galaxies in the field of the cluster as part of the CNOC cluster redshift survey.
The arc is 9′′ long, has a patchy surface brightness, and has a very small radius of curvature (). The arc is located 14′′ from the BCG and the center of curvature appears to be located 3′′ S of galaxy 2, between it and the BCG.
5.7 MS 2053.70449
MS 20530449 has a redshift of =0.583 and an X-ray luminosity 5.78 erg s-1. It is not very optically rich, especially when compared with its other 0.5 EMSS counterparts like MS 0016+1609 or MS 04510305. Luppino & Gioia (1992) presented high resolution ( seeing) band images of MS 20530449 taken with HRCam on the CFHT that revealed a large arc-like structure located 16′′ from the BCG. The arc is 11′′ long and breaks into 2 distinct clumps, labeled A and B, with a center of curvature that appears to be close to the position of the BCG. Luppino & Gioia also noted a very faint arclet, labeled C, located closer in to the BCG.
Clowe (1998) presents a weak lensing study for this cluster which is the least massive of the z0.55 clusters in the EMSS. The mass profile, generated by aperture densitometry is well fit by a “universal” CDM profile (Navarro, Frenk & White, 1996) with parameters r200=520 h-1 kpc and c2 assuming a background galaxy redshift zbg=1.75. MS 20530449 is also well fit by an isothermal sphere model with a velocity dispersion of 700 km s-1 for zbg=1.75, indicating that the cluster is close to virialization.
Kelson et al. 1997, measure structural parameters and central velocity dispersions for the galaxies in MS 20530449 to define the fundamental plane relation in a cluster at intermediate redshift. They find that the fundamental plane relation of galaxies is very similar to that of Coma, suggesting that the structure of the early-type galaxies has changed little since z0.58.
5.8 MS 2137.32353
MS21372353 is a very X-ray luminous cluster ( erg s-1) at =0.313 with a large, curved arc and the first reported case of a radial gravitational image (Fort et al. 1992). The radial image is embedded in the halo of the optically dominant galaxy and is best seen in the HST image of Hammer et al. 1997.
The unique lensing configuration, with both a tangential and radial image and 3 arclets, allowed Mellier, Fort & Kneib (1993) to develop a tightly constrained mass distribution model with only 2 free parameters (core radius and velocity dispersion) that fit the large arcs and predicted the positions of the 3 arclets. Their model assumed an elliptical cluster potential (circular being ruled out due to the absence of a counter-arc). They found a centrally-peaked mass distribution with a finite core radius that has a value of kpc; considerably smaller than the core radii derived from X-ray measurements, and in agreement with the general trend that lensing clusters have centrally peaked mass density profiles. Allen (1998) shows that the strong gravitational lensing and X-ray mass measurements for this cooling-flow cluster are in excellent agreement, implying that the thermal pressure dominates over non-thermal processes in the support of the X-ray gas against gravity in the central regions of the cooling-flow clusters, and also validating the hydrostatic assumptions used in the X-ray mass determination.
Hammer et al. 1997 studied in detail the core of this cluster using WFPC2 images. An analysis of the lensing properties of the dark matter component indicates that within 30 to 150 h kpc from the mass center, the major axis and ellipticity of the dark matter component are in rather good agreement with those derived from X-ray and visible light, while the dark matter profile has a slope much flatter than that of the visible light (0.875 for the dark matter profile vs 1.35 for the visible light profile). MS21372353 is a good example of an essentially relaxed cluster, as is the case for cooling-flow clusters, with an increasing mass-to-light ratio from the very center to 150 h kpc.
6 Arclet and candidate lensing clusters
We believe that all 8 of the clusters in the previous section show clear examples of lensing. In this section, the situation is not so obvious. We present 8 additional clusters which contain structures we classify as arclets or candidate arcs. Of these 8 clusters, we are confident that at least 2 of them (MS 100812 and MS 123115) are true lens systems. The properties of the arclets and candidate arcs are listed in Table 3.
As mentioned earlier in §4, we define an arclet simply as a short arc with 8′′ and with an axis ratio 310. Although, as with the giant arcs, we do not discriminate between high and low surface brightness arclets (the former sometimes called “mini-arcs”; e.g. see Lavery, Pierce & McClure, 1993) for the most part our data are not deep enough (see limits in Table 1) for us to have detected faint arclet populations similar to the ones in A1689 (Tyson, Valdes & Wenk 1990; Tyson & Fischer 1995) or A2218 (Pello et al. 1992; Kneib et al. 1995; Kneib et al. 1996).
Most of the arclets we find do not display any obvious curvature, partly because they are short, but also possibly because of the presence of a secondary deflector along the line of sight. It is difficult, therefore, to distinguish these putative arclets from blue, edge-on disk galaxies, whether foreground, background, or cluster members, or possibly interacting or morphologically-disturbed systems. Although edge-on spirals often have well-defined nuclei, there are examples where no nucleus can be seen, and without additional information (e.g. spectra or infrared colors) these objects will be classified as arclets. However, we expect the number of cluster and projected edge-on spirals to be small (see discussion in Le Fèvre et al. 1994). Furthermore, we expect the real arclets to be oriented more-or-less perpendicular to the cluster radius vector. In the following subsections, we describe each arclet and candidate lensing cluster in detail.
Table 3. Candidate arcs and arclets (1) (2) (3) (4) (5) (6) (7) (8) (9) Photometry Cluster Arc References and Notes MS 0451.50250 1 5′′.0 0′′.9 5.5 21′′ 22.2 20.4 Le Fèvre et al. (1994) MS 0839.82938 1 3.8 3 radial arc?, buried in cD MS 0906.51110 1 25 23.6 MS 1008.11224 1 6.0 0.8 7.5 45 22.9 21.1 Le Fèvre et al. (1994) 2 6.0 0.6 10.0 53 23.4 22.1 MS 1231.31542 1 4.7 0.9 5.2 13 =22.4 buried in halo 2 5.3 0.8 6.6 26 =23.2 MS 1455.02232 1 7.5 1.3 6.7 21 22.9 Le Fèvre et al. (1994); Smail, Ellis & Fitchett (1994); Smail et al. (1995) MS 1546.81132 1 4.2 0.8 5.3 35 23.1 20.9 MS 1910.56736 1 6.1 0.6 10.5 67 20.6 Le Fèvre et al. (1994)
6.1 MS 0451.50250
This cluster lacks a well defined optical center. The X-ray emission is extended and may be associated with both the primary SW clump of galaxies and a secondary clump located to the NE where we find the candidate arclet. The two clumps are separated by 6′. The image of the candidate arclet shown in Figure 7 is the sum of the and frames. The arclet is located 21′′ to the NE of the large elliptical galaxy. We cannot rule out that this is simply an edge-on cluster spiral.
6.2 MS 0839.82938
The core of this rich, =0.194 cluster contains a number of short, blue, linear structures that may be arclets or edge-on spirals. The longest of these structures extends radially 3′′.8 (16 kpc) from the center of the cluster to the SE of the central cluster galaxy and may be another example of a radial arc (see Fig 7). We have also considered whether this structure could be a cooling flow filament, since the brightest cluster galaxy has strong [OII], Hα, and [NII] emission, that Nesci et al. (1989) interpreted as the signature of a large cooling flow. Recent ROSAT observations have confirmed this cooling flow exists (Nesci, Perola & Wolter 1995). When the central particle density in a cooling flow exceeds 5–6 cm-3, we expect to see strong optical emission lines (hydrogen recombination lines and collisionally excited forbidden lines) from a 10 kpc asymmetrically-extended region around the cluster BCG (Hu, Cowie & Wang 1985; Cowie et al. 1983). Such filaments have been seen in the narrow band images of EMSS cluster BCG’s taken by DSG, so it is possible that the radial structure in MS 08392938 is such a filament. For now, we tentatively classify this radial structure as a candidate radial arc, and we intend to obtain a spectrum which will allow us to distinguish between the lensing and cooling flow interpretations.
6.3 MS 0906.51110
MS 0906+1110 is a rich cluster with a large cD galaxy at =0.180. The X-ray luminosity is erg s-1. The cluster displays obvious optical substructure with a bright elliptical galaxy 95′′ to the SW and another bright elliptical nearly an equal distance to the NE, both along the major axis of the cD. These two galaxies are not visible in Fig. 7, but can be seen in the wide field image in Gioia & Luppino (1994). This cluster has no obvious giant arcs or bright arclets, but does contain a number of faint arclets arranged tangentially around the cD. The largest of these is labeled in Figure 7 and is listed in Table 3.
6.4 MS 1008.11224
MS 10081224 is a very rich cluster at =0.301 with erg s-1. Yee et al., 1998, measured 112 cluster member redshifts and give an updated z0.306. This cluster contains at least one obvious example of a lensed arclet, but no giant arcs (Le Fèvre et al. 1994). When displayed at high contrast, the cluster image exhibits a clear patterned circularity centered on the brightest cluster galaxy. The longest arclet located 51′′ to the North of the BCG is obviously curved. There is another bright, blue candidate arclet to the East of the BCG (see Figure 8).
6.5 MS 1231.31542
This =0.238 cluster contains a faint arc 4′′.7 long located midway between the two brightest cluster galaxies, a bright arclet 25′′.7 to the south of the BCG, and a faint arclet to the North of the second ranked galaxy. The faint arc and arclet are difficult to see in Figure 8 because they are embedded in the common halo of the cluster dumbbell galaxies. This cluster and lens system is similar to MS 0302+1658. Both clusters have a lensed arc or arclet midway between two nearly-equal-brightness dumbbell galaxies in the cluster core. With erg s-1, this cluster is one of the lowest EMSS clusters to display obvious lensing.
6.6 MS 1455.02232
This cluster was first discovered by Schild et al. (1980) and later observed by Mason et al. (1981) who measured the redshift of =0.259. MS 14552232 is among the most X-ray luminous clusters in the EMSS with erg s-1. It also has, by far, the largest narrow-band line emission luminosity in the cooling flow survey of DSG (see Table 1).
MS 1455+22 has been the focus of a weak lensing study by Smail, Ellis & Fitchett (1994) and Smail et al. (1995) using the weak lensing technique of Kaiser & Squires (1993). Smail et al. 1994 detect a clear lensing signal from the cluster and estimate a lower limit to the projected mass within the central 0.9 Mpc of 2.2 . However, their images only had a field of view of and so only cover the core of the cluster and do not provide any information about the mass distribution at large radii. Smail et al. 1995 have also presented ROSAT HRI data that detect extended emission out to 1 Mpc and resolve the central 50 kpc. Their data show the X-ray emission is highly peaked on the cD galaxy and confirm the cluster has a massive cooling flow of 630 yr-1.
This cluster contains a 7′′.5 long arc-like structure located 20′′ NE of the BCG (see Figure 7). This putative arc is also visible in Smail et al. images, which are considerably deeper than ours (for this particular cluster) and have comparable seeing. Upon close inspection, we notice what may be a galaxy nucleus to one side and the arc appears slightly curved, but in the direction away from the central galaxy. Although we include this arclet in our list of candidates, we consider this a questionable case.
6.7 MS 1546.81132
MS 154611 is a rich, elongated cluster with a large, double-nucleus cD galaxy. The ellipticity of the cD halo is oriented in the same direction (EW) as the elliptical distribution of the optical galaxies, and orthogonal to the 2 arc-like structures to the East of the cD. The largest candidate arc is 4′′.2 long, is bright, and appears to be marginally resolved. Again, this could simply be an edge-on cluster galaxy since it has a somewhat lenticular shape, but we see no obvious bright nucleus.
6.8 MS 1910.56736
This cluster at =0.246 has a double nucleus BCG and is rather poor with an irregular morphology. There are 2 elongated, linear structures located 1′ to the SE of the BCG. The northernmost object has an obvious core and looks like an edge-on spiral. The other object, however, is 6′′ long, has no apparent core, and appears unresolved. Le Fèvre et al. (1994) classified this object as a giant luminous arc since it had an axis ratio and was oriented perpendicular to the radius vector to the BCG. Our criteria in this paper, however, require that an object have to be called a giant arc. Furthermore, we believe the lensing explanation for this object is less convincing than in some of the other cases, particularly since the object has no apparent curvature.
7 Discussion
From inspection of Table 1, the lensing clusters do not peak around any preferred redshift, as might be expected if clusters are evolving with redshift (Bartelmann 1993; Wu 1993). It is apparent that although we have a substantial number of clusters at high redshift (5 with 0.5), completeness may be a problem beyond 0.350.4. The apparent increase in the lensing fraction with redshift is no doubt a selection bias, resulting from the fact that we can only see the most X-ray luminous clusters at the high redshifts, and these very luminous clusters are likely to be more massive, thus increasing our chances of finding lenses. This effect is illustrated by the dramatic increase in the lensing fraction with increasing . Three of the 5 EMSS clusters with 1045 erg s-1, and none of the 15 EMSS clusters with 41044 erg s-1 contain giant arcs. The giant arc lensing fraction for clusters having 41044 erg s-1 is 30%. Although the statistics are poor because the number of high- clusters is small, it appears that high X-ray luminosity does indeed point to the most massive clusters. We find no evidence of lensing in the 2 clusters beyond 0.7. One could interpret this as a real cutoff, thus constraining the redshift distribution of the background sources. The more likely explanation, however, is that our images for these clusters are simply not deep enough. For clusters beyond 0.7, the sources will be at 1-1.5 and consequently will be very faint with only the most luminous () galaxies visible. Deeper images will reveal faint arcs, if they exist, in these clusters as is the case of MS 1137+6625, at z0.78, where a system of giant arcs present in the core of the cluster is revealed by a 8700 s long exposure in R-band taken with the Keck II telescope (see Fig. 1 in Clowe et al. 1998).
A diagnostic of the mass density profile is provided by the arc widths (Hammer 1991). The observed width () of a lensed arc is related to the intrinsic source width () through the following relation, . All of the information on the mass density profile is contained in the so-called matter term which can vary from 0 to 0.5 for compact, singular point mass, singular isothermal sphere or profiles, or from 0.5 to 1 for a non-singular isothermal sphere. Therefore, if we assume that the arcs are drawn from a population of field galaxies whose intrinsic widths are more-or-less constant, then we see that more compact lenses produce thinner arcs. The majority of the arcs in this sample are thin, often unresolved or marginally resolved, even in 0′′.50′′.7 seeing. Thus, we find that the majority of the clusters must have compact cores. Obviously, the assumptions about the field galaxy sizes are critical in this interpretation. Hammer (1991) and Hammer et al. (1993) argue that faint field galaxies are in general resolved or marginally resolved with intrinsic FWHM of order 0′′.51′′ (Lilly, Cowie & Gardner 1991; Tresse et al. 1993; Colless et al. 1994), in agreement with our conclusions.
In addition to the arc widths, the arc locations, curvatures and orientations also depend on the mass density profile. The arc radius of curvature can be considered to be an upper limit to the cluster core radius (Bartelmann, Steinmetz & Weiss 1995). Furthermore, Miralda-Escudè (1993a) and Grossman & Saha (1994) show that when arcs trace ellipses whose major axes are aligned with the cluster major axis (i.e. the arcs are perpendicular to the cluster major axis), then the cluster mass density profile must be steeper than isothermal. If arcs trace ellipses aligned with the cluster minor axis, then the mass density profile is shallower than isothermal.
When we examine the giant arcs in our sample, we find none that are perpendicular to the cluster minor axis. In four of the giant arc clusters, the optical galaxy distribution is clearly elongated, and in these four clusters, the arcs are orthogonal to a radius vector that is more-or-less aligned with the optical (and in MS 04510305, the X-ray as well) major axis. The other four giant arc clusters have no obvious optical axis of symmetry. Similarly, the arclets and candidate arcs also tend to be normal to the cluster major axis, in the cases where a cluster has a clear axis of symmetry. From this evidence, we conclude that in most our examples of lensing, the mass density profiles appear to be steeper than isothermal. Of course, in arriving at this conclusion, we are assuming that the optical galaxies are tracing the total cluster mass. We also point out, however, that several of the clusters (e.g. MS 213723 and MS 0839+29) may contain radial gravitational images, which requires a cluster density profile with a finite core radius (e.g. Grossman & Saha 1994; Mellier, Fort & Kneib 1993).
8 Summary and Conclusions
We have presented the results of our systematic search for lensed arcs and arclets in a large, homogeneous, X-ray-selected sample of 38 distant clusters of galaxies. Below, we summarize our conclusions.
-
1.
Our survey has yielded 8 clusters with giant arcs, 2 clusters with arclets, and 6 candidate lensing systems.
-
2.
Our results indicate that high X-ray luminosity (41044 erg s-1) does indeed identify the most massive clusters, and thus X-ray selection is the preferred method for finding true, rich clusters at intermediate and high redshifts.
-
3.
The majority of the arcs in our sample have large axis ratios, are thin, and in those clusters with obvious optical axes of symmetry, the arcs tend to be oriented orthogonal to the optical major axis. Furthermore, the high lensing frequency in our sample (21% giant arcs in the entire sample, 30% giant arcs for clusters with 41044 erg s-1, 60% for clusters with 11045 erg s-1) is consistent with the lensing frequency predicted by statistical models that assume clusters have compact cores.
However, our conclusion that the central regions of these clusters have compact mass density profiles does not preclude the presence of large, extended dark matter halos that is convincingly demonstrated to exist through the detection of weak lensing at large radii (Smail, Ellis, & Fitchett, 1994; Kaiser, Squires & Broadhurst 1996; Squires et al. 1997; Geiger & Schneider, 1998; Clowe et al. 1998; Kaiser et al. 1998).
Future observations and theoretical modelling will provide important information on these cluster lenses. We are presently acquiring optical spectra of the clusters and arcs with the CFHT and Keck telescopes in order to measure the arc redshifts and the cluster velocity dispersions. These spectra will allow us to confirm the lensing hypothesis, epecially for the candidate arcs and arclets, and will be crucial for theoretical modelling of the more interesting lensing configurations.
Acknowledgements.
We thank the UH Time Allocation Committee for their generous allocation of UH 2.2 m and CFHT time for this project. We also thank John Stocke and Simon Morris for sharing their data, particularly the MS045103 redshift, prior to publication. We have enjoyed fruitful discussions and interactions with Megan Donahue, Anna Wolter, Pat Henry, Neal Trentham, and with our CNOC colleagues (E. Ellingson, H. Yee, R. Carlberg, R. Abraham) and others (N. Kaiser, Y. Mellier, B. Fort). We are grateful to all those (P. Henry, B. Tully, L. Kofman, J. Dalcanton, L. Cowie, M. Metzger, S. Miyazaki) who read and commented on early drafts of this paper, and to Doug Clowe, who helped with preliminary FOCAS analysis of some of the clusters. Finally, we appreciate the patience and generosity of Brent Tully who allowed us to “take an image or two” during several of his observing runs. The UH CCD cameras were constructed using NSF Grant AST-9020680. This work also received partial financial support from NASA-STScI grant GO-05987.02-94A, NSF Grants AST-9119216 and AST-9500515, NASA Grants NAG5-2594, NAG5-2914, and ASI grants ARS-94-10 and ARS-96-13.References
- (1) Allen, S.W., 1998, MNRAS, 296, 392
- (2) Annis, J. 1994, PhD Thesis, University of Hawaii.
- (3) Bartelmann, M. 1993, A&A, 276, 9.
- (4) Bartelmann, M., Steinmetz, M. & Weiss, A. 1995, A&A, 297, 1.
- (5) Bautz, M., Honda, E., Ventrella, J. & Gendreau, K., 1997, on “X-ray Imaging and Spectroscopy of Cosmic Hot Plasma”, Proceedings of the International Symposium on X-ray astronomy, Universla Academy Press Publ., Eds. Makino, F. and Mitsuda, K., p. 75.
- (6) Broadhurst, T., Taylor, A., & Peacock, J. 1995, ApJ, 438, 49.
- (7) Carlberg, R., Yee, H., Ellingson, E., Abraham, R., Gravel, P., Morris, S. & Pritchet, C.J., 1996, ApJ, 462, 32.
- (8) Carlberg, R., Yee, H., & Ellingson, E., 1997, ApJ, 478, 462.
- (9) Carlberg, R.G., Yee, H.K.C., Ellingson, E., Morris, S.L., Abraham, R., Gravel, P., Pritchet, C., Smecker-Hane, T., Hartwick, F., Hutchings, J., Oke, J.B. (the CNOC cluster collaboration) 1997a ApJL, 485, L13.
- (10) Carlberg, R.G., Morris, S.L., Yee, H., & Ellingson, E., 1997b ApJL, 479, L19.
- (11) Carlberg, R., et al. , 1998, in “Large Scale Structure: Tracks and Traces”, Proceedings of the 12th Potsdam Cosmology Workshop, 1997, Eds. V. Mueller, S. Gottloeber, J.P. Muecket, J. Wambsganss, World Scientific 1998, p. 119-126.
- (12) Castander, F., Ellis, R., Frenk, C., Dressler, A., & Gunn, J. 1994, ApJL, 424, L79.
- (13) Colless, M., Ellis, R., Taylor, K. & Hook, R., 1990, MNRAS, 244, 408.
- (14) Colless, M., Ellis, R., Broadhurst, T., Taylor, K., and Peterson, B. 1993, MNRAS, 261, 19.
- (15) Colless, M., Schade, D., Broadhurst, T. & Ellis, R. 1994, MNRAS, 267, 1108.
- (16) Clowe, D.I., 1998, PhD thesis, University of Hawaii.
- (17) Clowe, D.I., Luppino, G., Kaiser, N., Henry, J.P. & Gioia, I.M., 1998, ApJL, 497, L61.
- (18) Colless, M.M., Ellis, R.S., Taylor, K. & Hook, R.N., 1990, MNRAS, 244, 408.
- (19) Colless, M.M., Ellis, R.S., Broadhurst, T., Taylor, K. & Peterson, B.A., 1993, MNRAS, 261, 19.
- (20) Collins, C. A., Burke, D. J., Romer, A. K., Sharples, R. M., & Nichol, R. C. 1997, ApJL, 479, L117.
- (21) Cowie, L., Hu, E., Jenkins, E., York, D. 1983, ApJ, 262, 29.
- (22) Donahue, M., Stocke, J., & Gioia, I. 1992, ApJ, 385, 49.
- (23) Donahue, M. & Stocke, J. 1995, ApJ, 449, 554.
- (24) Donahue, M.E., 1996, ApJ, 468, 79.
- (25) Donahue, M.E., Voit, M., Gioia, I.M., Luppino, G.A., Hughes, J.H. & Stocke, J.T., 1998, ApJ, 552, 550.
- (26) Dressler, A. & Gunn, J. 1992, ApJS, 78, 1.
- (27) Ebeling, H., Edge, A.C., Fabian, A.C., Allen, S.W., Crawford, C. S. & Boheringer, H., 1997, ApJL, 479, L101.
- (28) Edge, A.C., Stewart, G.C. & Fabian, A.C., 1992, MNRAS, 258, 157.
- (29) Ellingson, E., Yee, H. K. C., Abraham, R. G., Morris, S. L., Carlberg, R. G. & Smecker-Hane, T. 1997, ApJS, 113, 1.
- (30) Ellingson, E., Yee, H.K.C., Abraham, R., Morris, S.L. & Carlberg, R.G., 1998, ApJS, 116, 247.
- (31) Fabricant, D., McClintock, J. & Bautz, M. 1991, ApJ, 381, 33.
- (32) Fabricant, D., Bautz, M. & McClintock, J. 1994, AJ, 107, 8.
- (33) Fahlman, G., Kaiser, N., Squires, G. & Woods, D. 1994, ApJ, 437, 56.
- (34) Fisher, D., Fabricant, D., Franx, M. & van Dokkum, P., 1998, ApJ, 498, 195.
- (35) Fort, B., LeFevre, O., Hammer, F. & Cailloux, M. 1992, ApJL, 399, L125.
- (36) Franx, Marijn, Illingworth, G.D., Kelson, D.D., van Dokkum, P.G. & Tran, K.V.Y, 1997, ApJL, 486, L75.
- (37) Geiger, B. & Schneider, P., 1998, MNRAS, 295, 497.
- (38) Gioia, I., Feigelson, E., Maccacaro, T., Schild, R. & Zamorani, G. 1983, ApJ, 271, 524.
- (39) Gioia, I. M., Maccacaro, T., Schild, R.E., Wolter, A., Stocke, J.T., Morris, S. L. & Henry, J. P. 1990a, ApJS, 72, 567.
- (40) Gioia, I.M., Henry, J. P., Maccacaro, T., Morris, S., Stocke, J., & Wolter, A. 1990b, ApJL, 356, L35.
- (41) Gioia, I. & Luppino, G. A. 1994, ApJS, 94, 583.
- (42) Gioia, I.M., Shaya, E., Le Fèvre, O., Falco, E.E., Luppino, G.A. & Hammer, F., 1998a, ApJ, 497, 573.
- (43) Gioia, I.M., Henry, J. P., Mullis, C.R., Ebeling, H. & Wolter, A., 1998b, AJ, in press.
- (44) Giraud, E. 1991, ESO Messenger, 66.
- (45) Giraud, E. 1992, A&A 259, L49.
- (46) Grossman, S. & Saha, P. 1994, ApJ, 431, 74
- (47) Hammer, F. 1991, ApJ, 383, 66.
- (48) Hammer, F., Angonin-Willaime, M.C., Le Fèvre, O., Wu, X.P., Luppino, G.A. & Gioia, I.M. 1993, in Gravitational Lenses in the Universe, 31st Liege Int. Astroph. Colloquium, Université de Liège, eds. J. Surdej, D. Fraipont-Caro, E. Gosset, S. Refsdal and M. Remy, 609.
- (49) Hammer, F., Gioia, I.M., Shaya, E.J., Teyssandier, P., Le Fèvre, O. & Luppino, G.A., 1997, ApJ, 491, 477.
- (50) Henry, J.P., 1997, ApJL, 489, L1.
- (51) Henry, J. P., Gioia, I. M., Maccacaro, T., Morris, S. L., Stocke, J. T. & Wolter, A. 1992, ApJ, 386, 408.
- (52) Henry, J.P., Gioia, I.M., Huchra, J.P., Burg, R. McLean, B., Boehringer, H., Bower, R.G., Briel, U.G., Voges, W., MacGillivray, H. & Cruddace, R.G., 1995, ApJ, 449, 422.
- (53) Hoekstra, H., Franx, M., Kuijken, K. & Squires, G., 1998, ApJ, 504, 636.
- (54) Hu, E., Cowie, L. & Wang, Z. 1985, ApJS, 59, 447.
- (55) Kaiser, N., 1992, ApJ, 388, 272.
- (56) Kaiser, N. & Squires, G. 1993, ApJ, 404, 441.
- (57) Kaiser, N., Squires, G. & Broadhurst, T., 1996, ApJ, 449, 460.
- (58) Kaiser, N., Wilson, G., Luppino, G., Kofman, L., Gioia, I.M., Metzger, M. & Dahle, H., 1998, ApJ, submitted, astro-ph/9809268.
- (59) Kelson, D.D., van Dokkum, P.G., Franx, M. & Fabricant, D., 1997, ApJL, 478, L13.
- (60) Kneib, J.P., Mellier, Y., Pello, R., Miralda-Escudè, J., Le Borgne, J.-F., Bohringer, H. & Picat, J.-P., 1995, A&A, 303, 27.
- (61) Kneib, J.P., Ellis, R.S., Smail, I., Couch, W.J. & Sharples, R.M., 1996, ApJ, 471, 643.
- (62) Koo, D.C. & Kron, R.G., 1992, ARA&A, 30, 613.
- (63) Kovner, I. 1987, ApJ, 321, 686.
- (64) Lavery, R., Pierce, M., and McClure, R. 1993, ApJ, 418, 43.
- (65) Le Fèvre, O., Hammer, F., Angonin, M.C., Gioia, I.M. & Luppino, G. A., 1994, ApJL, 422, L5.
- (66) Lilly, S.J., Cowie, L. & Gardner, 1991, ApJL, 369, L79.
- (67) Lilly, S.J., Tresse, L., Hammer, F., Crampton, D. & Le Fèvre, O., 1995, ApJ, 455, 108.
- (68) Luppino, G., Cooke, B., McHardy, I., and Ricker, G. 1991, AJ 102, 1.
- (69) Luppino, G. A. & Gioia, I. M. 1992, A&A, 265, L9.
- (70) Luppino, G., Gioia, I., Annis, J., Le Fèvre, O., & Hammer, F., 1993, ApJ, 416, 444.
- (71) Luppino, G.A. & Gioia, I.M. 1995, ApJL, 445, L77.
- (72) Luppino, G.A. & Kaiser, N., 1997, ApJL, 475, L20
- (73) Lynds, R. & Petrosian, V. 1989, ApJ, 336, 1.
- (74) Maccacaro, T., Wolter, A., McLean, B., Gioia, I., Stocke, J., Della Ceca, R., Burg, R. & Faccini, R. 1994, Astrophys. Letters and Comm., Gordon & Breach Pubs., 29, N. 5-6, 267.
- (75) Mason, K., Spinrad, H., Bowyer, S., Reichert, G., & Stauffer, J. 1981, AJ, 86, 803.
- (76) Mathez, G., Fort, B., Mellier, Y., Picat, J.-P. & Soucail, G. 1992, A&A, 256, 343.
- (77) McClure, R., Grundmann, W., Rambold, W., Fletcher, J., Richardson, H., Stilburn, J., Racine, R., Christian, C., & Waddell, P., 1989, PASP, 101, 1156.
- (78) Mellier, Y., Fort, B. & Kneib, J.-P. 1993, ApJ, 407, 33.
- (79) Mellier, Y., Fort, B., Bonnet, H. & Kneib, J.-P. 1994, in Cosmological Aspects of X-ray Clusters of Galaxies, NATO Advanced Study Institute, ed W.C. Seitter, 219.
- (80) Miralda-Escudè , J., 1991, ApJ, 370, 1.
- (81) Miralda-Escudè , J. 1992, ApJL, 390, L65.
- (82) Miralda-Escudè , J. 1993a, ApJ, 403, 497.
- (83) Miralda-Escudè , J. 1993b, ApJ, 403, 509.
- (84) Mullis, C.R., Gioia, I.M. & Henry, J.P. 1998, in IAU Symposium 188 “The Hot Universe”, Kyoto, 1997, Aug 26-30.
- (85) Navarro, J.F., Frenk, C.S. and White, S.D.M., 1996, ApJ, 462, 563.
- (86) Nesci, R., Gioia, I., Maccacaro, T., Morris, S., Perola, G., Schild, R. & Wolter, A. 1989, ApJ, 344, 104.
- (87) Nesci, R., Perola, G. & Wolter, A. 1995, A&A, 299, 34.
- (88) Pello, R., LeBorgne, J.-F., Soucail, G., Mellier, Y. & Sanahuja, B. 1991, ApJ, 366, 405.
- (89) Pello, R., LeBorgne, J., Sanahuja, B., Mathez, G. & Fort, B. 1992, A&A, 266, 6.
- (90) Pesce, J.E., Fabian, A. C., Edge, A. C. & Johnstone, R. M. 1990, MNRAS, 244, 58.
- (91) Piccinotti, G., Mushotzky, R., Boldt, E., Holt, S., Marshall, F., Serlemitsos, P. & Shafer, R. 1982, ApJ, 253, 485.
- (92) Pierre, M., Le Borgne, J.J., Soucail, G. & Kneib, J.P., 1996, A&A, 311, 413.
- (93) Rector, T.A., Stocke, J.T. & Perlman, E., 1998, ApJ, submitted
- (94) Rosati, P., Della Ceca, R., Norman, Colin & Giacconi, R., 1995, ApJL, 445, L11
- (95) Rosati, P., Della Ceca, R., Norman, Colin & Giacconi, R., 1998, ApJL, 492, L21
- (96) Scharf, C.A., Jones, L.R.L., Ebeling, H., Perlman, E., Malkam , M. & Wegner, G. 1997, ApJ, 477, 79.
- (97) Schild, R., Leach, R., Weekes, T. & Gursky, H. 1980, AJ, 85, 121.
- (98) Schneider, P., 1996, MNRAS, 283, 837.
- (99) Seitz, S. & Schneider, P. 1996, A&A, 305, 383.
- (100) Seitz, S. & Schneider, P. 1998, astro-ph/9802051.
- (101) Smail, I., Ellis, R. S., Fitchett, M. J., Norgaard-Nielsen, H. U., Hansen, L. & Jorgensen, H. E. 1991, MNRAS, 252, 19.
- (102) Smail, I., Ellis, R. & Fitchett, M. 1994, MNRAS, 270, 245.
- (103) Smail, I., Ellis, R., Fitchett, M. & Edge, A. 1995, MNRAS, 273, 277.
- (104) Squires, G., Kaiser, N., Fahlman, G., Babul, A., Woods, D., Neumann, D.M. & Bohringer, H., 1996a, ApJ, 461, 572.
- (105) Squires, G., Kaiser, N., Fahlman, G., Babul, A. & Woods, D., 1996b, ApJ, 469, 73.
- (106) Squires, G., Neumann, D.M., Arnaud, M., Babul, A., Bohringer, H. Fahlman, G. & Woods, D., 1997, ApJ, 482, 648.
- (107) Stocke, J.T., Morris, S.L., Gioia, I.M., Maccacaro, T., Schild, R.E., Wolter, A., Fleming, T.A. & Henry, J.P. 1991, ApJS, 76, 813.
- (108) Tresse, L., Hammer, H., Le Fèvre, O. & Proust, D. 1993, A&A, 277, 53.
- (109) Tyson, J. A., 1988, Nature, 334, 294.
- (110) Tyson, J.A., Valdes, F. & Wenk, R.A., 1990, ApJL, 349, L1.
- (111) Tyson, J.A. & Fischer, P., 1995, ApJ, 446, 55.
- (112) van Dokkum, P.G., Franx, M., Illingworth, G.D., Kelson, D.D., Fisher, D. & Fabricant, D., 1998, ApJ, 500, 714.
- (113) Vikhlinin, A., McNamara, B.R., Forman, W., Jones, C., Quintana, H. & Hornstrup, A., 1998a, ApJ, 502, 558.
- (114) Vikhlinin, A., McNamara, B.R., Forman, W., Jones, C., Quintana, H. & Hornstrup, A., 1998b, ApJL, 498, L21.
- (115) Wu, X. P. & Hammer, F. 1993, MNRAS, 262, 187.
- (116) Wu, X. P. 1993, A&A, 270, L1.
- (117) Yee, H. K. C., Ellingson, E., Morris, S.L., Abraham, R. & Carlberg, R. G., 1998, ApJS, 116, 211.