Cepheid Standard Candles
Abstract
Thanks to HST, there are now many galaxies with Cepheid distances and these provide the main platform for the calibration of the secondary distance indicators. I review recent progress in our understanding of the standard candle properties of Cepheids with particular emphasis on the techniques used in the HST studies. The PL relation defined by Cepheids in the LMC is shown to be excellent, although the distance to the LMC, which determines the zero-point, is still rather controversial. This LMC relation is consistent with the galactic calibrations which use Hipparcos parallaxes or Baade-Wesselink distances. However, the PL plot for Cepheids observed in galactic open-clusters is suggestive of an age dependence of the main-sequence fitting distances, similar to that seen for clusters with Hipparcos parallax distances. Observational and theoretical studies suggest that the metallicity dependence of Cepheid properties is not large, but is sufficiently important that it should be accounted for. However, the fact that target galaxies are typically of similar metallicities to the calibrators, suggest that metallicity corrections won’t have a major impact on estimates of the Hubble constant. Incompleteness biases can also affect Cepheid samples, but are usually best dealt with by imposing a conservative lower limit on period.
keywords:
Cepheids, distance scale, LMC, Hipparcos1 Introduction
A “ladder” long ceased to be a good analogy for the cosmic distance scale since there is always an overlap of well-established distance indicators spanning any particular regime in distance. But, whatever picture one chooses, the fact remains that Cepheid variables are, as they were in Hubble’s time, the most important primary distance indicators, used to provide the step from our galaxy to the nearby universe. Amongst the “desirable properties” of Cepheids (used here and throughout, unless otherwise indicated, to mean classical population-I Cepheids pulsating in the fundamental mode) are that they (a) are bright, compared to most other stellar distance indicators (see figure 1), and easy to recognise by their variability; (b) have been studied long and hard and are physically pretty well understood; (c) are long-lived and stable, and hence can be reobserved; (d) individually are precise distance indicators which do not rely on the integrated properties of a whole population; and (e) are common enough in late-type galaxies that large samples can be accumulated to beat down statistical noise. On the other side of the coin, of course, classical Cepheids (i) cannot with current technology be observed far enough into the Hubble flow to give directly; (ii) are population I objects, so are not found in early-type galaxies; (iii) in the Milky-Way are barely within the reach of geometrical distance determination and tend to suffer high extinction due to dust in the disk; and (iv) are still difficult to model in some respects, particularly concerning the location of the red edge of the instability strip in the Hertzsprung–Russell diagram. The questions I seek to address here are, just how reliable are the Cepheid based distance indicators, and are they in harmony with other indicators with which they can be compared?

In practice, the Cepheid PL relations are calibrated locally in the Milky-Way and Magellanic Clouds. Prior to HST, Cepheids had only been well studied in local group and other galaxies within about 4 Mpc (Cepheids had been detected in more distant galaxies, but only in very small numbers with few epochs). An extensive summary can be found in Jacoby et al. (1992; their table 1), from which it can be seen that at that time very few of these galaxies were useful for checking and calibrating secondary distance indicators such as the Tully-Fisher relation. With HST the situation has changed dramatically so that approaching 30 new galaxies (see table 1 for those published to date) have been observed for Cepheids reaching to 30 Mpc or more. Furthermore, these were mostly chosen specifically to be useful from the point of view of secondary indicators.
| \tablelineGalaxy | Published distance modulus | Reference |
| \tablelineM81\tablenotemarka | Freedman et al. 1994 | |
| M95\tablenotemarka | Graham et al. 1997 | |
| M100\tablenotemarka | Ferrarese et al. 1996 | |
| M101\tablenotemarka | Kelson et al. 1996 | |
| NGC925\tablenotemarka | Silberman et al. 1996 | |
| NGC1365\tablenotemarka | Silbermann et al. ApJ in press | |
| NGC2090\tablenotemarka | Phelps et al. 1998 | |
| NGC2541\tablenotemarka | Ferrarese et al. 1998 | |
| NGC3621\tablenotemarka | Rawson et al. 1997 | |
| NGC4414\tablenotemarka | Turner et al. 1998 | |
| NGC4725\tablenotemarka | Gibson et al. ApJ in press | |
| NGC7331\tablenotemarka | Hughes et al. 1998 | |
| NGC4639\tablenotemarkb | Saha et al. 1997 | |
| NGC4496A\tablenotemarkb | Saha et al. 1996a | |
| NGC4536\tablenotemarkb | Saha et al. 1996b | |
| NGC5253\tablenotemarkb | Saha et al. 1995 | |
| IC4182\tablenotemarkb | Saha et al. 1994 | |
| M96 | Tanvir et al. 1995 | |
| \tableline\tableline |
aobserved by the distance scale key-project team. \tablenotetextbobserved by the Sandage et al. SNIa calibration project.
Having so many galaxies observed with the same instrument, and indeed essentially the same procedure and calibrations, is good for consistency, but makes the whole distance scale more vulnerable to shared systematic errors. Therefore it is most important to address the specific procedures used in the HST studies and to concentrate calibration efforts accordingly.
2 The “HST Method”
The standard strategy adopted by all groups using the HST to observe Cepheids owes much to the ideas developed particularly by Madore and Freedman (1991, and references therein). Typically, the field is monitored in the -band at 12 to 15 epochs, to identify variables and determine periods, phases and -band amplitudes and magnitudes. At 3 to 5 epochs -band observations are also obtained to provide colours and hence a handle on the reddening. The lower amplitude in and the correlations between the shapes of the and light curves mean that the smaller number of epochs is adequate.
At this point most studies have proceeded to fit - and -band period-luminosity relations independently to both sets of magnitudes to obtain apparent distance moduli in each band. The difference is assumed to be due to reddening and hence an unreddened distance modulus is estimated. An alternative, but essentially equivalent, procedure is to calculate reddening-free Wesenheit indices for each Cepheid and fit an appropriate relation to these (see T97 for further details). For photometry, the index is defined (cf. Madore 1982) as:
which is explicitly independent of extinction if:
is conventionally taken to have a value of 2.45 based on the extinction curve of Cardelli et al. (1989).
An advantage of the Wesenheit approach is that it reveals graphically how the strongly correlated residuals in both bands (the period–luminosity–colour relation) are such that the “reddening corrected” relation is intrinsically tighter than the PL relations in either band individually, even in the absence of any extinction (eg. see next section). This is not to say that the - relation is equivalent to a period–luminosity–colour relation, but we are accounting for at least part of the intrinsic colour term.
There are, of course, other ways in which Cepheids are used as distance indicators, such as using multicolour (eg. Madore & Freedman 1991; Martin, Warren & Feast 1979) and/or infrared photometry(eg. Laney & Stobie 1994), but this “HST method” has the advantage that it provides good Cepheid distances for a comparatively small expenditure of telescope time.
3 Calibration via the LMC Cepheids
The LMC is thought to have little depth along the line of sight, comparatively low extinction and is rich in Cepheids. Thus it is a good place to study Cepheid properties and, in recent years, extragalactic studies have mostly used PL relations derived in the LMC. To calibrate these relations requires, in the first place, observations of a good sample of its Cepheids in the relevant bands. To address this, I have collected all the published data for Cepheids with Johnson -band and Cousins -band photoelectric photometry (Tanvir in preparation).
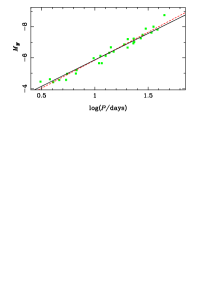
The PL relations are shown in figure 1. The - relation is linear and is at least as tight as the infra-red PL relations (cf. Laney & Stobie 1994). The dispersion of 0.12 mag is remarkably small given that the effects of measurement and sampling errors, aswell as the depth within the LMC, must be present in addition to the intrinsic spread. The linear fit to the - relation, referred to a pivot of 1.4 which is typical for extragalactic samples, is:
;
To establish the absolute zero-point we must subtract from this the true, extinction-free distance modulus of the LMC. Several other contributions to this proceedings address this important point, and it is beyond the scope of the present paper to review the many available estimates of the LMC distance (see Walker 1998 for such a review). Instead I shall list some of the recent estimates based on “direct” methods, which in fact give a good indication of the range of disagreement (table 2).
| \tablelineMethod | Source | (LMC) |
| \tablelineLight echo times for SN1987A | Gould & Uza (1998) | |
| Light echo times for SN1987A | Panagia (1998) | |
| Eclipsing binary HV2274 | Guinan et al. (1998) | |
| Multimode RR Lyraes | Alcock et al. (1997) | |
| Expanding photosphere of SN1987A | Eastman & Kirshner (1989) | |
| \tableline\tableline |
Estimates which are based on Cepheids themselves usually (eg. Feast & Catchpole 1997), but not always (eg. Luri et al. 1998), fall at the high end of this range, whilst estimates using RR Lyraes usually (eg. Luri et al. 1998), but not always (eg. Reid 1997), fall at the low end. Clearly there is not yet a concensus about the distance to the LMC at the 20% (full range) level, and here I continue to adopt the working value and error recommended by Madore and Freedman (1991) of .

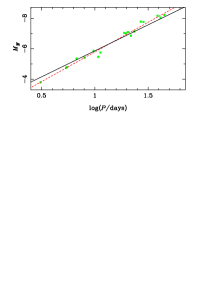
In fact, a number of the variables in figure 1 have as few as 2 observations in each band. It is interesting to plot the same relations for only those Cepheids with well sampled light curves, chosen here to be those with at least 15 -band observations and 10 -band observations (figure 3). In and the improvement is considerable since sparse sampling of light curves with upwards of 1 mag peak-to-peak variations, produces large errors. However, the improvement in . is less pronounced because variations in colour around a pulsation cycle also mimic the effect of dust, in the sense that reddest colour occurs close to the faintest magnitude. The increased scatter to shorter wavelengths is produced in part by differential reddening, but also reflects the intrinsic width of the instability strip (ie. variations in temperature at a fixed period have least effect on the Rayleigh-Jeans tail of the spectrum).

Since these data are certainly better for and , they are the most suitable for calibrating the PL relations in those bands:
; ;
4 Calibration via the Milky-Way Cepheids
If we can estimate distances to individual Milky-Way Cepheids, then we can use them to calibrate at least the zero-point of the period–luminosity relations. Here I consider three methods and, in the spirit of our quest for harmony, will check them for consistency with the - calibration already derived from the LMC Cepheids. For the present, no metallicity corrections are made, but these are discussed in section 6.
Firstly, although very few individual Cepheids have statistically significant parallaxes from Hipparcos, it is possible to average large samples of poorly determined parallaxes to yield useful, unbiased calibrations of the PL relations (eg. Feast & Catchpole 1997). If we define a “photometric parallax” for each Cepheid:
where is the slope of the - relation for the LMC sample, then we can compare to the observed trigonometric parallaxes to obtain the zero-point. This is plotted in figure 4, which clearly shows the LMC calibration to be consistent with the data. We should, of course, beware that when dealing with high extinctions as is the case for many of these Cepheids, the reddening correction procedure itself may introduce significant errors.

Secondly, I consider Cepheids with distances found via Baade-Wesselink methods. Figure 5 uses the data from Gieren et al. (1997) to which the reader is referred for a fuller discussion of this important technique. For our purposes we simply note that the calibrations are in good agreement, particularly over the range of most interest for extragalactic studies, namely
Finally, I look at the time-honoured method which uses Cepheids in open clusters with main-sequence fitted distances. These are plotted in figure 6 and we see immediately that the galactic Cepheids define a steeper relation than the LMC. Although apparently a significant difference, we should be cautious since the numbers are small and many of the points can be questioned on an individual basis, for example, as to the reliability of the association between cluster and Cepheid.
However, if the effect is real, we can ask whether there are any plausible explanations. The global metallicity difference between the LMC and Milky-Way would be a surprising cause since, if anything, increasing metallicity is expected to produce a somewhat shallower slope (eg. Bono et al. Ap.J. in press, Chiosi et al. 1993). Nonetheless, metallicities of individual Cepheids do correlate well with residual for a subset of this sample with high quality measurements (Sekiguchi & Fukugita 1998; Fry & Carney 1997). However, the nearly one-to-one correlations of residuals in different passbands combined with the absence of any very obvious correlation for the BW distances (Tanvir 1998) suggest that any such problem would have to be largely with the MS fitting distances rather than the Cepheids themselves. A simple metallicity effect of this kind has not been seen in the Hipparcos results.
An alternative, if at first sight even less palatable, possibility is that the main-sequence fits to the clusters are dependent on the age of the clusters (assumed to be the same as the age of the Cepheid which in turn is a function of period). The correlation of age and - residual (figure 7) is actually quite good given the various errors and assumptions, and intriguingly the nature of the effect is similar to that found by van Leeuwen (this volume) for the age dependence of main-sequence position found by Hipparcos. Because of the age–metallicity relation of the galactic disk (Edvardsson et al. 1993), an age correlation should also be reflected in a metallicity correlation at some level, but the apparent tightness of the latter (Sekiguchi & Fukugita 1998) remains surprising.
Of course, extinction corrections for these Cepheids are high and difficult to measure (Hoyle et al. in this volume) and this could also be affected if the MS fitting is age dependent.

5 Deriving Cepheid parameters from sparse, noisy data
We have seen that surprisingly good Wesenheit indices are found for the LMC Cepheids with very few epochs of observation. However, for faint extragalactic Cepheids the presence of much greater photometric noise makes estimating their parameters, both period and magnitudes, a trickier business.
As described in section 2, the -band data is generally used to identify variables, find their periods and to determine at some level the shape of the light curves. The simplest way to map from the to the light curves is to just scale their amplitudes, which are normally in a ratio of about 1:0.6 (T97). Some more sophisticated variations on this theme: allow for small shifts in phase (Freedman 1988); use empirical mappings which are a variable function of phase (Labhardt, Sandage & Tammann 1997); or, use light curve templates derived from fourier fitting to well sampled, low noise data (Stetson 1996).
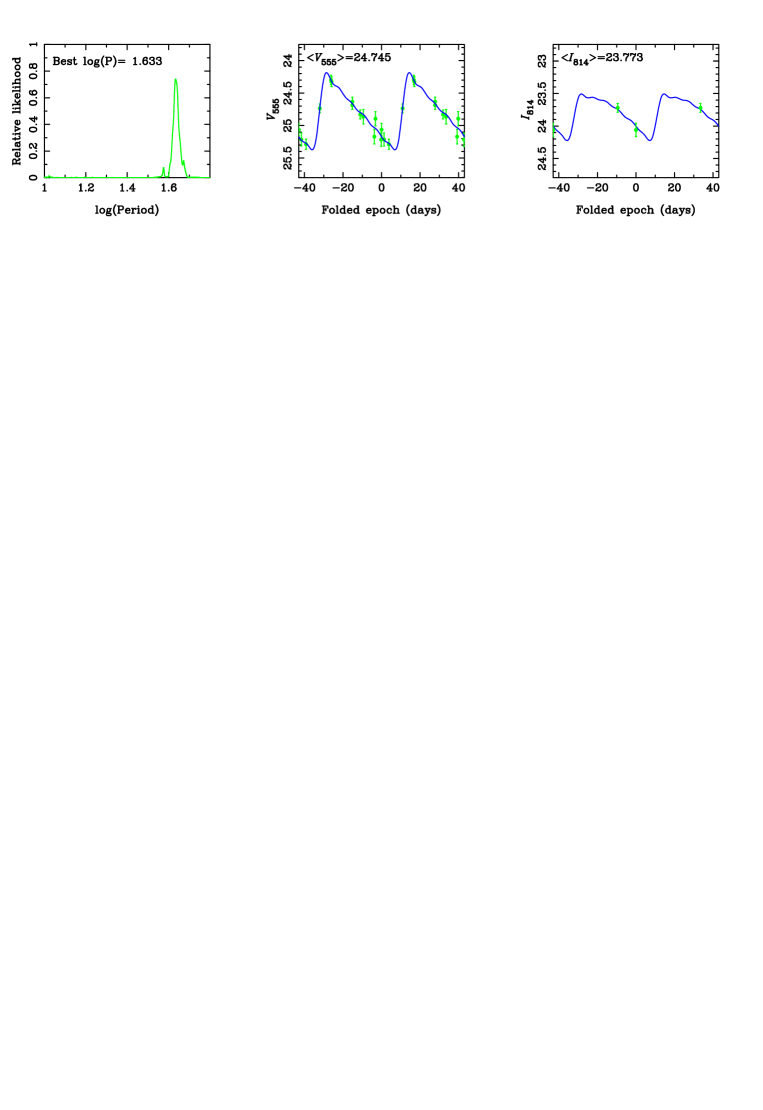
A new technique (Tanvir, Hendry & Kanbur in preparation; see also Hendry et al. in this volume) uses principal components to characterise the light curve shapes of Cepheids as a function of period. The correlations between the light curves in different bands are built-in in this method, and the fits are therefore to the and data points simultaneously. This allows all the data to be used in the determination of the period and magnitudes and uses our full knowledge of the properties of well-observed, local Cepheids. It is also more amenable to the ascription of error bounds on the resultant parameters. An example of the method in action is shown in figure 8.
6 The effect of metallicity differences
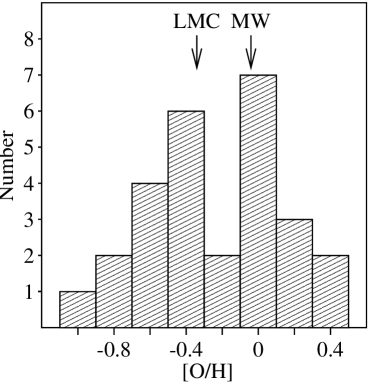
One of the long-standing concerns over the use of Cepheids is the question of what effect chemical abundance variations may have on the PL relations, and in particular on the - relation. Observationally this is a difficult question to answer because samples of Cepheids which are all known to be at the same distance (ie. usually because they are all in one galaxy) tend to have little variation in metallicity. Before seeing how recent observational tests are beginning to provide useful constraints, we note that (a) variations within the LMC sample are apparently not enough to introduce any significant scatter in the - relation (section 3); and (b) calibrating Cepheids in the LMC and Milky-Way straddle the average metallicity of the sample of HST observed galaxies, so abundance errors will tend to cancel out (figure 9).
There have been a number of attempts over the years to tie down the metallicity dependence of Cepheid properties observationally. All have rather high formal uncertainties and some are not really applicable to the “HST method” in that they are concerned with other passbands. Several recent, relevant efforts are summarized in table 3. From these it appears that the difference in metallicity between the Milky-Way and LMC Cepheids (about 0.3 in ) should only lead to a mag difference in zero point.
| \tableline | Method | Reference |
| (mag dex-1) | ||
| \tableline | Comparison of HST observations of inner and outer fields of M101. | Kennicutt et al. (1998) |
| Simultaneous solution for distances to 17 galaxies | Kochanek (1997). | |
| Comparison of EROS observations of SMC and LMC Cepheids | Sasselov et al. (1997). | |
| \tableline\tableline |
On the theoretical side, there are a number of obstacles to providing exact predictions of PL and PLC relations and their metallicity dependence. These include locating the position of the red-edge of the instability strip, which is determined by the onset of convection. The models of Chiosi, Wood and Capitanio (1993) indicated a small metallicity dependence for - distances (T97). Recently Bono et al. (Ap.J. in press; see also Marconi et al. in this volume) have developed more sophisticated, convective pulsation models which actually predict a modest metallicity effect in the opposite direction to that found in the observational studies. Further progress in theoretical modelling, in parallel with observational studies, would be very welcome.
7 Biases due to incomplete samples
T97 discussed at some length the issue of biases due to incompleteness of the Cepheid samples. These arise generally because close to the detection threshold Cepheids preferentially fall into or out of the sample depending on whether they happen to be brighter or fainter than the average PL relation. From our point of view we are interested not in the simple -band PL relation, but in the more complicated - relation. Since, the intrinsic dispersion of the - relation due to the width of the instability strip is very small (section 3), the bias will depend largely on the other, observational errors, and in particular those which are largest close to the detection limit. T97 showed that if these errors are uncorrelated between the bands (eg. if photometric noise dominates) then the resulting bias actually produces spuriously large distance estimates, which is in the opposite sense to the normal incompleteness bias (eg. Teerikorpi 1987). This assumes, as is usually the case in practice, that if a variable is bright enough to be identified as such in the -band, then it will always be possible to estimate an -band magnitude for it. In other words that the selection is only on the magnitudes.
However, if the errors in and are correlated, such as is expected for crowding errors or uncertainties in the period determination, then the nature of the resultant bias depends on the details of the correlations. For example, if the residuals from the and PL relations are essentially correlated one-to-one, then a bias arises which is in the traditional sense of an underestimate of the distance.
Lanoix et al.(ApJ, submitted) have shown that for a particular choice of (plausible) random and correlated errors it is possible to reproduce quite well the apparent bias in the NGC4536 Cepheid sample. Unfortunately, to do a good job of estimating the bias for most samples would require simulating Cepheids by adding artificial stars to the images. However, a signature of some kind of bias is if the Cepheids in a sample systematically depart from the slope of the fitted - relation at short periods, and the safest action is to make a conservative lower cut in .
8 Conclusions
The very tight - relation in the LMC illustrates the considerable power of the “HST method” for Cepheid distance determination. A dispersion of 0.12 mag, or less, around the mean relation, implies that a single well observed Cepheid can, in principal, give reddening-free distances to better than 6% rms. To achieve this potential requires: a good calibration, which would be achieved if we had a definitive (harmonious!) distance to the LMC; an understanding of systematic effects, particularly metallicity; and, of course, good, well calibrated data (see Hill et al. 1998 for a discussion of the issues in calibrating WFPC2 photometry). The apparent variation in the location of the main-sequence seen in the Hipparcos data may yet have profound implications for the distance scale (and astrophysics), but at least the evidence to date suggests that the Cepheid calibration is not too badly affected.
Acknowledgements.
I would like to thank my collaborators Martin Hendry, Shashi Kanbur, Tom Shanks, Fiona Hoyle and Floor van Leeuwen for many useful discussions.References
- [1] lcock, C. et al., 1997, ApJ, 482, 89.
- [2] ertelli, G. et al., 1994, A&AS, 106, 275.
- [3] aldwell, J.A.R. & Coulson, I.M., 1987, AJ, 93, 1090.
- [4] ardelli, J.A., Clayton, G.C. & Mathis, J.S., 1989, ApJ, 345, 245.
- [5] hiosi, C., Wood, P.R. & Capitanio, N., 1993, ApJS, 86, 541.
- [6] astman, R.G. & Kirshner, R.P., 1989, ApJ, 347, 771.
- [7] dvardsson, B. et al., 1993, A&A, 275, 101.
- [8] east, M.W. & Catchpole, R.M., 1997, MNRAS, 286, L1.
- [9] errarese, L. et al., 1996, ApJ, 464, 568.
- [10] errarese, L. et al., 1998, ApJ, 507, 655.
- [11] reedman, W.L., 1988, ApJ, 326, 691.
- [12] reedman, W.L. et al., 1994, ApJ, 427, 628.
- [13] ry, A.M. & Carney, B.W., 1997, AJ, 113, 1073.
- [14] ieren, W.P., Fouque, P. & Gomez, M., 1998, ApJ, 496, 17.
- [15] raham, J.A. et al., 1997, ApJ, 477, 535.
- [16] ould, A. & Uza, O., 1998, ApJ, 494, 118.
- [17] uinan, E.F. et al., 1998, ApJ, 509, L21.
- [18] ill, R.J., 1998, ApJ, 496, 648.
- [19] ughes, S.M.G. et al., 1998, ApJ, 501, 32.
- [20] aney, C.D. & Stobie, R.S., 1994, MNRAS, 266, 441.
- [21] uri, X. et al., 1998, A&A, 335, L81.
- [22] acoby, G.H. et al., 1992, PASP, 104, 599.
- [23] elson, D.D. et al., 1996, ApJ, 463, 26.
- [24] ennicutt, R.C. et al., 1998, ApJ, 498, 181.
- [25] ochanek, C.S., 1997, ApJ, 491, 13.
- [26] abhardt, L., Sandage, A. & Tammann, G.A., 1997, A&A, 322, 751.
- [27] adore, B.F., 1982, ApJ, 253, 575.
- [28] adore, B.F. & Freedman, W.L., 1991, PASP, 103, 933.
- [29] artin, W.L., Warren, P.R. & Feast, M.W., 1979, MNRAS, 188, 139.
- [30] offett, T.J., Gieren, W.P., Barnes, T.G. & Gomez, M., 1998, ApJS, 117, 135.
- [31] anagia, N., 1998, in New Views of the Magellanic Clouds, IAU Symp 190, 53.
- [32] helps, R.L. et al., 1998, ApJ, 500, 763.
- [33] awson, D.M. et al., 1997, ApJ, 490, 517.
- [34] eid, I.N., 1997, AJ, 114, 161.
- [35] aha, A. et al., 1994, ApJ, 425, 14.
- [36] aha, A. et al., 1995, ApJ, 438, 8.
- [37] aha, A. et al., 1996a, ApJ, 460, L15.
- [38] aha, A. et al., 1996b, ApJS, 107, 693.
- [39] aha, A. et al., 1997, ApJ, 486, 1.
- [40] asselov, D D. et al., 1997, A&A, 324, 471.
- [41] ekiguchi, M. & Fukugita, M., Observatory, 118, 73.
- [42] ilberman, N.A. et al., 1996, ApJ, 470, 1.
- [43] tetson, P.B., 1996, PASP, 108, 851.
- [44] anvir, N.R., Shanks, T., Ferguson, H.C. & Robinson, D.R.T., 1995, Nature, 377, 27.
- [45] anvir, N.R., 1997, in The Extragalactic Distance Scale, M. Livio, M. Donahue & N. Panagia, Cambridge: CUP, 91.
- [46] anvir, N.R., 1998, in Post-Hipparcos Cosmic Candles, A. Heck & F. Caputo, Dordrecht: Kluwer.
- [47] eerikorpi, P., 1987, A&A, 173, 39.
- [48] urner, A. et al., 1998, ApJ, 505, 207.
- [49] urner, D.G., 1992, AJ, 104, 1865.
- [50] urner, D.G., 1996, JRASC, 90, 82.
- [51] urner, D.G., Pedreros, M.H. & Walker, A.R., 1998, AJ, 115, 1958.
- [52] alker, A.R., 1998, in Post-Hipparcos Cosmic Candles, A. Heck & F. Caputo, Dordrecht: Kluwer.
- [53]