Clumpy diffuse X-ray emission from the spiral-rich compact galaxy group HCG 16
Abstract
We carefully reanalyze the ROSAT PSPC X-ray spectro-photometric observations of HCG 16 (Arp 318), and compare them to optical and radio data. Its X-ray morphology resembles its morphology at 20 cm, seen by the NVSS. In particular, we detect diffuse emission in eight regions filling half of the radius circle around the optical center of the group: one region encompassing galaxies a & b, two regions surrounding the group galaxies c & d, a clumpy region roughly from the group galaxies, which may be gas ejected from one of the galaxies, plus regions respectively associated with a background radio-source, a probable background radio-source, a foreground star and a background group or cluster. The bolometric X-ray luminosity of the diffuse emission, excluding the regions associated with radio galaxies, is , i.e., half of the luminosity found by Ponman et al. (1996). The region that is offset from the galaxies contributes half of the diffuse X-ray luminosity of the group. The diffuse emission is cool ( with 90% confidence with a best fit ). At these low temperatures, the correction for photoelectric absorption in the estimate of bolometric luminosity is a factor 3.5 and varies rapidly with temperature, hence an uncertain bolometric luminosity.
The clumpy distribution of hot diffuse gas in HCG 16 is illustrated by the low mean X-ray surface brightness and hot gas density of the regions of undetected emission within (at most 1/4 and 1/6 of those of the detected gas, assuming both have same temperature, metallicity and clumpiness). The irregular X-ray morphology of the diffuse emission rules out a (nearly) virialized nature for HCG 16, unless intergalactic gas had sufficiently high specific entropy to be unable to collapse with the group. In any event, the clumpy gas distribution, and high luminosity given the low temperature suggest that most of the diffuse gas originates from galaxies, either through tidal stripping or through galactic winds driven by supernova remnants. Therefore, no spiral-only HCGs are known with regular diffuse emission tracing a gravitational potential.
Our results highlight the need for a careful 2D spatial analysis and multi-wavelength study of the diffuse X-ray emission from groups, suggesting that other compact groups could be significantly contaminated by superimposed X-ray sources.
Key Words.:
Galaxies: clusters: general – Galaxies: clusters: individual: HCG 16 – X-rays: galaxies – X-rays: general1 Introduction
The extreme apparent density of compact groups of galaxies makes them ideal sites for the study of multiple interactions of galaxies, and more generally, another dense environment to be compared with rich clusters. Indeed, compact groups (of typically 4–5 bright galaxies) such as those (hereafter, HCGs) cataloged by Hickson (1982) appear as compact in projection onto the plane of the sky as the cores of rich clusters, and are moreover selected to be isolated.
The discovery of numerous signs of galaxy-galaxy interaction within HCGs (see Hickson 1997 for a review) suggest that most HCGs are indeed dense in 3D. However, the very short crossing times derived from galaxy spectroscopy (Hickson et al. 1992) suggest rapid galaxy merging and coalescence into a single giant elliptical galaxy (Carnevali et al. 1981; Barnes 1985; Mamon 1987; Barnes 1989; Bode et al. 1994; Governato et al. 1996) if indeed they correspond to the low-mass end of clusters of galaxies, forming at high redshift, unless the group is constantly replenished through accretion of surrounding galaxies (Diaferio et al. 1994; Governato et al. 1996). In fact, a variety of arguments have been put forth suggesting that compact groups are mostly chance alignments of galaxies along the line of sight within larger systems: loose groups (Rose 1977 for chain-like groups; Mamon 1986 for the majority of compact groups), clusters (Walke & Mamon 1989) or cosmological filaments (Hernquist, Katz, & Weinberg 1995). Thanks to gravity, these chance alignments tend themselves to be binary-rich (Mamon 1992), and it is very difficult to tell whether the interaction seen in HCGs are caused by a system of 4 or more bright galaxies or simply by binaries, well-separated along the line-of-sight.
Recently, there has been much hope that the debate on the nature of HCGs could be resolved by X-ray observations. The ROSAT, ASCA and Beppo-SAX X-ray satellites are sensitive enough in the soft X-ray band to be able to detect the diffuse intergalactic plasma within (nearly) virialized galaxy systems with potential wells with depth corresponding to a 1D velocity dispersion of . Most sensitive of these is the Position Sensitive Proportional Counter (PSPC) of ROSAT, which discovered diffuse intergalactic emission from large numbers of compact groups (Ebeling, Voges, & Böhringer 1994; Pildis, Bregman, & Evrard 1995; Saracco & Ciliegi 1995; Mulchaey et al. 1996; Ponman et al. 1996, hereafter PBEB).
But there has been a debate on whether the fraction of compact groups detected by ROSAT is 40% (Mulchaey et al. 1996) or 75% (PBEB, taking into account the selection effects on distance). There is also controversy on the luminosity-temperature relation: Mulchaey & Zabludoff (1998) derive a relation that is consistent with the extrapolation from rich clusters, while PBEB find a luminosity-temperature relation for compact groups with a much higher slope, with the hottest groups lying on the cluster extrapolation.
Moreover, the morphology of the diffuse X-ray emission of compact groups is very diverse, as attested by the PSPC maps provided by Pildis et al. (1995), Saracco & Ciliegi (1995), Ponman & Bertram (1993) (only for HCG62) and PBEB (only for HCG 16). In some cases, such as HCG 62 (Ponman & Bertram), diffuse intergalactic emission extends well beyond the group, not centered on any galaxy of the group, with regular circular isophotes, just as is to be expected in a well relaxed galaxy system. But in other cases, the emission is only attached to individual galaxies, see e.g. HCG 44 (PBEB). And there are intermediate cases, such as HCG 16, where the diffuse emission does not appear as extended as the galaxy system nor as regular as in HCG 62.
In fact, HCG 16 (also known as Arp 318) is an unusual galaxy system. First, because the six brightest galaxies of the group (Hickson’s original 4 plus two more outside the group isolation annulus, see de Carvalho et al. 1994) are starburst, LINERs or AGNs (Ribeiro et al. 1996, hereafter RdC3Z). Moreover, the X-ray properties of HCG 16 are controversial and possibly extreme. It was first detected with the EINSTEIN satellite (Bahcall et al. 1984), which did not have the angular resolution to resolve the emission between the group galaxies and an intergalactic medium. However, Ponman et al.’s analysis of ROSAT PSPC observations made it the coldest detected group (), and there are no other spiral-only compact groups with diffuse X-ray emission (Mulchaey 1999; see also Ponman et al.). HCG 16 is thus an abnormal group given the very strong correlations between X-ray luminosity and group spiral fraction found by Pildis et al. (1995) and Mulchaey et al. (1996). Moreover, whereas diffuse X-rays were clearly detected by PBEB, Saracco & Ciliegi (1995) failed to detect such diffuse emission at an upper limit 16 times lower,111Given the fluxes measured by Saracco & Ciliegi (1995) for HCG 16 and their adopted value for , their quoted upper limit for their luminosities were underestimated by a factor 2 for all undetected groups in their Table 4 except HCG 3. whereas only a factor 2.3 (which we find by simulating a MEKAL plasma with temperature, abundance and absorbing column as quoted by PBEB) is attributable to the wider (“bolometric”) energy range in which PBEB compute their luminosities. Given the low temperature that PBEB derive for HCG 16, their derived X-ray luminosity places it two orders of magnitude above their compact group luminosity-temperature relation and roughly a factor of two above the extrapolation of the cluster trend. It thus seems difficult to reconcile HCG 16 with a low temperature extrapolation of regular X-ray emitting compact groups. Indeed, PBEB note that HCG 16 is “probably not fully virialized”.
In this article, we present a detailed analysis of the ROSAT PSPC observations of HCG 16. The data reduction is presented in Sect. 2, our spatial analysis in Sect. 3, and our spectral analysis in Sect. 4. In Sect. 5, we compare our results with previous X-ray analyses of HCG 16, perform a mass budget of the group and ask if it is virialized. In a following paper (Mamon & Dos Santos 1999, hereafter Paper II), we discuss at length the cosmological and dynamical constraints on the nature of HCG 16.
2 Observations and data reduction
2.1 Observations and preliminary reduction
HCG 16 was observed in January 1992 with the PSPC (in its low-gain state), on board the ROSAT satellite, for a total observing time of . We obtained the data from the ROSAT archives. Snowden et al. (1994)’s PSPC Extended Source Cookbook software was used to perform the first-pass data reduction, i.e., rejection of high-background times, energy-dependent (in 7 bands) background subtraction, exposure and vignetting corrections. We adopted a conservative value of for the maximum Average Master Veto rate allowed (see Snowden et al. 1994). Even with this low threshold, only of the total observing time was rejected, leaving an effective observational time of . We then carefully examined the light curves of the total counts in the entire image per energy band as defined by Snowden et al. (1994), and checked that no short time scale glitches were present. Point sources were detected using a sliding box algorithm, with the improvement that the box is a circle with a radius varying with off-axis angle, to model the varying point spread function. Each point source detected at a level exceeding was removed, i.e. a circle centered on the source, of radius times the encircled energy radius, was excised. Unless otherwise stated, we limited our analysis to the energy band, because at lower energies, the background is too high to be adequately subtracted from the data, while at high energies the same occurs because our sources happen to be relatively cold, and moreover the calibration of the PSPC is uncertain. This preliminary reduction produced an image with pixels, wide (roughly the FWHM of the PSPC’s PSF at ).
2.2 Background estimation
The definition of the background region, whose counts are subtracted to each pixel within some region, is of crucial importance for the spatial detection of sources with very low signal-to-noise ratio (hereafter S/N), as well as for spectral analyses.
The shadowing by the supporting ring of the PSPC (situated at from the center of the field) is visible in the images, even after the vignetting correction. Thus, we measure the background well outside of the ring. In practice, we choose three annular regions to measure the background, each centered on HCG 16, with inner and outer radii of (BG1), (BG2), and (BG3). The radial structures of the PSPC supporting ring were removed in each case. Table 1 shows the background counts in the three regions within the energy range. We note that BG3 has a slightly lower value than the other two.
| Region | Radii | Pixels | Counts/pixel |
|---|---|---|---|
| BG1 | |||
| BG2 | |||
| BG3 |
To decide which is the best background, we measure the net counts in two regions within the inner ring support, using each of the three background regions for measuring the background. The latter have been vignetting corrected and normalized to the number of pixels of each region. Our two test regions are the radius circle centered on the group optical center and the annulus surrounding this circle, with inner and outer radii of and . Both are in the inner of the field of view, thus avoiding problems with the supporting ring of the PSPC and with somewhat uncertain vignetting correction outside of this ring. Table 2 gives the background subtracted data and errors for both regions and for each background.
| Region | ||||
|---|---|---|---|---|
| Net counts | Significance | Net counts | Significance | |
| BG1 | 4.6 | |||
| BG2 | 5.5 | |||
| BG3 | 6.0 | |||
While we find positive net counts within the inner of HCG 16, whatever three of the background regions is used to estimate the background, only BG3 is compatible with the counts within the annulus, yielding near zero net counts. The net counts with the other two background regions are difficult to understand, unless there happens to be X-ray absorption by Galactic or intergalactic neutral hydrogen merely in this annulus. This appears to be ruled out by HI observations with the VLA (Williams 1998; Verdes-Montenegro 1999) and by the spectral analysis (Sect. 4). We thus infer that BG1 and BG2 are contaminated by sources or suffer from uncertain (large) vignetting corrections. In fact, Pildis et al. (1995) had also encountered a PSPC field with a background that rose with distance to the field center. We therefore use BG3 () to measure the background, which then amounts to (in the energy range).
3 Spatial analysis
3.1 Preliminary spatial analysis
Ponman et al. (1996) claimed a detection of diffuse emission within a radius surrounding HCG 16 (corresponding to , given HCG 16’s redshift of 222Distances throughout this paper are derived assuming a Hubble constant , with , unless explicitly given.). The net counts shown in Table 2 confirm PBEB’s global detection of diffuse emission in HCG 16. We detect diffuse emission at within and fail to detect significant counts between and . Hence, to first order, the extent of the diffuse emission is very roughly , or , similar to what is inferred from PBEB’s surface brightness profile of HCG 16.
But we wish to go further: what is the spatial distribution of this excess of photons within of the group center? Here we are confronted with the low number of detected photons (). We applied three different methods to analyze the photon distribution within . First, we count the photons in a grid encompassing the radius circle. Then, in order to obtain the best S/N ratio, we adaptively smooth the image and detect diffuse emission. Finally, we apply a wavelet-based method to detect structures at all scales and verify that emission is present on more than one scale as a confirmation of its diffuse nature.
3.2 Analysis on a grid
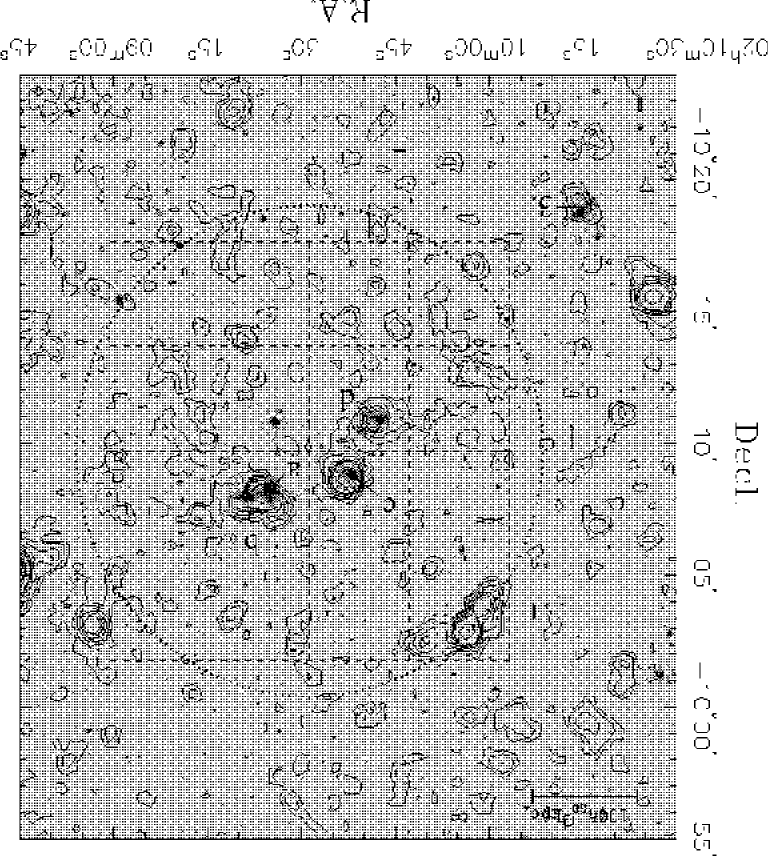
The simplest way to spatially analyze HCG 16 is to define a grid encompassing the whole group. We divide the field of view of the group in sixteen pixel squares, (i.e., side at the distance of HCG 16). The grid overlaid on a smoothed X-ray image of HCG 16 is displayed in Fig. 1. After removing the point sources (including group galaxies), we counted the background-subtracted number of photons in each square of the grid. The results, as well as the statistical significance of the detections, are given in Table 3.
| Region | Pixels | Net counts | Significance () |
|---|---|---|---|
The regions, shown in Fig. 1, are numbered from East to West, looping North to South. Cells with a statistical significance of detection greater than are shown in bold. Errors are and on the total (background + net) counts.
The analysis of Table 3 shows that regions over the selected are detected at a level above the background. We count regions from East (left) to West (right) and North (top) to South (bottom). Fig. 1 shows that the regions of excess counts are concentrated East, West and South of the four bright galaxies of the group: regions , and in the East contain net counts, while regions , , and , contain net counts. Moreover, half of the cells in the grid (if we don’t take into account cell , detected at a level) are compatible with no excess emission over the background, and most of these are North of the four galaxies (regions , , , , , , and ). Hence, the diffuse emission is located in two distinct regions as well as around the galaxies. This could be seen in PBEB’s Fig. 2, but they gave no quantitative analysis of the spatial distribution of photons, except for their radial surface brightness profile.
Is it possible to detect more precisely these excess counts regions, without degrading the S/N ratio? Indeed, the grid we used was arbitrarily set on the HCG 16 image, and some cells, especially cells , , and , overlap two regions where the photon densities differ. Using a smaller grid would not help because we are at the limit of sensitivity. Since we are principally interested in mapping the diffuse intergalactic gas, we can smooth the image, looking for large-scale features. But we need to be careful with the level of smoothing: indeed, regions with low count numbers must be smoothed on larger scales than the bright regions (e.g. , the bright galaxies), so as to keep a good statistical significance of the regions of diffuse emission. Consequently, we choose an adaptive filter algorithm, which automatically adapts the smoothing length to the local density of photons. PBEB already used adaptive smoothing to detect diffuse gas in HCG 16 (see their Fig. 2), but did not make a quantitative use of the information obtained with this technique.
3.3 Adaptive filtering of the image
3.3.1 Spatial resolution
In a classical (top-hat) smoothing filter, the filtering radius is fixed, the smoothed intensity is the mean (unweighted) counts within this radius, and the total counts within this radius varies across the image. Hence, every pixel will have a S/N directly proportional to the local photon density. The pixels in low surface brightness regions will then have poor statistics.
In an adaptive filter, the filter size is adapted to contain a fixed number of counts. Let be this fixed number of (background + net) counts per smoothing region of size pixels. The intensity of a given pixel will typically be , hence . Now, if the cumulative counts rise with radius faster than on average, they will reach at , where the typical counts are . Since the count curve of growth, , is a Poisson process, one has . Then, in the limit , one obtains , hence (we check that ). Therefore, every pixel will have the same S/N.
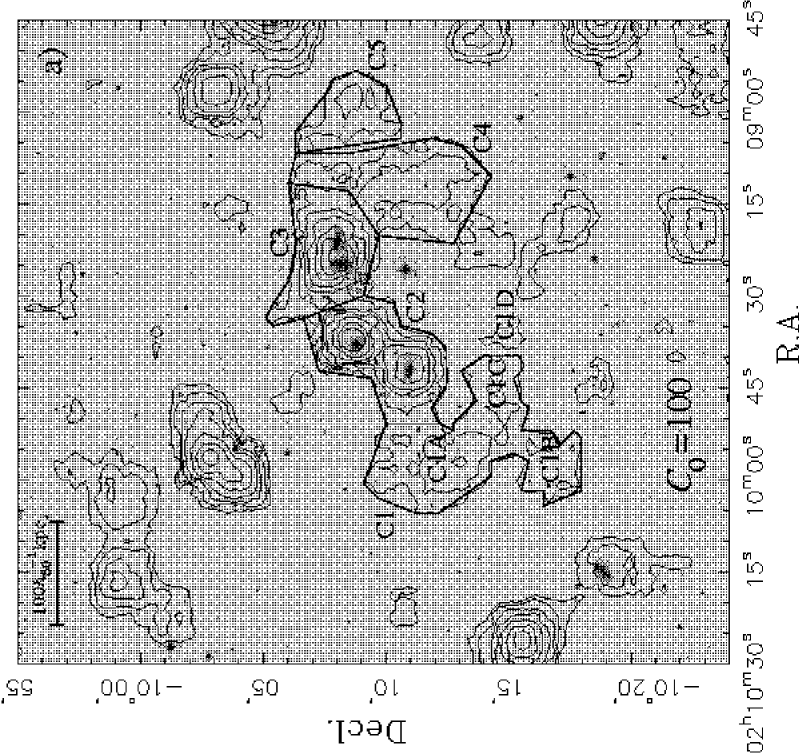
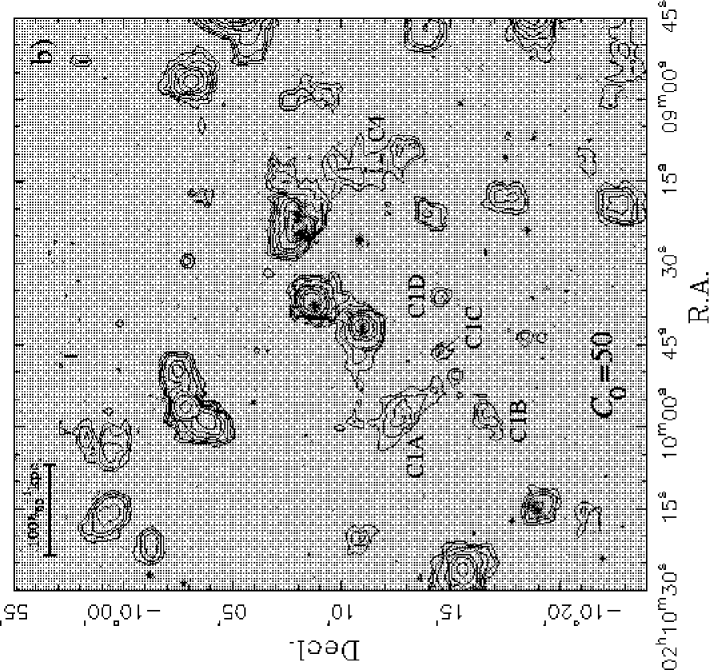
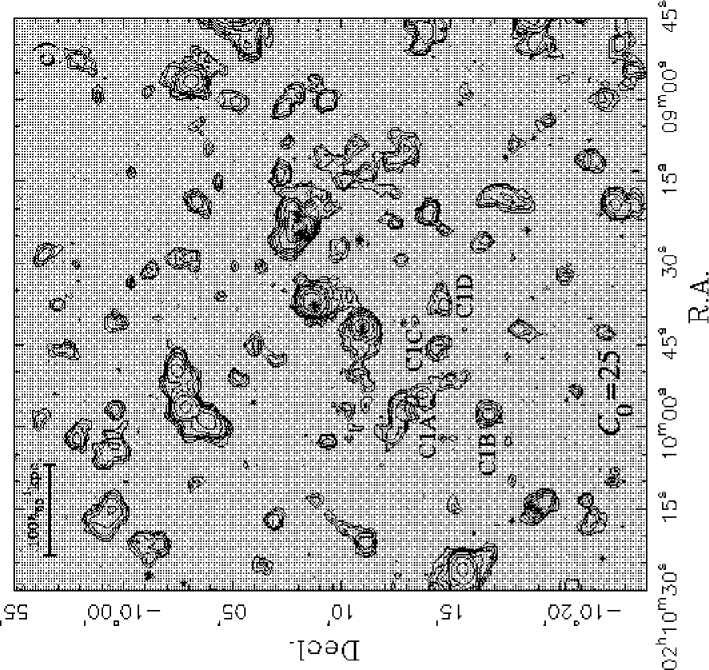
Refining the grid analysis, we define polygonal regions with much greater S/N than in the grid cells. Contrary to the grid, there will be no regions half overdense and half-underdense in photons. We produce adaptively smoothed images using ADAPT in the PSPC Extended Source Cookbook (Snowden et al. 1994), with , 50 and 100. Before smoothing, we masked point sources detected at the level, so as to better highlight the diffuse emission. The adaptively smoothed images are shown in Fig. 2. For esthetical reasons, the point sources detected by DETECT are not cut in these images.
Our smoothing resolution is easily computed. Calling the mean background, since , our smoothing radius, equal to , must be smaller than
| (1) |
With a mean background of (see Sect. 2.2), we obtain the smoothing resolutions listed in Table 4.
The grid we used in Sect. 3.2 was made of pixel cells. Table 4 shows that the lowest resolution varies with from 1/4 square cell ( pixels) for to 1 square cell ( pixels) for . This shows that our adopted values of are well suited for the size of the group, and will not smear out intermediate scale structures by smoothing on too large a scale.
3.3.2 Results
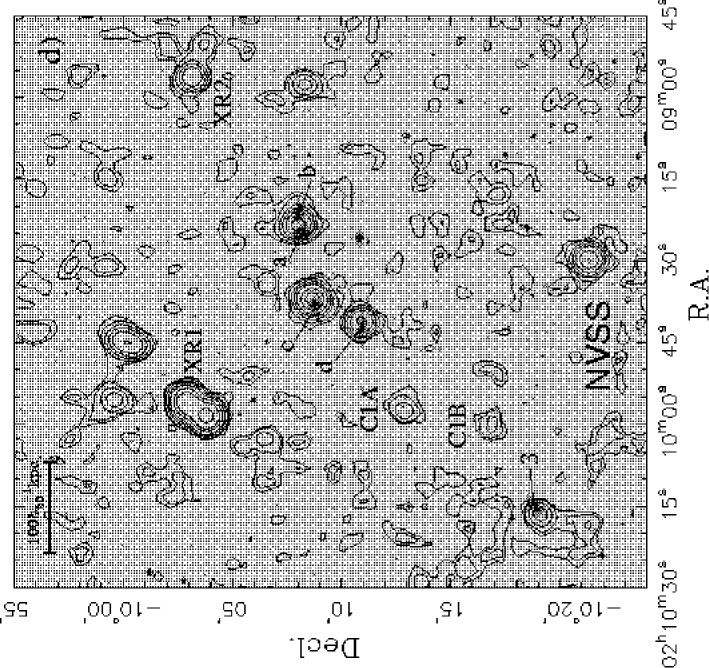
Consider first the image smoothed with (Fig. 2a), which has the largest features of the three images. Within the single contour encompassing the group galaxies are two overdensities, SE and SW of the group. They correspond respectively to part or all of cells , , for the SE overdensity and cells , , and for the SW one, in the grid of Sect. 3.2. These cell numbers correspond to the cells detected at a level higher than (see Table 3). We divide this closed region in different polygonal regions (C1–C5) filling the contours of the X-ray image adaptively smoothed with , as shown in Fig. 2. The exact cut between different regions is arbitrary, but we tried to be consistent with what we know about HCG 16: C1 is the South-Eastern overdensity, C2 and C3 are the regions around galaxies c & d and a & b of the group (but with these galaxies cut out), C4 is the South-Western overdensity, and C5 is a somewhat disjointed region, to the West of C4. The source to the South of C4 is detected as a point-like X-ray source, and also appears as a double point-like radio-source (Fig. 2d). Finally, C6 is the region within the radius circle minus the closed region (C1+C2+C3+C4+C5), i.e the part of this circle ( of it) with no obvious excess counts over the background.
Table 5 shows the net counts in each region. Regions C1 and C4 are detected at , much higher than regions C2 and C3 surrounding the bright galaxies (detected at ). This shows that the adaptive smoothing has targeted regions of high S/N ratio more efficiently than the spatial detection on the square grid. But the most important feature, which fully justifies the use of adaptive filtering, is that the emission of region C6 is fully compatible with the background. Hence, half of the region within of the group center contains negligible emission from diffuse hot gas. In Sect. 4.1 below, we confirm the different nature of the two halves of the circle.
| Region | Pixels | Net counts | Significance () |
|---|---|---|---|
| C1 | |||
| C2 | |||
| C3 | |||
| C4 | |||
| C5 | |||
| C6 |
The counts are computed from the unsmoothed images, within the energy interval and are rounded to the nearest integer. Errors are on the total (background + net) counts.
3.3.3 Detailed spatial analysis
Nothing has yet been said about the nature of the X-ray photon overdensities detected. We have intentionally called them with the vague denomination “regions”. Are these photons emitted by diffuse gas linked to the group? If so, is this gas primordial, or mainly ejected by the galaxies? Or does the diffuse emission originate from foreground or background sources, not necessarily linked with the group? Indeed, looking at PBEB’s Fig. , the position angle of the northern overdensity seems to be well-correlated with the alignment of three optical sources. The spatial and spectral capabilities of ROSAT are certainly insufficient to answer these questions, but the careful analysis of the images and spectra can provide some useful insight. Observations of HCG 16 at other wavelengths can also help to specify the dynamical state of the gas. In particular, deep optical images and radio surveys can precise the interactions between the diffuse gas, the galaxies and the radio sources.
We can now estimate the number of independent smoothing regions within our regions of excess counts. If our region has area pixels and excess counts, the number of independent smoothing regions within it is
| (2) |
Using Table 5 and Eq. (2), we find that, for (our worst spatial resolution), our regions C1, C2, C3, C4, and C5 consist of 3.6, 2.0, 1.7, 2.7, and 1.3 independent smoothing regions, respectively. Hence, the correlation among neighboring pixels introduced by adaptive smoothing may connect several local maxima in the X-ray surface brightness map, which are close in the plane of the sky, but not necessarily linked, neither among them nor with the group.
This is illustrated by comparing the adaptively smoothed images with different parameters . Comparing Figs. 2a and 2c, (with and respectively), we see that region C1 is composed of an elongated structure, almost perpendicular to the group (marked C1A), together with three point sources (marked C1B, C1C and C1D). This substructure remains in remains at , but is smoothed out in Fig. 2a into the entire C1 region. All these structures can be seen in Fig. 1, although with a worse S/N. On the contrary, region C4 seems to be extended, even with the lightest smoothing.
3.3.4 Spatial positioning of the images
We have obtained an optical image of HCG 16 from the Digitized Sky Survey (DSS), as well as a continuum radio image from the NRAO VLA Sky Survey (NVSS), which we superpose on a ROSAT PSPC image. The FWHMs are (DSS), (PSPC) and (NVSS). The radio and X-ray images both have pixels, while the optical image has pixels. Fig. 2d shows the NVSS radio contours overlaid on a DSS optical greyscale image. Both optical and radio images were centered at the center of the X-ray image. To ensure a correct superposition, we aligned the three images using the bright sources detected in the three wavebands. Comparison of Figs. 2b,c and 2d clearly shows that the X-ray and 20 cm morphologies are remarkably similar.
In their spectroscopic survey of HCG 16, Ribeiro et al. (1996) found that six galaxies among the seven belonging to the dynamical group were emission-line galaxies, AGN, LINERs or starburst galaxies. These galaxies are good candidates for detection in all three wavebands. Indeed, we find four sources detected in the three images: they are all HCG 16 galaxies and are marked a, b, c and d in Fig. 2d. Galaxies HCG 16a and HCG 16b seem to share a common X-ray and radio halo, thus enhancing the probability of tidal interaction between these galaxies suggested by optical tails seen in galaxy HCG 16a. The differences between the optical, radio and X-ray positions are less than , much less than the radio and X-ray PSFs. Moreover, we find two objects exactly coincident in radio and X-rays, ensuring good correspondence between X-rays and radio images independently. Both were first detected in the X-rays by Saracco & Ciliegi (1995), who called them XR1 and XR2, with no optical counterparts. We found two radio sources within a radius of less than around them, and XR1 has the same bimodal structure in X-rays and in radio.
The probability of finding an NVSS source within a given radius around an arbitrary position is less than when this radius is (see Condon et al. 1998). This means that the coincidences between six sources in the whole image cannot have occurred by chance, and this ensures that the superposition of the three images is quite perfect, given the positioning uncertainties. We are now able to compare small-scale structure in the three wavebands and attempt to elucidate the nature of the three regions of excess X-ray counts.
3.4 Finalizing the regions of diffuse emission of HCG 16
The problem is now to separate local maxima due to interloping X-ray sources (point or extended sources) from those due to the presence of diffuse gas. The regions C2 and C3, surrounding the four group galaxies, are certainly related to the group. We must then analyze the small scale X-ray structure of regions C1, C4 and C5 and compare it to optical and radio images. For this, we use a wavelet transform of the image to search for structures simultaneously at all scales.
3.4.1 Wavelet transform of the X-ray image
Since its invention in the early 80s, the wavelet transform (hereafter, WT) has proven its capabilities in numerous astronomical applications, such as the detection of the large scale structure (e.g., Slezak et al. 1993), galaxy detection and counts (Slezak et al. 1990), and structure detection in low-intensity X-ray images (Starck & Pierre 1998). We used the TRANSWAVE à trous (Shensa 1992; Starck & Murtagh 1994) wavelet package kindly provided by E. Slezak. In the à trous implementation of the discrete WT, an image is transformed into wavelet planes (hereafter WPs) of pixels, each being the difference between two consecutive wavelet smoothings at scales and (with and pixels respectively). The pixel values in these planes are called the wavelet coefficients at scale . The main advantage of this algorithm is that each WP has the same number of pixels, and thus, the reconstruction of the image (for example, after thresholding in the wavelet planes) is a straightforward process of addition. However, there is redundancy in the full set of wavelet coefficients. The main difficulty with the à trous wavelet filtering is the estimation of the statistical significance of the pixels in each WP, which should not follow Poisson nor gaussian statistics.
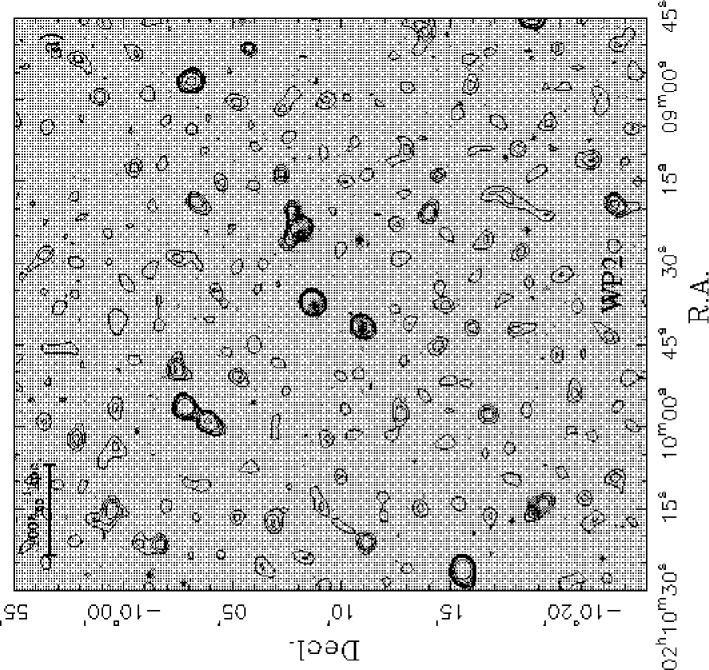
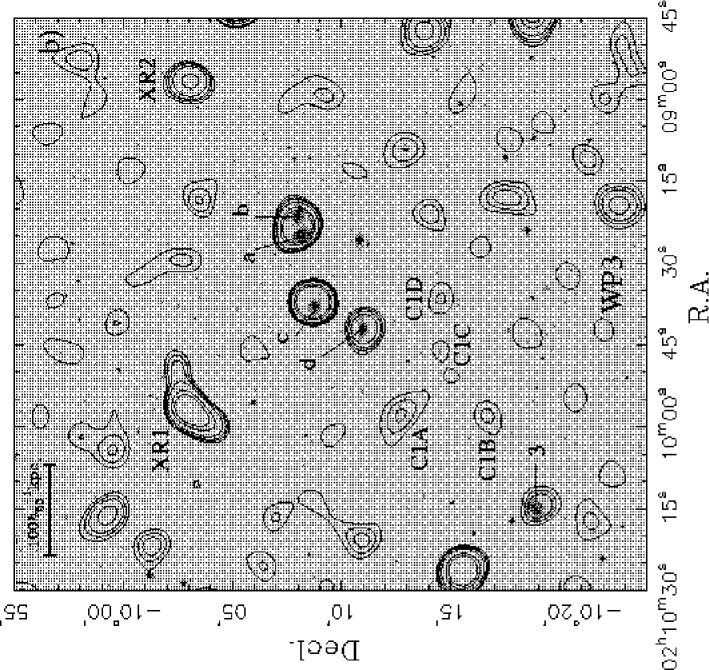
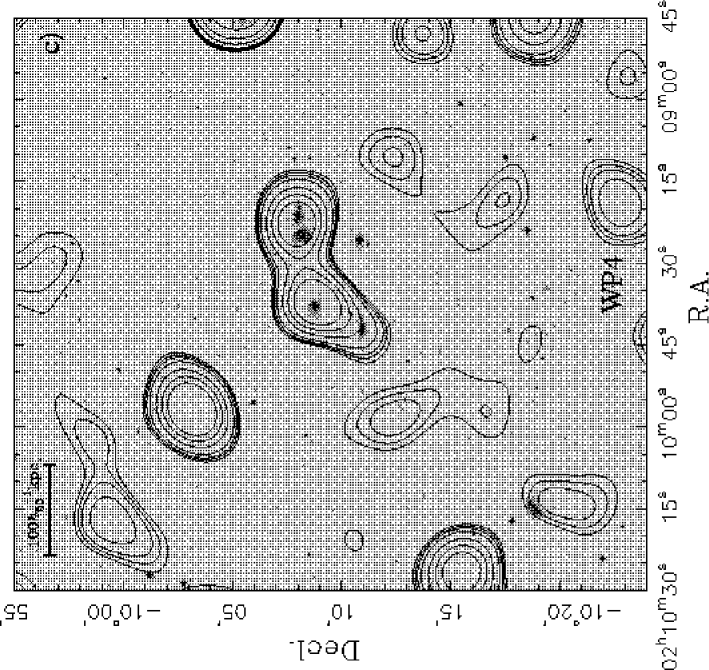
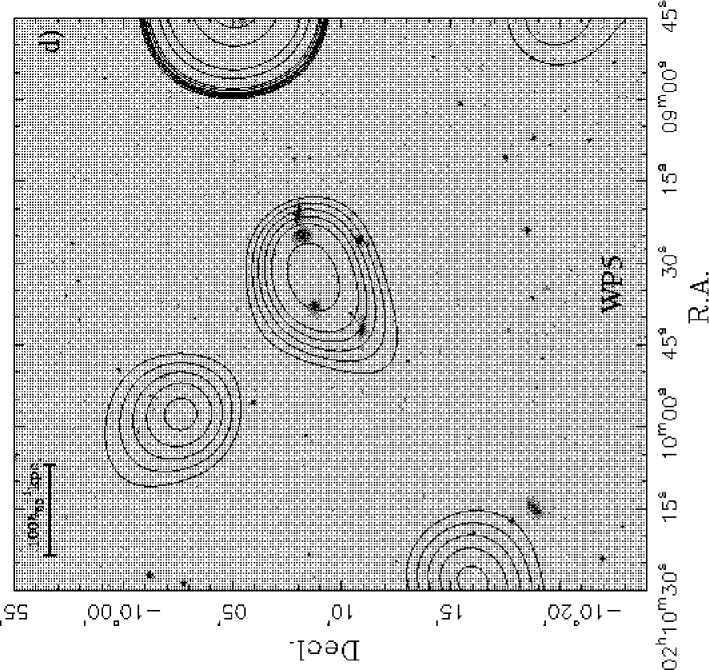
Fig. 3 shows the wavelet contours of WPs 2, 3, 4 and 5, respectively. We do not take WP1 into account, since it is highly contaminated by small-scale noise in the original image, nor WP6 and higher, which smooth the group on too large a scale to prove useful. Structures seen only at the level are should mostly be artefacts.
There are two ways we can ensure that a detected source is real: First, if a source is detected in more than one WP, its probability of being true is enhanced. Indeed, random noise is not correlated between WPs and cannot produce large spatial overdensities. Moreover, it cannot produce pixels high enough to leave some power on larger scales. Second, the probability of a false X-ray detection being randomly superimposed on an optical or radio source is very low. Consequently, we will search for small-scale X-ray sources in regions C1, C4 and C5, detected in several WPs and roughly superimposed on optical and/or radio sources.
3.4.2 Nature of region C1
The multiple nature of region C1 (Sect. 3.3.3) is confirmed by the inspection of the Wavelet Planes. Four of the sources present in WP2 are also detected in WP3 (marked C1A, C1B, C1C and C1D in Fig. 3b). The first two are still detected in WP4, where the smoothing is so strong that only an extended region remains, comparable to C1, with two local maxima (at C1A and C1B) and an evidence of distortion by C1C. Note that sources C1A and C1B were detected at and cut using the local detection algorithm DETECT provided in the PSPC Extended Source Cookbook. Thus, the excess photons measured in Sect. 3.3.2 do not take these sources into account. But, it is very likely that the majority of the diffuse gas is related to these sources.
We now examine sources C1A, C1B, and C1C and compare with their optical and radio counterparts:
-
•
Source C1A:
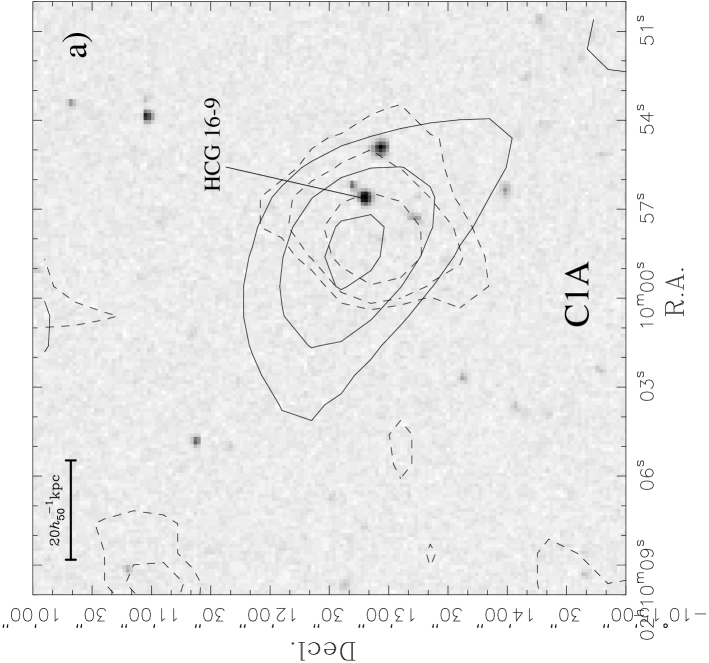
Fig. 4a shows a zoomed optical image of C1A, together with WP3 contours (solid) and radio contours (dashed). There is an NVSS radio source less than away from this X-ray source. Both sources are coincident with two optical sources. Moreover, in Fig. 4a, we verify that the western part of the radio source is aligned with the elongated X-ray source and with the direction defined by the two optical sources. The second of these optical sources is an emission line galaxy, HCG 16–9, observed spectroscopically by RdC3Z. Its recession velocity was measured as more than , i.e. it is a background galaxy superimposed on the group. The other optical source is comparable in size and magnitude to HCG 16–9, and although we don’t have any spectroscopic evidence for this, it is unlikely that this galaxy lies at the redshift of HCG 16.
The coincidence of an X-ray, a radio and two optical sources, with one having a radial velocity larger than the group makes it very unlikely that C1A is linked to the group. The radio source denotes a point source, but the X-ray emission seems to be extended. It is difficult to say much more about this source. If it is at the distance of HCG 16–9 (), its extension is several hundreds of kpc. It may be a background X-ray group with two prominent galaxies.
-
•
Source C1B:
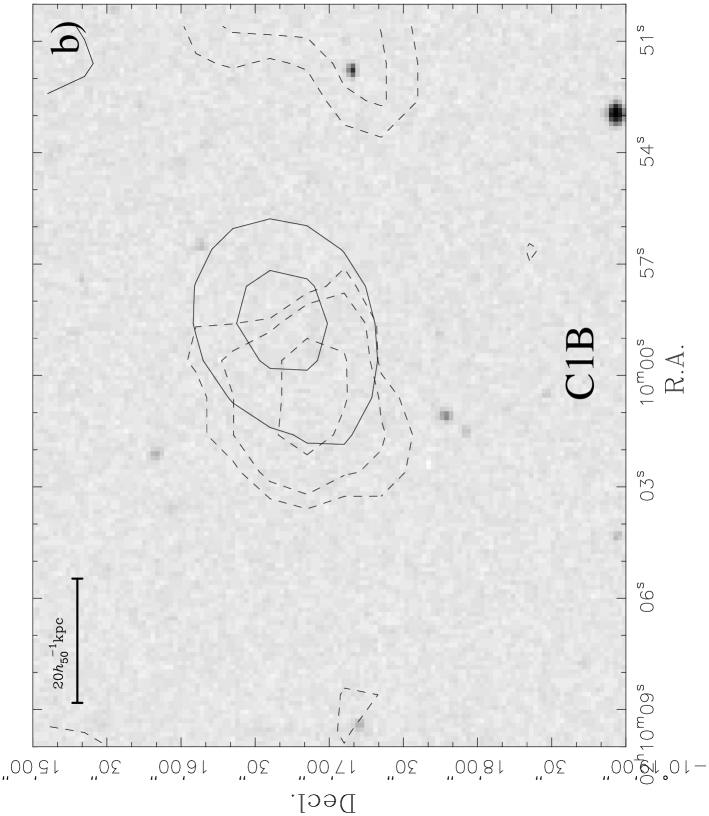
Fig. 4b shows that an NVSS radio source is overlapping the X-ray extended structure, at from the X-ray local maximum. The probability that this superposition is random is less than , without taking into account the X-ray position uncertainty (see Condon et al. 1998). No optical source corresponding to C1B is detected either in the DSS or in de Carvalho et al. (1994). Here again, the superposition of a radio and an X-ray source (with no optical counterpart this time) puts serious doubts on the link between C1B and the group and on the diffuse nature of C1. Moreover, only net counts originate from C1B (after the point source is masked).
-
•
Source C1C:
A total of net counts are emitted from region C1C, which is detected as a local maximum in WP2 and WP3. No radio counterpart is detected, but a star is found from the X-ray peak (Figs. 2b and 3b), whose magnitude is according to the ROE/NRL COSMOS UKST Southern Sky Object Catalog. Given that according to the COSMOS catalog there are brighter stars in a box centered on HCG 16, Poisson statistics yield a probability of of having 1 or more stars within from the center of C1C. We thus conclude that the X-ray emission of C1C is linked to a foreground star. The ratio (as defined by Motch et al. 1998) is 0.01, i.e. in the upper range for stars (see Fig. 3 of Motch et al.). Note that its X-ray emission was not excised because it was just below the excision threshold.
-
•
Source C1D:
net counts (8% of the counts in regions C2-C3-C4, and 16% of the counts in C1, see Table 5) are detected in region C1D, which has no radio nor optical counterpart. We do not incorporate this source in our spectral analysis, but do include it in our total group diffuse luminosity.
In summary, of the four components of C1, one (C1A) is linked to a background galaxy and a radio-source, one (C1B) is a radio-source, one (C1C) is a foreground star, and one (C1D) contributes marginally at best to the group diffuse emission. Therefore, at best, only one-sixth of the X-ray emission from C1 is connected to diffuse gas in HCG 16.
3.4.3 Nature of regions C4 and C5
The same analysis can be repeated with regions C4 and C5 (regions C2 and C3 are directly around the galaxies of the group, and the excess photons are likely to be produced in the group).
-
•
Region C4:
Region C4 has an extended structure with three prominent local maxima, even in Fig. 1, where the FWHM of the smoothing is only . The three aligned maxima are still apparent at (Fig. 2c) and somewhat at . (Fig. 2b). They are also recovered in WP2. A double structure remains in WP3 and is finally merged in WP4. No radio or identified optical source is found superimposed on C4. This reinforces its diffuse nature, without ensuring that this excess is linked to the group, even if this seems a reasonable assumption. Indeed, the two interacting galaxies HCG 16a and 16b lie at in projected distance from C4. This gas could have been ejected by these galaxies (see Sect. 5).
-
•
Region C5:
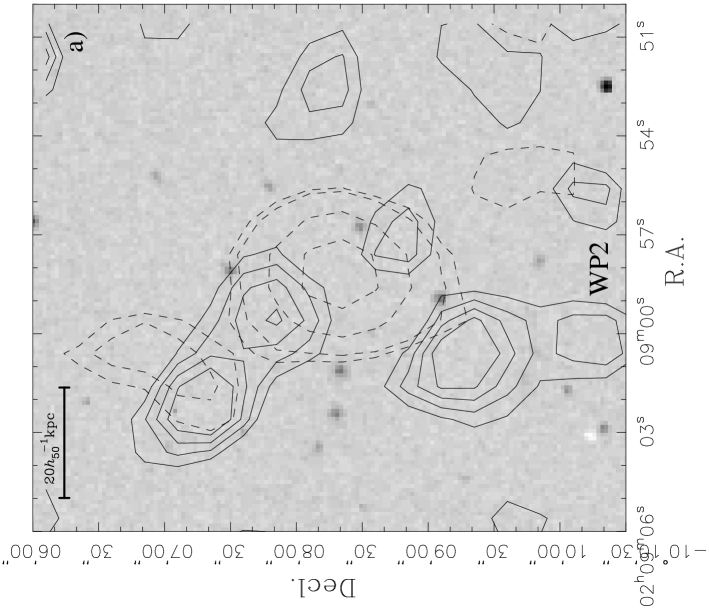
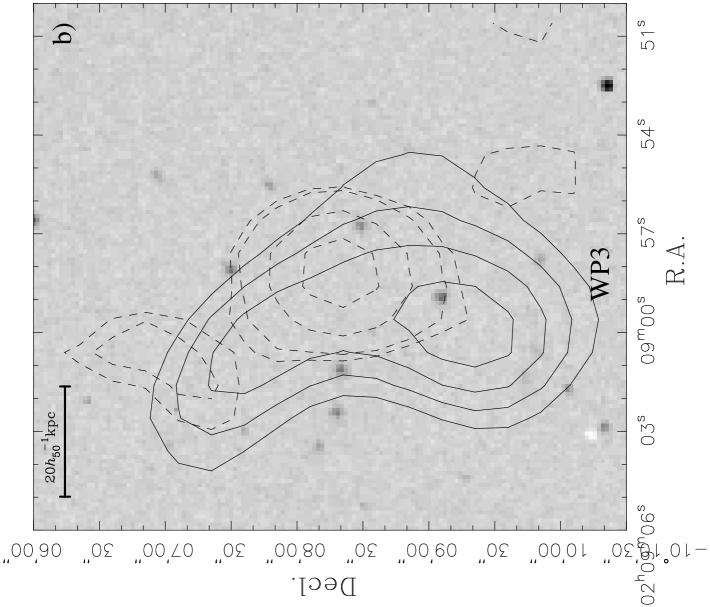
Figure 5: Radio (dashed) and WP2 (a), WP3 (b) wavelet plane (solid) contours of C5 superimposed on an optical image. Note the several maxima comprising the X-ray emission, and the numerous unidentified optical sources present in this area. Figs. 5a and b show the superposition of optical, radio and X-ray wavelet planes WP2 and WP3, respectively. Region C5 has a complex X-ray structure, and several local maxima can be seen in WP2, which merge into a single structure in WP3. An NVSS radio source is superposed with the extended structure in WP3, and the prominent three X-ray sources are situated at distances of 35, 80, and from the peak of the radio emission. Given cumulative source counts of and for 1.4 GHz radio fluxes greater than 5 and respectively (Condon et al. 1998), and the 82% NVSS coverage of the celestial sphere, we infer 20.7 NVSS sources brighter than per square degree. Therefore, Poisson statistics yield respective probabilities of 0.6%, 3.2% and 4.5% of having each of the three X-ray sources as close as they are to the radio-source.
Likewise, at least six optical sources are clearly visible within the outer WP3 isophotes of C5, of which two are COSMOS galaxies brighter than , and there is an additional COSMOS galaxy lying just outside of the outer WP3 isophote (to the East). Within the box centered on the group, there are 34 galaxies in COSMOS with . Poisson statistics then yield a 3.6% probability of having as least 3 COSMOS galaxies within of the WP3 outer contour (in a region).
If these 3 galaxies were at the distance of HCG 16, their typical separations would be and they would all be less luminous than the SMC. We would then have a very compact subgroup of very faint dwarfs detached from Hickson’s original compact group of 4 bright galaxies.
The alternative of a background group or cluster appears much more plausible, given that subgroups of very faint dwarfs have never been discussed, and that there is X-ray emission apparently associated with this group or cluster.
Therefore, the concordance of the radio source with 3 X-ray sources, coupled with the large galaxy surface number density in C5, strongly suggests that C5 is not associated with diffuse emission from HCG 16.
3.5 Summary
We have shown that the detection of diffuse gas within a radius of around HCG 16 reduces to the significant detection of five regions of diffuse X-ray emission, filling less than half of the circle. The small-scale structure of these regions, together with associations with optical and radio point sources, allows us to reject two of these regions (C1 and C5) as related to point sources or background extended sources. There thus remains three diffuse emission regions, two (C2 and C3) surrounding the four bright galaxies and the other (C4) away from the two interacting galaxies HCG 16a and HCG 16b. A better understanding of the gas physics in these regions requires an examination of their spectra.
4 Spectral analysis
The spectra are extracted using the QPSPEC task in the IRAF/PROS environment. Again, we restrict our analysis to the energy range unless otherwise noted. We first compare the shapes of the spectra (before background subtraction) of different regions with that of the background.
4.1 Spectral shapes
The shapes of the spectra, , in specific regions are compared to the shape of the background spectrum, , renormalized to the total counts of the spectrum of the region of interest. For this, we use likelihoods with Poisson statistics:
where is the spectral channel. We resort to sets of Monte-Carlo trials to derive probabilities that the s of simulated background spectra drawn from the observed background, measured relative to the normalized background spectrum are smaller than the observed measured between the spectra of a given region and of the normalized background. The simulated spectra are drawn from a Poisson distribution to match the normalized background spectrum in each energy channel, i.e. with expected simulated counts .
| Region | Total counts | ||
|---|---|---|---|
| C2+C3+C4 | 663 | 0.026 | |
| C6 | 974 | 0.258 |
The fourth column represents the probability (from Monte-Carlo simulations) that the region has a spectral shape consistent with that of the background.
Table 6 shows the resultant probabilities that each spectral region has a spectrum with the same shape as that of the background. Not only does the region of excess emission, C2+C3+C4 present an excess of counts, but it also has a spectrum whose shape is significantly different from that of the background, while region C6 with negligible net counts has a spectral shape consistent with that of the background. Hence, the spectral shape analysis confirms that the regions of excess counts are indeed the locations of X-ray emission and not caused by poor background subtraction.
4.2 Spectral fits
The background-subtracted, point-source excised spectra were then fit to a hydrogen absorbed (Balucinska-Church & McCammon 1992) MEKAL (Mewe et al. 1985, 1986, with Fe L calculations by Liedahl et al. 1995 and the ionization balance from Arnaud & Rothenflug 1985) plasma, using XSPEC version 10, with minimization. A vignetting correction of the background was performed before the background-subtracted spectrum was analyzed.
Table 7 shows the parameters we used for extracting the galaxy spectra. Table 8 presents the results of our spectral fitting to different regions within HCG 16. There remains many instances where energy channels have fewer than 10 net counts, and the Poisson statistics do not resemble gaussians, hence our spectral fits are not fully appropriate. Therefore, the reduced values and the 90% error bars given in Table 8 should not be over-interpreted.
| Galaxy | RA | Dec | radius |
|---|---|---|---|
| (J2000) | (arcmin) | ||
| HCG 16a&b | 1.5 | ||
| HCG 16c | 1.2 | ||
| HCG 16d | 1.1 | ||
| HCG 16–3 | 1.1–0.9 | ||
The spectrum of HCG 16–3 was extracted from an ellipse.
| Region | Energy range | Net | ||||||||
|---|---|---|---|---|---|---|---|---|---|---|
| (keV) | Counts | (keV) | () | () | () | (/d.o.f.) | () | |||
| C2+C3+C4 | 0.20–1.40 | 125 | (0.05) | galactic | 31.4 | 0.64 | 0.39 | 0.68 | 2.13 | |
| 0.1 | galactic | 24.5 | 0.61 | 0.43 | 0.69 | 2.32 | ||||
| 1 | galactic | 4.5 | 0.69 | 0.48 | 0.71 | 3.31 | ||||
| 10 | galactic | 0.5 | 0.71 | 0.48 | 0.72 | 3.69 | ||||
| C4 | 0.20–1.31 | 71 | 0.1 | galactic | 11.9 | 0.30 | 0.23 | 0.36 | 1.03 | |
| 1 | galactic | 2.3 | 0.33 | 0.26 | 0.38 | 1.53 | ||||
| 10 | galactic | 0.3 | 0.33 | 0.27 | 0.38 | 1.69 | ||||
| HCG 16a&b | 0.20–2.01 | 232 | galactic | 16.5 | 0.58 | 0.97 | 1.21 | 1.99 | ||
| 0.1 | galactic | 21.8 | 0.63 | 0.96 | 1.27 | 2.30 | ||||
| 1 | galactic | 4.0 | 0.74 | 0.90 | 0.99 | 1.40 | ||||
| HCG 16c | 0.20–2.01 | 213 | galactic | 7.3 | 0.39 | 0.93 | 1.01 | 1.42 | ||
| 0.1 | galactic | 20.3 | 0.90 | 0.86 | 1.13 | 2.00 | ||||
| 1 | galactic | 4.0 | 0.37 | 0.94 | 1.02 | 1.42 | ||||
| HCG 16d | 0.20–2.01 | 83 | 0.1 | galactic | 7.2 | 0.32 | 0.31 | 0.41 | 0.71 | |
| 1 | galactic | 1.5 | 0.27 | 0.31 | 0.35 | 0.53 | ||||
| (0.12) | 0.1 | (41) | (123) | 0.19 | 0.14 | 0.16 | 190 | |||
| (0.11) | 1 | (44) | (240) | 0.19 | 0.14 | 0.16 | 1770 | |||
| HCG 16–3 | 0.20–2.01 | 32 | (0.49) | 0.1 | galactic | 2.3 | 0.23 | 0.08 | 0.11 | 0.21 |
| (0.29) | 1 | galactic | 0.6 | 0.21 | 0.10 | 0.12 | 0.23 | |||
Column (1): region. Column (2): energy range used for the spectral fit. Column (3): net counts in the given energy band (hence lower than the net counts in Table 5). Column (4): temperature. Column (5): metal abundance. Column (6): absorbing hydrogen column density (the galactic value is , Stark et al. 1992). Column (7): volume emission measure, defined as . Column (8): reduced (per degrees of freedom) of fit. Their values are low because the noise is not gaussian. Column (9): X-ray luminosity in the band. Column (10): bolometric X-ray luminosity, uncorrected for absorption. Column (11): bolometric X-ray luminosity, corrected for absorption. The error bars are 90% confidence levels for one interesting parameter. Values in parentheses indicate provide the best fit when the fit was unconstrained (i.e., when the 90% confidence levels could not be determined). Values of the metal abundance without error bars nor parentheses were frozen in the fit.
The low net counts in our background-subtracted spectra (Table 8) make it difficult to perform reliable spectral fits for temperature, metal abundance, and absorbing column. Indeed, decent spectral fits require at least 500 net counts, whereas we have typically 2 to 7 times less. Nevertheless, the spectra often do have sufficient counts to provide decent constraints on the gas temperature, as well as on the bolometric luminosity, once metal abundance and absorbing Hydrogen column are fixed to reasonable values. Note the large absorption corrections on the bolometric luminosity, especially for the lower best fit temperatures, where the emission is peaked at low energies, which are the most seriously affected by absorption.
The temperature of the diffuse emission is well constrained: the diffuse emission is cool at (with much narrower 90% confidence intervals for fixed metal abundance). All fits produce an upper-limit (90% confidence level) of 0.56 keV. The metallicity is completely unconstrained.
The spectral fits from region C4 (offset from the group galaxies) are similar to that of the total diffuse emission, and C4 accounts for roughly half of the total luminosity of the diffuse emission. However, C4 could be hot if its metal abundance is low. Fig. 6 shows the best-fit MEKAL spectrum for region C2+C3+C4 together with the residual error per bin. The fit is adequate, hence no additional galactic absorption nor additional component is required by the spectrum.

The galaxy pair HCG 16a&b and galaxy HCG 16c both emit more X-ray luminosity, before correction for absorption, than the group, illustrating the difficulty of absorption corrections in low temperature spectra.
With only 83 photons the spectrum of HCG 16d produces virtually no constraints on temperature or metallicity. Nevertheless, careful inspection of the spectrum reveals that the first energy channels (between and ) have very low net counts, even taking into account the great error bars, suggesting strong hydrogen absorption, as confirmed by the best fits with variable absorption, which produce a column density 20 times the galactic value. However, the absorption correction to luminosity then becomes enormous and produces unreasonably high absorption-corrected bolometric luminosities.
4.3 Comparison with other X-ray results on HCG 16
4.3.1 Group diffuse emission
The EINSTEIN satellite pointed for at HCG 16 with the IPC detector. The analysis of these observations by Bahcall et al. (1984) led to counts for the entire group (galaxies plus intergalactic medium), corresponding to a luminosity of . But the limited sensitivity and angular resolution of the IPC didn’t allow separating the galactic and intergalactic components.
Saracco & Ciliegi’s (1995) analysis of the ROSAT PSPC observation of HCG 16 led to the conclusion that the X-ray emission was due to point sources associated to the galaxies and not to a diffuse intra-group medium. By assuming and , they obtained a upper limit on diffuse emission of in the band, after converting this flux to luminosity correctly (see footnote in Sect. 1 and Table 8), i.e., below our fitted luminosity in the same energy band.333adopting instead of produces roughly the same upper limit.
On the other hand, PBEB, who analyzed the same data as Saracco & Ciliegi, but in the full PSPC energy band, found an excess of photons in an radius circle corresponding to a bolometric luminosity of . Their factor of 16 discrepancy with Saracco & Ciliegi can be subdivided into three terms: 1) a factor 3.4 caused by the correction for Hydrogen (and Helium) absorption, 2) a factor 1.6 caused by the narrower energy band used by Saracco & Ciliegi, and 3) a factor 3.0 unexplained residual term. The adaptive smoothing of the image (PBEB’s Fig. 2) indeed showed two diffuse extensions on both sides of the group galaxies, roughly corresponding to the regions C1 and C4 defined in Sect. 3.3.1.
Our spatial analysis is performed over an intermediate energy band (, see Sect. 2.1). From our spectral fit to the diffuse emission (regions C2+C3+C4), we find , only slightly higher than the upper limit of Saracco & Ciliegi. Our bolometric luminosity is (after adding 9% extra luminosity to include region C1D, assuming that it has the same spectrum as the rest of the group emission). Thus our derived bolometric luminosity for the diffuse emission is half that of Ponman et al. (1996).
Summing up from our Table 5, our circle around HCG 16 has 306 net counts. In comparison, we infer from the surface brightness profile of PBEB (their Fig. 1) that they measure 281 net counts within a circle of radius around HCG 16. In both cases, the group galaxies and point sources exceeding a threshold were excised. Thus, the difference (although within the error bars) between PBEB’s net counts and ours can be attributed to a different background region. Indeed, their background region was chosen to be an annulus of radii between and , while ours was taken between and (see Table 1). We showed in Sect. 2.2 that the mean background value increases with off-center radius, which explains our higher net counts. But this can certainly not explain the discrepancy in luminosity. Hence, the discrepancy between the high luminosity measured by Ponman et al. (1996) and our low luminosity for the diffuse emission is not caused by different background subtraction or different removal of the emission from bright galaxies, but by Ponman et al.’s inclusion of regions associated with radio or optical galaxies, some of which are definitely background objects.
We do agree with PBEB that this diffuse emission is cool, as they find , consistent with our values. Note that the correction for absorption is as large as 3.5 at temperatures as low as and increases rapidly for decreasing temperature. Hence, while our bolometric luminosity, uncorrected for absorption, depends little on the fit, the absorption corrected luminosity is less certain.
From Table 5, region C6 has net counts. Hence the 90% confidence () and confidence upper limits for diffuse emission in C6 are 50 and 103 net counts, respectively. We convert these net counts to luminosities assuming the same spectrum as region C2+C3+C4, which has 172 net counts according to Table 5. After correction for galactic absorption, this yields (90%) and ). Hence, region C6 contributes little to the diffuse X-ray emission of the group (unless it is much cooler, hence more absorbed).
4.3.2 X-ray emission from the group galaxies
Our luminosities for the galaxies match fairly well those of SC95, who had simply assumed the galaxies to have temperature and solar metallicity: our luminosities are 1%, 12% and 28% lower for HCG 16a&b, HCG 16c, and HCG 16d respectively.
The extent of the diffuse X-ray emission around each galaxy or pair in HCG 16 is fairly large () in comparison with the extent of the X-ray emission detected by Henriksen & Cousineau (1999) around spiral pairs or by Read & Ponman (1998) around most interacting pairs. Fig. 15 of Read & Ponman shows that only the pairs closest to maximum interaction show such large extents of their diffuse X-ray emission, but their diffuse-X-ray to optical luminosity ratio are factors of 5 larger than for the HCG 16ab pair.
5 Discussion
We estimate below the total dynamical mass of the group, the baryonic fraction together with the separation of the baryonic mass into its different components (namely, hot gas, HI, and stars) and the possibility of virialization of HCG 16.
5.1 Mass budget of HCG 16
5.1.1 Total dynamical mass
| Group | |||||||||
|---|---|---|---|---|---|---|---|---|---|
| (arcmin) | () | () | () | ||||||
| Hickson (1982) | 4 | 3.2 | 74 | 99 | 1.1 | 1.1 | 0.9 | 0.7 | 0.4 |
| Ribeiro et al. (1996) | 7 | 16.9 | 389 | 76 | 2.0 | 2.0 | 2.0 | 1.9 | 0.8 |
Column (2): number of galaxies. Columns (3) and (4): radius of the smallest circumscribed circle containing the galaxies, in arcmin and in kpc respectively. Column (5): unbiased sample velocity dispersion (corrected for the measurement errors, see Eq. [3]). Columns (6), (7), (8), and (9): virial, projected, average and median mass estimates from Heisler et al. (1985), respectively. Column (10): projected mass estimate for isotropic orbits from Bahcall & Tremaine (1981). These mass estimates do not include correction for measurement errors, and are thus slight overestimates.
The total mass of the group can be estimated, to first order, assuming that the group is in dynamical equilibrium (we will return below to the relevance of this assumption). Table LABEL:massopt presents the estimates for the total mass of the group using either the 4 original galaxies (Hickson 1982) of HCG 16, or adding to them the three additional galaxies that were found by de Carvalho et al. (1994) in the close environment of HCG 16, and confirmed spectroscopically by RdC3Z. We apply the mass estimates of Heisler et al. (1985) relevant to self-gravitating systems as well as the projected mass of Bahcall & Tremaine (1981), relevant to test objects orbiting within an underlying potential. We use the radial velocity measurements and errors from RdC3Z. For the velocity dispersion, we computed
| (3) |
We adopt the median of the four Heisler et al. mass estimates, as we deem it unlikely that the galaxies are test particles in a potential, since we do not detect this potential in diffuse X-rays. Interpolating the total mass at , within which we have constraints on the gas content of the group, then yields . For a spherical group, this yields a density that is 256 times the critical density of the Universe or 770 times the mean density if .
Of course, the reliable estimation of the total gravitating mass of the group is difficult with only four to seven galaxies. Moreover, the group may not be in virial equilibrium (see Sect. 5.2.1 below). Mamon (1993, 1995) has quantified the effects of departures from virial equilibrium on the estimation of the masses of groups, initially following the Hubble expansion, taking into account the softened nature of galaxy potentials. If the galaxies were point masses, the mass of a galaxy system near full collapse should be half of the mass inferred from dynamical equilibrium (hereafter virial mass), as is well known. But since galaxies have softened potentials, the velocity at closest approach is only a little larger than for the future virialized system (before it coalesces). So, the virial mass should provide an adequate estimate of the mass — within the apparent radius of a galaxy system near full collapse. Hence the masses given in Table LABEL:massopt are probably roughly correct, unless projection effects are important in HCG 16.
5.1.2 Mass in hot gas
An upper limit to the observed mass of the diffuse intergalactic gaseous medium (IGM) can be estimated from the normalization of the MEKAL plasma model, which is the Volume Emission Measure (VEM) defined by
| (4) |
where is the volume of the emitting region, and are the electron and proton densities. Including the contribution from Helium, the gas mass is
| (5) |
where is the proton mass and the Helium mass fraction. Since (the equality being reached for a plasma of uniform density), Eqs. (4) and (5) lead to
| (6) | |||||
where we took a distance and , and where is the angular radius of the extended emission, and is the angular radius at which the emission from a possible group galaxy was cut.
Eq. (6) is valid for spherical diffuse regions. Whereas, C3 and C4 are nearly circular, C2 is close to being comprised of two circles. The VEM of C4 is taken from Table 8, while that of C2 and C3 are each taken as half the difference of the VEM of C2+C3+C4 in Table 8 minus the VEM of C4. Moreover, both circular regions of C2 are assumed to have the same VEM. Table 10 presents the estimates of the upper limit to the mass in diffuse intergalactic gas for the various regions of diffuse emission. Summing up the contributions of the different regions of diffuse X-ray emission, we obtain .
| Region | |||||
|---|---|---|---|---|---|
| () | (arcmin) | () | () | ||
| C2A | 4.9 | 1.7 | 1.2 | 0.24 | 212 |
| C2B | 4.9 | 1.7 | 1.2 | 0.24 | 212 |
| C3 | 9.8 | 1.9 | 1.2 | 0.49 | 269 |
| C4 | 11.9 | 2.0 | 0.0 | 1.2 | 412 |
| C2+C3+C4 | 31.5 | 2.2 | 309 | ||
| C6 (face value) | 2.5 | 8.0 | 0.0 | 4.3 | 24 |
| C6 (90%) | 12.6 | 8.0 | 0.0 | 9.6 | 53 |
| C6 () | 25.9 | 8.0 | 0.0 | 13.8 | 76 |
The last column is the upper limit to the density of hot gas in units of the critical density of the Universe.
One does not gain much in attempting to fit a model to each diffuse region. Indeed, if the gas density profile is , as in the isothermal model with (close to the slope found by Ponman & Bertram 1993, for HCG62), then Eqs. (4) and (5) lead to
where . is always greater than 0.87 for . If, on the other hand, one assumes as found by Mulchaey & Zabludoff (1998), Eqs. (4) and (5) lead to
which falls to 0.47 for (close to what we infer was derived by Mulchaey & Zabludoff, but to 0.25 for . Hence, the uniform approximation for the mass of diffuse gas is probably valid to within a factor of two or at worst four.
An upper limit to the gas mass from region C6 can be estimated, assuming that it is a sphere of radius, and that its temperature and metal abundance are the same as the best fit case for regions C2+C3+C4. The upper limits for C6 are provided in Table 10, with the face value counts, the 90% upper limit or the upper limit. The gas mass of C6 is poorly constrained in contrast with its diffuse X-ray luminosity. However, Table 10 shows that if the undetected region (C6) has similar temperature, metallicity and clumpiness as the detected regions (C2+C3+C4), then its mass-density is at most ( limit) one-quarter that of the detected regions. Similarly, its mean X-ray surface brightness is at most one-sixth that of C2+C3+C4. Hence, the low emission of C6 is not merely a statistical fluctuation in X-ray counts, but indicative of a true underdensity in the distribution of hot diffuse gas.
In summary, we obtain four upper limits to the mass in diffuse hot gas within from the group center: (if the 10 counts in C6 are just noise), (taking the 10 counts in C6 at face value), (with 90% upper limit on C6), and (with limit on C6).
5.1.3 Baryonic fraction
Within an radius from the group center, the molecular gas mass is (Leon et al. 1998), while the mass in cold HI gas is slightly less than (Williams 1998, whose VLA map shows that a small fraction of the diffuse HI emission extends beyond the radius circle around the group). Note that the contributions of dust and ionized hydrogen (estimated by MPABB), though important in comparison with other galaxies, are negligible within the mass budget of HCG 16. Thus, if the 10 counts measured in region C6 are just noise or taken at face value, the mass in diffuse hot gas is much smaller than the mass in cold gas and fairly negligible within the total mass budget of HCG 16.
The fraction of baryons within of the optical center of HCG 16 is
| (7) | |||||
where is the mean stellar mass-to-light ratio for the group and is the mass fraction of the group in hot gas, and is 1.5%, 5%, 8% or 11% depending on the interpretation of the 10 net counts in region C6 (noise, face-value, 90% limit and limit, respectively).
Because the galaxies in HCG 16 have probably all undergone fairly recent bursts of star formation (e.g. Ribeiro et al. 1996), their stellar mass to blue luminosity ratios are probably much lower than for normal spirals (i.e. ). There are two ways to estimate for each of the four bright galaxies in HCG 16.
First, MPABB mentioned that galaxies HCG 16a and 16c have rotation velocities consistent with the Tully-Fisher (1977, hereafter TF) relation, whereas galaxy HCG 16d has a rotational velocity at most half of what is expected by the TF relation. This translates to a luminosity that is at least 16 times larger than expected from the TF relation. Assuming that such was also the case for galaxy HCG 16b (its low rotation velocity on one side is also half of what is expected from the TF relation, although its high rotation velocity on the other side is consistent with the TF relation), this leads to assuming for the group of 4 galaxies.
Alternatively, can be constrained by the times since the last bursts of star formation in each of the 4 bright galaxies of HCG 16. These times can be inferred from the optical colors of the galaxies or from their X-ray properties. Table 11 provides the values of inferred from the colors of the 4 bright galaxies, using Fioc and Rocca-Volmerange’s (1997) PEGASE spectral evolution model, assuming a single burst, a Rana & Basu (1992) initial mass function, and solar metallicity.
| Galaxy | Age | ||||||
|---|---|---|---|---|---|---|---|
| (Gyr) | () | ||||||
| HCG 16a | 12.99 | 12.76 | 0.82 | 0.72 | 0.50 | 0.39 | 3.0 |
| HCG 16b | 13.74 | 13.27 | 1.07 | 0.86 | 0.68 | 0.52 | 2.5 |
| HCG 16c | 13.40 | 13.10 | 1.04 | 0.91 | 0.71 | 0.57 | 3.2 |
| HCG 16d | 13.90 | 13.42 | 1.29 | 1.08 | 0.95 | 0.75 | 3.1 |
Column (1): Galaxy name. Columns (2), (3), and (4): Asymptotic blue magnitude before and after correction for Galactic and internal extinction, and mean color within the isophote, all from Hickson, Kindl, & Auman (1989). Column (5): Color corrected for galactic and internal reddening using . Columns (6) and (7): age and from the PEGASE spectro-photometric evolution model of Fioc & Rocca-Volmerange (1997). Column (8): Mass in stars.
The stellar masses in Table 11 yield for the group of 4 galaxies. With this value of , Eq. (LABEL:fbaryonic) yields a baryonic fraction of 18% or 21% if the emission from C6 is respectively noise or taken at face value, and as much as 25% (90% limit on C6) or 28% ( limit on C6).
Note that if significant star formation occurred before the last burst, the mean colors of the galaxies would be redder than with the most recent starburst. Therefore, blue colors indicate even more recent starbursts than listed in Table 11. This in turn leads to lower and an even lower baryonic fraction. Moreover, if , then there is more mass in cold (HI+H2) gas than in stars.
5.2 The dynamical state of HCG 16
The knowledge of the dynamical state of the HCGs is primordial to assess the reality of these close associations of galaxies on the sky. In paper II, we show that the low velocity dispersion of HCG 16 is indicative of a non-virialized dynamical state, but show that the alternative scenario of chance alignments is even less likely for HCG 16. Here, we just want to briefly emphasize two points: is the peculiar X-ray morphology found in HCG 16 compatible with virialization, and are the X-ray properties deduced from ROSAT data reduced here compatible with chance alignment models?
5.2.1 Can a virialized group have an irregular X-ray morphology?
If HCG 16 were in a (nearly) virialized state, the galaxy halos should have merged, and thus the global group potential should be fairly smooth. Moreover, the diffuse gas associated with these halos should have also merged, and reached hydrostatic equilibrium within this smooth potential. For example, HCG 62 is the archetype of such a virialized group, as its X-ray morphology is smooth and the diffuse X-ray emission extends well beyond the HCG galaxies (Ponman & Bertram 1993). The significant gas density at the group center is attested by the presence of a cooling flow, as witnessed by the increase in surface brightness and the cooler temperature of the inner (Ponman & Bertram 1993).
The X-ray morphology of HCG 16 is very different from that of HCG 62. The diffuse X-ray emission is situated within around the galaxies, plus in one clump (C4) at from the nearest galaxy. This clumpy X-ray morphology strongly suggests that HCG 16 is far from virialization.
This argument against virialization supposes that intergalactic gas, at the time of formation of the group, was able to settle in hydrostatic equilibrium in the shallow potential of HCG 16. This point of view can be challenged if the specific entropy of the intergalactic gas at this epoch is high enough to prevent the gas from collapsing with the dark matter (Ponman, private communication). Indeed, assuming the infalling gas has the density of the Universe at the epoch of group collapse, there is a maximum temperature above which the specific entropy of the infalling gas will be higher than the specific entropy of the gas settled in equilibrium in the potential of the group. Since the gas entropy cannot decrease (unless the gas radiates), this constraint gives a maximum temperature above which the gas cannot settle in the dark matter potential.
This (relatively) high specific entropy intergalactic gas still lacks direct observation, but it is indirectly inferred from the changes in the X-ray surface brightness profiles from clusters to groups (Ponman, Cannon, & Navarro 1999). Also, the high temperature level is required in the interpretation of a number of observational facts. For example, the negative result of the Gunn-Peterson effect implies that the Universe had an overall reionization (and therefore probably reheating) phase before . Moreover, the steepening of the relation from clusters to groups (PBEB) has so far only been explained in models where the infalling gas was preheated at a temperature of (Cavaliere et al. 1997, 1998; Balogh et al. 1999). Thus, provided that HCG 16 is forming today, we can understand its irregular X-ray morphology as a consequence of its low virial temperature, which does not exclude that the underlying dark matter potential is relaxed. Finally, hydrodynamical cosmological simulations indicate that most of the intergalactic gas is in the temperature range (Cen & Ostriker 1999).
If intergalactic gas cannot collapse onto the group, then the diffuse gas observed in the group originates primarily from the galaxies of the group, in the form of shock-heated tidally stripped gas or hot winds from collective supernovae ejecta. In the latter case, the diffuse hot gas should be metal-rich. Our spectral fits do not constrain the metallicity of the group, whereas PBEB found for the diffuse gas that they detected. Since half of their detected emission arises from the radio sources in regions C1 and C5, we cannot confirm the low metallicity of the HCG 16 diffuse gas. Better signal-to-noise observations are required to answer this question, in particular better constraints on metallicity and its spatial variation in the group.
Whether or not the group is near virial equilibrium, the hot gas appears too clumpy to be itself in hydrostatic equilibrium within a nearly spherical potential.
5.2.2 Chance alignment models
Difficulties in the understanding of the properties of HCGs (in particular their short crossing-times) have led some authors to the conclusion that most of these objects are chance alignments along the line-of-sight within larger structures, namely loose groups (Mamon 1986), clusters (Walke & Mamon 1989) or cosmological filaments (Hernquist et al. 1995).
Loose groups are obviously not dense enough to be globally near full collapse (although their cores may have already collapsed and formed interacting binaries), and are more likely to be in their early phases of collapse (Diaferio et al. 1993; Mamon 1993, 1994, 1995), as is our Local Group, or even in the late stages of their Hubble expansion before their turnaround (Valtonen & Byrd 1986). Thus, one does not expect to see diffuse gas in a compact group caused by a chance alignment within a collapsing near-spherical loose group. Indeed, if loose groups have diffuse intergalactic gas, this gas is too tenuous to be observed. Moreover, this gas should remain fairly cold until it relaxes with the group potential, and this re-heating must await the virialization of the group. Therefore, the gas that one expects to observe in X rays within loose groups will be associated with the dense substructures within these groups, i.e., galaxies and interacting binaries (which are expected in chance alignments, Mamon 1992), and with gas ejected by supernovae near interacting galaxies (e.g., Read & Ponman 1998; Henriksen & Cousineau 1999).
The X-ray properties of chance alignments within cosmological filaments depend strongly on the dynamical and thermal state of the cosmological filament. Such filaments appear clearly in cosmological simulations. For example, the hydrodynamical simulations of Cen & Ostriker (1999) show that most of the intergalactic gas is not only at temperatures of , but also within filamentary structures. Cen & Ostriker argue that this gas was shock-heated mainly by structure collapse and possibly also by supernovae.
It presents a major challenge to detect gas, either within filaments of loose groups, at temperatures well below , since the gas in these systems should be too tenuous to be an efficient emitter or an efficient absorber. Moreover, its typical temperature is too cool to observe in X-rays, and its detection is difficult in the EUV because of contamination from emission from the galactic corona and strong absorption from galactic HI. Hence, one does not expect to detect widespread diffuse X-ray emission in compact groups caused by chance alignments within loose groups or cosmological filaments. Therefore, in these chance alignments scenarios, the diffuse X-rays detected in HCG 16 are associated with interacting pairs of galaxies, perhaps emitted by gas that was stripped by tidal interactions or ejected by galactic winds generated by supernova explosions.
Our revised X-ray luminosity for HCG 16 brings the group closer to the extrapolation of the cluster luminosity-temperature relation and to the the group relation of Mulchaey & Zabludoff (1998). Moreover, if there is a universal luminosity-temperature relation spanning the range from individual galaxies to binaries to real compact groups such as HCG 62 to rich clusters, then one expects that a chance alignment of equal luminosity systems along the line-of-sight will produce a group that will be located a factor in luminosity above this universal luminosity-temperature relation. This is consistent with the position of HCG 16 in the - diagram relative to the relation of Mulchaey & Zabludoff, but the X-ray luminosity of HCG 16 is 300 times too large for its low temperature in comparison with PBEB’s relation, and chance alignments cannot explain such a large luminosity excess.
In Paper II, we investigate in more detail the possibility that HCG 16 occurs as a chance alignment within a looser group or a cosmological filament .
5.3 Concluding remarks
Due to their low virial temperature (), groups of galaxies and their X-ray emission are of extreme importance in the study of processes affecting the baryonic diffuse content of systems of galaxies, such as reheating and early energy injection (Cavaliere et al. 1997, 1998; Balogh et al. 1999; Ponman et al. 1999). Earlier analyses of the ROSAT PSPC observation of Hickson Compact Groups (Saracco & Ciliegi 1995; Ponman et al. 1996) were based on counting photons in a circle surrounding the optical center of the group. The present detailed spatial analysis of X-ray emission in HCG 16 highlights the importance of a multi-wavelength study, in particular for rejecting point sources identified in the optical and radio wavebands. The clumpy nature of the hot gas in HCG 16 appears quite different from the more regular diffuse emission seen in other compact groups, and HCG 16 loses its previous characteristic of being the sole spiral-only compact group with hot gas tracing a fairly regular potential well (see Ponman et al. 1996; Mulchaey 1999). Our study raises nevertheless the question that other compact groups previously detected in X-rays may be significantly contaminated by superimposed X-ray (point or extended) sources.
Another question raised by this study is the inclusion of HCG 16 in the relation of groups and clusters. Indeed, this relation measures the trend between dark matter total mass and mean baryonic density in systems where the diffuse gas is in equilibrium within the dark matter potential. Since the diffuse hot gas of HCG 16 appears to lie in several () clumps, one would then expect that the group luminosity be a factor above the relation, for given temperature. If PBEB’s relation is correct, then the factor of 300 excess luminosity for its temperature in comparison with the extrapolation of the PBEB’s trend is too large to be consistent with the idea that most of the X-ray emission originates from a few clumps of hot gas in equilibrium within an underlying potential. Moreover, in the frame of theories explaining the relation in groups (Cavaliere et al. 1997, 1998; Balogh et al. 1999), gas cannot settle in hydrostatic equilibrium into a system with a virial temperature smaller than (see Sect. 5.2.1). These two arguments naturally lead to the conclusion that the diffuse gas observed in HCG 16 originates mostly from the galaxies, either through tidal stripping or in galactic winds driven by supernova explosions.
The launch of new X-ray satellites (Chandra) with its high spatial and spectral resolution and XMM with its greatly enhanced sensitivity and spectral resolution will eventually allow to answer these questions. The precise nature of the diffuse emission seen in HCG 16 is still difficult to constrain, because of the low signal-to-noise of the ROSAT/PSPC observations. We expect to pursue our study of HCG 16 using archival ASCA data, as well as a Chandra observation, which we have obtained on this compact group.
Acknowledgements.
This research constitutes part of the PhD thesis of S.D.S. We acknowledge useful discussions with Joel Bregman, Malcolm Bremer, Florence Durret, Daniel Gerbal, Mark Henriksen, Stéphane Leon, Gastão Lima Neto, Claudia Mendes de Oliveira, Vincent Pislar, and Trevor Ponman. We are most grateful to Trevor Ponman for his excellent refereeing, which led to substantial improvement of our work. Thanks also to Michel Fioc for providing us digital output from his PEGASE spectro-photometric evolution model, Gastão Lima Neto for use of his graphics package, Eric Slezak for his TRANSWAVE à trous wavelet package, and Barbara Williams for sending us her VLA 21cm maps and mass estimates in advance of publication. This research was supported in part by a grant from the French GdR Cosmologie (awarded to G.A.M.). We have made use of the NASA/IPAC Extragalactic Database (NED) which is operated by the Jet Propulsion Laboratory, California Institute of Technology, under contract with the National Aeronautics and Space Administration, the SIMBAD database operated by the Centre de Données Stellaires in Strasbourg, France, the ROE/NRL COSMOS UKST Southern Sky Object Catalog, the NRAO VLA Sky Survey (NVSS) and NASA’s Astrophysics Data System (ADS) Abstract Service.References
- Arnaud & Rothenflug (1985) Arnaud, M., Rothenflug, R., 1985, A&AS 60, 425
- Bahcall & Tremaine (1981) Bahcall, J.N., Tremaine, S., 1981, ApJ 244, 805
- Bahcall et al. (1984) Bahcall, N.A., Harris, D.E., Rood, H.J., 1984, ApJ 284, L29
- Balogh et al. (1999) Balogh, M., Babul, A., Patton, D., 1999, MNRAS in press, astro-ph/9809159
- Balucinska-Church & McCammon (1992) Balucinska-Church, M., McCammon, D., 1992, ApJ 400, 699
- Barnes (1985) Barnes, J., 1985, MNRAS 215, 517
- Barnes (1989) Barnes, J.E., 1989, Nature 338, 123
- Bode et al. (1994) Bode, P.W., Berrington, R.C., Cohn, H.N., Lugger, P.M., 1994, ApJ 433, 479
- Carnevali et al. (1981) Carnevali, P., Cavaliere, A., Santangelo, P., 1981, ApJ 249, 449
- Cavaliere et al. (1997) Cavaliere, A., Menci, N., Tozzi, P., 1997, ApJ 484, L21
- Cavaliere et al. (1998) Cavaliere, A., Menci, N., Tozzi, P., 1998, ApJ 501, 493
- Cen & Ostriker (1999) Cen, R., Ostriker, J.P., 1999, ApJ 514, 1
- Condon et al. (1998) Condon, J.J., Cotton, W.D., Greisen, E.W., Yin, Q.F., Perley, R.A., Taylor, G.B., Broderick, J.J., 1998, AJ 115, 1693
- de Carvalho et al. (1994) de Carvalho, R.R., Ribeiro, A.L.B., Zepf, S.E., 1994, ApJS 93, 47
- Diaferio et al. (1994) Diaferio, A., Geller, M.J., Ramella, M., 1994, AJ 107, 868
- Diaferio et al. (1993) Diaferio, A., Ramella, M., Geller, M.J., Ferrari, A., 1993, AJ 105, 2035
- Ebeling et al. (1994) Ebeling, H., Voges, W., Böhringer, H., 1994, ApJ 436, 44
- Fioc & Rocca-Volmerange (1997) Fioc, M., Rocca-Volmerange, B., 1997, A&A 326, 950
- Governato et al. (1996) Governato, F., Tozzi, P., Cavaliere, A., 1996, ApJ 458, 18
- Heisler et al. (1985) Heisler, J., Tremaine, S., Bahcall, J.N., 1985, ApJ 298, 8
- Henriksen & Cousineau (1999) Henriksen, M., Cousineau, S., 1999, ApJ 511, 595
- Hernquist et al. (1995) Hernquist, L., Katz, N., Weinberg, D.H., 1995, ApJ 442, 57
- Hickson (1982) Hickson, P., 1982, ApJ 255, 382
- Hickson (1997) Hickson, P., 1997, ARA&A 35, 357
- Hickson et al. (1989) Hickson, P., Kindl, E., Auman, J.R., 1989, ApJS 70, 687
- Hickson et al. (1992) Hickson, P., Mendes de Oliveira, C., Huchra, J.P., Palumbo, G.G., 1992, ApJ 399, 353
- Leon et al. (1998) Leon, S., Combes, F., Menon, T.K., 1998, A&A 330, 37
- Liedahl et al. (1995) Liedahl, D.A., Osterheld, A.L., Goldstein, W.H., 1995, ApJ 438, L115
- Mamon (1986) Mamon, G.A., 1986, ApJ 307, 426
- Mamon (1987) Mamon, G.A., 1987, ApJ 321, 622
- Mamon (1992) Mamon, G.A., 1992, in: Mamon, G.A., Gerbal, D. (eds.), 2nd DAEC mtg., Distribution of Matter in the Universe, Obs. de Paris, Paris, p. 51
- Mamon (1993) Mamon, G.A., 1993, in: Combes, F., Athanassoula, E. (eds.), Gravitational Dynamics and the N-Body Problem, Obs. de Paris, Paris, p. 188, astro-ph/9308032
- Mamon (1994) Mamon, G.A., 1994, in: Durret, F., Mazure, A., White, S.D.M., Trânh Thanh Vân, J. (eds.), 14th Moriond Astrophysics Mtg., Clusters of Galaxies, Frontières, Gif-sur-Yvette, p. 291, astro-ph/9511101
- Mamon (1995) Mamon, G.A., 1995, in: de Vega, H., Sánchez, N. (eds.), 3rd Paris cosmology colloq., p. 95, astro-ph/9511101
- Mamon & Dos Santos (1999) Mamon, G.A., Dos Santos, S., 1999, A&A to be submitted (Paper II)
- Mewe et al. (1985) Mewe, R., Gronenschild, E.H.B.M., Van Den Oord, G.H.J., 1985, A&AS 62, 197
- Mewe et al. (1986) Mewe, R., Lemen, J.R., Van Den Oord, G.H.J., 1986, A&AS 65, 511
- Motch et al. (1998) Motch, C., Guillout, P., Haberl, F., Krautter, J., Pakull, M.W., Pietsch, W., Reinsch, K., Voges, W., Zickgraf, F.J., 1998, A&AS 132, 341
- Mulchaey (1999) Mulchaey, J.S., 1999, in: Valtonen, M.J., Flynn, C. (eds.), IAU Coll. No. 174, Small Galaxy Groups, ASP, San Francisco, in press
- Mulchaey et al. (1996) Mulchaey, J.S., Davis, D.S., Mushotzky, R.F., Burstein, D., 1996, ApJ 456, 80
- Mulchaey & Zabludoff (1998) Mulchaey, J.S., Zabludoff, A.I., 1998, ApJ 496, 73
- Pildis et al. (1995) Pildis, R.A., Bregman, J.N., Evrard, A.E., 1995, ApJ 443, 514
- Ponman & Bertram (1993) Ponman, T.J., Bertram, D., 1993, Nature 363, 51
- Ponman et al. (1996) Ponman, T.J., Bourner, P.D.J., Ebeling, H., Böhringer, H., 1996, MNRAS 283, 690 (PBEB)
- Ponman et al. (1999) Ponman, T.J., Cannon, D.B., Navarro, J.F., 1999, Nature 397, 135
- Rana & Basu (1992) Rana, N.C., Basu, S., 1992, A&A 265, 499
- Read & Ponman (1998) Read, A.M., Ponman, T.J., 1998, MNRAS 297, 143
- Ribeiro et al. (1996) Ribeiro, A.L.B., de Carvalho, R.R., Coziol, R., Capelato, H.V., Zepf, S.E., 1996, ApJ 463, L5 (RdC3Z)
- Rose (1977) Rose, J.A., 1977, ApJ 211, 311
- Saracco & Ciliegi (1995) Saracco, P., Ciliegi, P., 1995, A&A 301, 348
- Shensa (1992) Shensa, M.J., 1992, Proceedings IEEE 40, 2464
- Slezak et al. (1990) Slezak, E., Bijaoui, A., Mars, G., 1990, A&A 227, 301
- Slezak et al. (1993) Slezak, E., de Lapparent, V., Bijaoui, A., 1993, ApJ 409, 517
- Snowden et al. (1994) Snowden, S.L., McCammon, D., Burrows, D.N., Mendehall, J.A., 1994, ApJ 424, 714
- Starck & Murtagh (1994) Starck, J.L., Murtagh, F., 1994, A&A 288, 342
- Starck & Pierre (1998) Starck, J.L., Pierre, M., 1998, A&AS 128, 397
- Stark et al. (1992) Stark, A.A., Gammie, C.F., Wilson, R.W., Bally, J., Linke, R.A., Heiles, C., Hurwitz, M., 1992, ApJS 79, 77
- Tully & Fisher (1977) Tully, R.B., Fisher, J.R., 1977, A&A 54, 661
- Valtonen & Byrd (1986) Valtonen, M.J., Byrd, G.G., 1986, ApJ 303, 523
- Verdes-Montenegro (1999) Verdes-Montenegro, L., 1999, in: Valtonen, M.J., Flynn, C.(eds.), IAU Coll. No. 174, Small Galaxy Groups, ASP, San Francisco, in press
- Walke & Mamon (1989) Walke, D.G., Mamon, G.A., 1989, A&A 225, 291
- Williams (1998) Williams, B.A., 1998, private communication