H from HVCs
Abstract
Optical emission lines provide an important new window on the HVCs. Recent studies of the H line reveal that ionized hydrogen is pervasively associated with the neutral hydrogen in HVCs. The Wisconsin H Mapper (WHAM) instrument has so far detected H from high-velocity clouds in the M, A, and C complexes. We find a close spatial correspondence between the neutral and ionized portions of the HVCs with some evidence that the ionized gas envelopes the neutral part of the clouds. The velocities of the H and 21-cm detections are well correlated, but the intensities are not. If the clouds are photoionized, the H intensity is a direct measure of the Lyman continuum flux in the Galactic halo. Forthcoming observations of the H line in combination with other emission lines will give new insights into the high-velocity cloud phenomena and will also probe the physical conditions of their environment.
Department of Astronomy, University of Wisconsin – Madison, 475 N. Charter St., Madison, WI 53706
1. Introduction
The study of H and other optical emission lines from HVCs, just now becoming technologically viable, holds great promise for broadening our understanding of both HVCs and their environments. The H line gives information about the ionized hydrogen associated with the HVC, specifically, the emission measure, and the spatial and kinematic relationship to the neutral gas, already well studied through the 21-cm line. If the H emitting regions are photoionized, then the H intensity is a direct measure of the Lyman continuum flux incident upon the cloud. A knowledge of how this flux varies with distance above the Galactic plane and with Galactocentric radius can have an important bearing on more general questions regarding ionized gas in the disk and halo of the Milky Way. If, on the other hand, the ionizations producing the H photons are due to collisional processes induced by the rapid motion of the HVCs (i.e., shocks), then the intensity is a measure of the ambient density through which the cloud is moving. The extent of the low density Galactic halo has important implications for considerations of dark matter in the Galaxy as well as for properly interpreting QSO absorption line measurements (e.g., Sembach et al. 1995). Measurements of other emission lines such as [O III] 5007, [S II] 6716, and [N II] 6584 should distinguish between these two ionization mechanisms. In the near future, it will be possible to map entire HVC complexes in H, allowing detailed comparisons of the distribution of neutral and ionized gas in the clouds, as well as providing the opportunity to look for clues that connect HVCs to features in the ISM at lower velocities.
The extreme faintness of the H emission from HVCs made it nearly impossible to study in the past. Reynolds (1987) searched for H in six directions and could only place upper limits ranging from 0.2 R to 0.6 R. One Rayleigh (R) is 106 / 4 photons cm-2 s-1 sr-1 or 2.41 10-7 ergs cm-2 s-1 sr-1 at H. Kutyrev and Reynolds (1989) successfully detected H (Iα = 0.08 0.02 R) from a very high velocity cloud (vlsr = -300 km s-1) in Cetus. Münch & Pitz (1989) detected an intensity Iα = 0.15 R toward the M II cloud, a high velocity cloud in the M complex. Songaila et al. (1989) claimed a detection of H from complex C at the 0.03 R level; however, Tufte et al. (1998) have observed the same direction and report a significantly higher intensity (see below). In general, these observations involved long integration times and produced null or marginal results.
The advent of CCD detectors with both high quantum efficiency and extremely low dark noise has dramatically improved the prospects for optical emission line studies of HVCs. Coupling these detectors to Fabry-Perot based spectrometers has made such optical observations a viable and promising field of study. Consider for example, the recent Weiner & Williams (1996) study of H emission towards the Magellanic Stream using the Rutgers Imaging Fabry-Perot system coupled to the 1.5 m CTIO telescope. They detected H emission towards 5 out of their 7 observation directions and found that the H “bright” spots ( 0.2 – 0.4 R) appear to be correlated with H I cloud edges. Weiner & Williams argue that the H arises from gas ionized by ram pressure heating by low density (nH 10-4) gas in the Galactic halo, but this conclusion is a matter of controversy (see Bland-Hawthorn & Maloney 1998).
2. WHAM Observations of H from HVCs
The Wisconsin H-Alpha Mapper (WHAM) is a unique new instrument for the detection and study of faint optical emission lines from diffuse ionized gas in the disk and halo of the Galaxy (Reynolds et al. 1998; Tufte 1997). Its characteristics make it very well suited to the study of emission lines from HVCs and have led to the detection of optical line emission from a number of HVCs (Tufte 1997; Tufte et al. 1998).
WHAM consists of a 15 cm aperture, dual-etalon Fabry-Perot spectrometer, which provides much higher throughput at a given spectral resolution than grating spectrometers. The high spectral resolution (12 km s-1 FWHM) is well matched to the 20–25 km s-1 line widths (21-cm) typical of HVCs and makes possible studies of the kinematics of the emitting gas. The spectrometer is coupled to a dedicated 0.6 m telescope that produces a 1o diameter beam on the sky, well matched to the angular sizes of HVCs. The large etalons combined with a high efficiency CCD detector provides unsurpassed sensitivity, which results in clear (10) detections of emissions with an intensity of 0.1 R, typical of the H from HVCs (see below), in 30 minutes integration time. Finally, WHAM is tunable to any wavelength between 4800 and 7200 , and therefore can be used to study a variety of lines from HVCs.
2.1. H from the M Complex
The WHAM H observation directions for the M complex region are shown in Figure 1 superposed on 21-cm contours from the Leiden/Dwingeloo survey (Hartmann & Burton 1997). The 21-cm contours indicate the distribution of neutral hydrogen at high velocity (vlsr -80 km s-1).
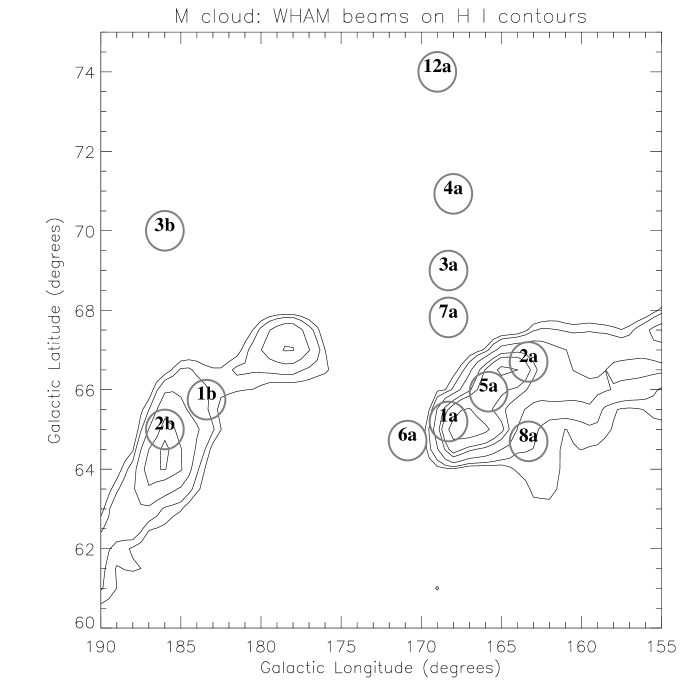
Figure 2 shows two of the WHAM H spectra toward the M complex, formed by subtracting the spectrum of a nearby “off” direction, free from high velocity gas in the 21-cm maps, from a spectrum taken “on” the direction of interest. This very powerful technique eliminates night sky features and other systematic uncertainties that would otherwise obscure the very weak emission from the HVC and isolates the H emission associated with the HVC. The left spectrum is toward = 168.3o, = 65.2o (direction 1a in Fig. 1), which is centered on the peak of the 21-cm contours defining the M I cloud. An emission line is clearly detected at a velocity with respect to the local standard of rest vlsr = km s-1. A best fit gaussian to this spectrum (solid curve) implies an intensity of 0.078 R and a width (FWHM) of 27 km s-1 for this emission line. The arrow in the figure denotes the velocity of the 21-cm emission line associated with the neutral hydrogen. The velocities of the emission from the neutral and ionized gas agree to within the measurement uncertainties.


The right spectrum in Figure 2 was taken toward the nearby direction = 170.85o, = 64.72o (direction 6a in Fig. 1). Once again an emission line is clearly detected. The fit implies an H intensity of 0.20 R at a velocity of vlsr = km s-1. This direction is just off the M I cloud 21-cm enhancement in a location where the H I column density is less than 1/10th that in the first direction (1a). Nevertheless, the H emission is approximately twice that in the first direction. This implies that there is not a one-to-one correspondence between 21-cm and H emission in this HVC, and that in some parts of the cloud ionized gas dominates. The implications of this result will be considered further in Section 3..
2.2. H from the A and C Complexes
H spectra for the A Complex are shown in Figure 3. Notice that the spectrometer was “tuned” to cover a higher negative velocity interval than for the M complex observations. This is accomplished by decreasing the optical path length in the Fabry-Perot etalon gaps by changing the gas pressure in the etalon chambers. The spectra show clear detections of H emission from both the A III and A IV clouds at velocities (LSR) of -167 1 km s-1 and -178 1 km s-1, respectively. The arrows show the velocity of the 21-cm line in the Leiden/Dwingeloo survey data. The H intensities derived from the fits are Iα = 0.08 0.01 R, and 0.09 0.01 R, for the A III and A IV clouds, respectively.


Figure 4 shows the H difference spectrum for the C complex direction ( = 84.3o, = +43.7o). While the baseline is not well determined, particularly on the red side of the spectrum (see Section 2.3. below), an H emission component is clearly detected at a velocity matching that of the 21-cm component. The intensity of this component is Iα = 0.13 0.03 R, and the velocity is vlsr = -111 2 km s-1. This higher signal-to-noise observation is inconsistent with the results of Songaila, Bryant, & Cowie (1989), who observed this same direction (see Position 1 in their Fig. 1a) and reported detecting H at an intensity of 0.03 R with an estimated uncertainty of 50%. Table 1 summarizes the WHAM results for the M, A, and C complexes.

| H | 21-cm | ||||
| Name | IHα | VHα | I21cm | V21cm | |
| (R) | (km s-1) | (1020 cm-6 pc) | (km s-1) | ||
| M I cloud | |||||
| 1a-4a | 0.08 0.01 | -106 1 | 1.22 | -113 | |
| 2a-4a | 0.20 0.02 | -95 1 | 1.17 | -101 | |
| 5a-4a | 0.06 0.02 | -103 3 | 1.04 | -116 | |
| 6a-12a | 0.18 0.02 | -105 1 | — | — | |
| 8a-4a | 0.11 0.02 | -92 2 | 0.35 | -112 | |
| M II cloud | |||||
| 1b-4a | 0.12 0.01 | -61 2 | 1.33 | -72 | |
| 2b-4a | 0.16 0.03 | -78 2 | 1.50 | -80 | |
| A cloud | |||||
| A III | 0.08 0.01 | -167 1 | 1.40 | -153 | |
| A IV | 0.09 0.01 | -178 1 | 1.34 | -177 | |
| C cloud | |||||
| C | 0.13 0.03 | -111 2 | 0.54 | -120 | |
2.3. Subtracting the Lockman Window Spectrum
To measure accurately faint H emission from high velocity clouds, it would be a great benefit to locate a direction in the sky where the Galactic H emission was zero at all velocities. Using this as the “off” direction would allow one to subtract the sky spectrum and correct for other systematic uncertainties without introducing the uncertainty caused by an unknown quantity of Galactic emission from the “off” direction. The Lockman Window (LW) direction ( = 150.48o, = 52.96o) appears to be a good approximation to this ideal. This direction has a famously low H I column density (NHI = 4.4 0.5 1019 cm-2; Jahoda, Lockman, & McCammon 1990) and as a result is often used by X-ray astronomers and others interested in looking at sources unobscured by the affects of neutral hydrogen and the associated dust. An important question is whether the Lockman Window is similarly devoid of emission from ionized hydrogen. Because of baseline uncertainties in the WHAM spectra, we cannot claim that there is zero H emission from the Lockman Window direction; however, it appears to be fainter in H than any other direction we have observed. There is no evidence for H emission from the Lockman Window except for a possible very weak ( 0.02 R) high velocity component at vlsr -130 km s-1. We will eventually be able either to detect H or put very low upper limits on its intensity by using the shifts in velocity caused by the earth’s orbital motion to distinguish between any actual emission and baseline irregularities. The use of the Lockman Window as an “off” direction therefore provides the best indication of the amount of H from both the high and the intermediate velocity gas from the other directions, without the biases caused by emission from an “off” direction containing emission at lower (intermediate) velocities. This lower velocity emission in other “off” directions produces distortions in the baseline of the resulting “on – off” spectrum on the red side of the HVC emission component (e.g., Fig 4).


Figure 5 shows the 1a - LW difference spectrum. In this case, the emission component from the high velocity gas in the M I cloud is clearly revealed, just as it is revealed by the 1a – 4a difference spectrum in Figure 2. However, in addition to the HVC emission, H is also seen at lower negative velocities, identified with the intermediate velocity (-50 km s-1) H I in this direction. There is perhaps also significant emission at even lower velocities near the LSR, but this is less certain because uncertainties associated with the subtraction of the geocoronal H line dominate at velocities more positive than -50 km s-1 (Tufte 1997). Figure 5 also shows the 4a - LW spectrum. The intermediate velocity emission from this direction is very similar to that seen in 1a, and this explains why the baseline is so well behaved in the 1a–4a spectrum. Differences in the amount of emission from intermediate velocity gas between “on” and “off” HVC directions are likely responsible for the baseline irregularities in Fig 4.
3. The Relationship Between H and 21-cm Emission
Since the H intensity traces ionized hydrogen and the 21-cm intensity traces neutral hydrogen, it is natural to wonder how these two observables are related to each other. For the WHAM observation directions, we find that in every direction with significant high velocity 21-cm emission (nine), an associated H component was detected. Also, except for one observation direction (6a on Fig. 1), which is just off the edge of the M I cloud, there is no clear evidence of H in any of the directions without appreciable 21-cm emission. This close correspondence, however, does not imply that the intensities are well correlated, as is demonstrated in the left panel of Figure 6, which shows no clear correlation between the H and 21-cm intensities for the M complex. The radial velocities, on the other hand, do show a close correlation, as can be seen in the right panel of Figure 6 where the H velocities are plotted versus the 21-cm velocities for the M, A, and C complexes (each complex is plotted with a different symbol). This correlation is strong evidence that the H emission is associated with the high velocity neutral hydrogen.


There is some indication that the ionized gas envelopes the neutral gas. Direction 6a (see Fig. 1) at the edge of the M I cloud is brighter than direction 1a, which is on the M I cloud where the 21-cm is significantly brighter. The faintness of the H in direction 7a, however, argues that the H II envelope, if present, is not very thick. Weiner & Williams (1996) also find an edge brightening effect in their Magellanic Stream data. Of their seven observation directions, the three that are brightest in H are on the edge of H I clouds. They further claim that the association is with “leading” edges as defined by the inferred motion direction of the gas; however, the evidence for this is not strong as there is only one direction that could be called a “trailing” edge, and this direction has an intermediate H brightness. It will be important in future observations to distinguish between edge brightening and leading edge brightening, since edge brightening is naturally explained in a photoionization scenario, whereas leading edge brightening is more naturally explained by a collisional process.
The HVCs presented here are at high Galactic latitude, and therefore interstellar extinction can probably be ignored. In this case, the H intensity is directly related to the emission measure (EM ) through the cloud and gives information on the column density and electron density of the ionized hydrogen. Consider the 21-cm enhancement in the M I cloud centered near direction 1a in Figure 1, as an example. It has an H I column density NHI 1.2 1020 cm-2 and a diameter of about 1.5o, corresponding to 50 pc at a distance of 2 kpc and indicating a density of neutral hydrogen n 1.0 cm-3 and a mass of about 1600 M⊙ for the cloud. The measured H intensity Iα = 0.08 R implies an emission measure EM = 0.18 cm-6 pc, assuming a temperature for the H II of 8000 K. This leads to an electron density n 0.06 f-1/2 cm-3 and a column density of ionized hydrogen N f1/2 cm-2, where f is the filling fraction of the H II along the line-of-sight through the cloud. Since f 1 and there is little evidence that the H II associated with the cloud extends significantly beyond the H I portion of the cloud, it appears that toward direction 1a the HVC is primarily neutral with NHII / NHI 0.08. On the other hand, if we consider direction 6a, which intersects the edge of the cloud (see Fig. 1), the H I column density is less than 2 1019 cm-2, whereas the Hα is twice the intensity of 1a. This indicates that there may be as much or more H II as H I along the line of sight at the edge of the H I enhancement. Both of these results appear to be consistent with most of the H II being located near the outer surface of the cloud rather than mixed with the H I.
4. Implications of the H Emission
An important question is the source of ionization for the HVCs. If the H emission arises from photoionization, then the intensity is directly related to the incident Lyman continuum flux FLC in the Galactic halo. Since the H I cloud is optically thick in the Lyman continuum and optically thin to H photons, each Lyman continuum photon incident on the cloud will ionize a hydrogen atom and each hydrogen recombination will produce on the average 0.46 H photons (Martin 1988; Pengally 1964; case B, T 104). This leads to the relation
If, on the other hand, the ionization is due to a shock arising from the interaction of the HVC with ambient gas in the Galactic halo, the H intensity Iα provides information about the density and temperature of the halo gas. If the ambient gas is sufficiently cool (T 106) for strong shocks to occur, then shock models by Raymond (1979) relate the face-on H surface brightness (Iα)⟂ to the halo gas density. Namely,
where no is the density of the preshocked gas. This power law is a fit to the predicted H intensities for shock velocities between 50 km s-1 and 140 km s-1 presented in Raymond (1979). For the A IV cloud, for example, where Vs 178 km s-1, and (Iα)⟂ 0.1 R, this would imply no 6 10-3 cm-3, which is an upper limit on no because a nonperpendicular sightline will increase the observed Iα for a given no and Vs.
The fact that the observed intensities are all around 0.1 R (Table 1) may be more easily explained in a photoionization scenario because the various clouds could all be bathed in the same ionizing flux (see Bland-Hawthorn & Maloney 1998) independent of their velocity. It is more difficult to explain the uniformity of the H intensities in a shock excitation scenario, since in that case the expected H intensity varies strongly with both the shock velocity and the ambient density. Another weak piece of evidence for photoionization comes from the fairly narrow, albeit poorly measured, H line widths, which are similar to the widths observed in photoionized H II regions surrounding O stars (Reynolds 1988). A more careful map of Iα around the edge of the clouds could perhaps distinguish between the two ionization mechanisms. The source of ionization could also be explored through measurements of various emission line ratios. With an ambient density no = 1 cm-3 and a shock velocity Vs = 100 km s-1, some of the line ratios predicted by Raymond (1979) are [S II] 6716 / H = 0.18, [N II] 6584+ / H = 0.51, and [O III] 5007+4959 / H = 1.9. If this model, when extended to lower densities, retains the prediction of very bright [O III] emission, then the 5007 line could be an important discriminator between shock ionization and photoionization. Such emission lines could also give further information on the metal abundances in the HVCs, which have been previously investigated by Lu et al. 1994 and Lu et al. 1998, for example, through absorption line techniques (also see Wakker et al., this proceedings).
If indeed the detected H emission results from photoionized gas, then such measurements can shed light on more general questions concerning the gaseous Galactic halo and its connection to processes occurring in the disk. It has frequently been proposed, for example, that the source of the ionization in the extended warm ionized component of the interstellar medium (the WIM) is O stars in the plane of the Galaxy (e.g., Domgörgen & Mathis 1994), although other, more exotic sources have also been proposed (e.g., Melott et al. 1988; Sciama 1990). However, for the O star idea to work, very special arrangements of the H I gas must exist to allow photons to travel from the Galactic plane, where the vast majority of O stars are located, to gas high above the plane in the thick WIM layer (for specific models that have been constructed to explore this scenario in detail, see Miller & Cox 1993 and Dove & Shull 1994). If the H I gas is arranged to be porous to Lyman Continuum photons, then a significant fraction of the photons should leak out of the disk and into the halo. The H intensity towards H I clouds in the Galactic halo constrains the degree to which this is occurring, and in particular, the H intensity towards H I clouds at various distances from the Galactic plane can reveal the Lyman continuum flux as a function of height above the plane. This idea and its implications have been explored from a theoretical stand point by Bland-Hawthorn & Maloney (1998). The H intensities measured for the HVCs are about a factor of 10 lower than typical H intensities from WIM gas at high Galactic latitudes (e.g., Reynolds et al. 1995; Haffner et al. 1998), implying that if the ionizing photons originate near the Galactic midplane, 90% of the photons reaching the WIM are absorbed before reaching the even greater heights of the HVCs in the Galactic halo. Note that the measured H intensities for the HVCs are an order of magnitude (or more) above that expected from the metagalactic ionizing flux (Ferrera & Field 1994).
In the near future, there should be much progress in this emerging area of study. Entire HVC complexes will be mapped in H, other diagnostic lines will be measured revealing information about the source of ionization, and comparative studies between H, 21-cm, X-ray, and absorption line measurements will provide clues about the relationship between the various gas phases in the Galactic halo.
We thank N. R. Hausen for her valuable contributions. Observations with the WHAM facility have been supported by the National Science Foundation through grants AST 9619424 and AST 9122701.
References
Bland-Hawthorn, J. & Maloney, P. R. 1998, ApJ, in press
Domgörgen, H., & Mathis, J. S. 1994, ApJ, 428, 647
Dove, J. B., & Shull, J. M. 1994, ApJ, 430, 222
Ferrara, A., & Field, G. B. 1994, ApJ, 423, 665
Haffner, L. M., Reynolds, R. J., & Tufte, S. L. 1998, ApJ, 501, L83
Hartmann, D. & Burton, W. B. 1997, Atlas of Galactic Neutral Hydrogen, Cambridge University Press
Jahoda, K., Lockman, F. J., & McCammon, D. 1990, ApJ, 354, 184
Kutyrev, A. S., Reynolds, R. J., 1989, ApJ, 334, L9
Lu, L., Savage, B. D., & Sembach, K. R. 1994, ApJ, 426, 563
Lu. L., Savage, B. D., Sembach, K. R., Wakker, B. P., Sargent, W. L. W., & Oosterloo, T. A. 1998, ApJ, 115, 162
Martin, P. C. 1988, Ap. J. Suppl., 66, 125
Melott, A. W., McKay, D. W., & Ralston, J. P. 1988, ApJ, 324, L43
Miller, W. W. III, & Cox, D. P. 1993, ApJ, 417, 579
Münch, G., Pitz, E., 1989, H-emission in directions toward high-velocity 21-cm clouds, in Tenorio-Tagle, G., Moles, M., Melnich, J. (eds.), Structure and Dynamics of the Interstellar Medium, Proc. IAU Coll. 120, Springer-Verlag, Berlin, Heidelberg, New York, Lecture Notes in Physics, Vol. 350, p. 373
Pengally, R. M. 1964, M.N.R.A.S., 127, 145
Raymond, J. C. 1979, Ap. J. Suppl., 39, 1
Reynolds, R. J. 1987, ApJ, 323, 553
Reynolds, R. J. 1988, ApJ, 333, 341
Reynolds, R. J., Tufte, S. L., Kung, D. T., McCullough, P. R., & Heiles, C. 1995, ApJ, 448, 715
Reynolds, R. J., Tufte, S. L., Haffner, L. M., Jaehnig, K., & Percival, J. W. 1998, Pub. Australian Ast. Soc., in press.
Sciama, D. W. 1990, ApJ, 364, 549
Songaila, A., Bryant, W., & Cowie, L. L., 1989, ApJ, 345, L71
Tufte, S. L. 1997, PhD Thesis, University of Wisconsin–Madison.
Tufte, S. L., Reynolds, R. J., & Haffner, L. M. 1998, ApJ, 504, 773
Wakker, B. P., Howk, J. C., Savage, B. D., Tufte, S. L., Reynolds, R. J., van Woerden, H., Schwarz, U. J., & Peletier, R. F., 1998, this proceedings
Weiner, B. J., & Williams, T. B., 1996, AJ, 111, 1156