On the radio-to-X-ray light curves of SN 1998bw and GRB 980425
Abstract
We calculate radio-to-X-ray light curves for afterglows caused by non-thermal emission from a highly relativistic blast wave, which is inferred from the gamma-ray flux detected in GRB 980425 and from the very bright radio emission detected in SN 1998bw. We find that the observed gamma-ray and radio light curves are roughly reproduced by the synchrotron emission from a relativistic fireball. The optical flux predicted for the non-thermal emission is well below that of the thermal emission observed for SN 1998bw so that it will not be seen at least for a few years. The model predicts the X-ray flux just above the detection limit of it BeppoSAX for the epoch when it was pointed to the field of GRB980425. Therefore, the nondetection of X-ray and optical afterglows is consistent with the model. The models presented here are consistent with the physical association between SN 1998bw and GRB980425, and lend further support to the idea that this object might correspond to an event similar to the “hypernova” or “collapsar” – events in which the collapse of a massive star forms a rotating black hole surrounded by a disk of the remnant stellar mantle.
Subject headings:
gamma-rays:bursts – supernovae:general – supernove:individual(SN 1998bw)1. Introduction
The discovery of the peculiar supernova SN 1998bw in the error box of the -ray burst GRB 980425 raised the possibility that at least some classes of -ray bursts may originate from supernovae(Galama et al. 1998, Kulkarni et al. 1998). The optical properties of SN 1998bw suggest that it was an explosion of a massive star with a kinetic energy 10 times larger than usual supernovae (Iwamoto et al. 1998, Woosley, Eastman, & Schmidt 1998). The radio light curves of SN 1998bw indicate the existence of a relativistic blast wave associated with the supernova (Kulkarni et al. 1998). The -ray burst GRB 980425 was an unremarkable event in terms of spectral and temporal properties. The time of occurrence of the burst coincides with that of supernova to within (+0.7, -2.0) days, and the supernova was found in the 8’ error box of GRB 980425 determined by BeppoSAX. No further evidence has been established so far to support the physical association of these two events, however, the chance probability of finding a supernova in the error box is estimated to be relatively small, (Galama et al. 1998). Provided that GRB 980425 was really associated with SN 1998bw, the energy radiated in -rays turns out to be erg, assuming isotropic emission, which is 4 orders of magnitude smaller than in other bursts whose distances have been estimated so far(Galama et al. 1998).
The possible supernova connection of the -ray burst reminds us of “hypernova” (Paczyński 1998) or “collapsar” (Woosley et al.1998; MacFadyen & Woosley 1998) scenarios for -ray bursters, in which the collapse of a very massive star is involved. The scenario is that the collapse of the star results in the formation of a system composed of a Kerr black hole and a disc of the remnant stellar mantle. Then, a required amount of energy may be extracted from the system by either neutrino annihilation or megneto-hydrodynamic effect, i.e., the Blandford-Znajek mechanism(Blandford & Znajek 1977), eventually producing a relativistic jet and a bulk mass ejection. In these scenarios, the high energy photons from the jet may be observed as a -ray burst and the bulk mass with a slower expansion speed would be seen as a supernova-like object like SN 1998bw. Therefore, SN 1998bw and GRB980425 provide a good opportunity to test this class of models for gamma-ray bursters. In this Letter, we combine the observational data in different wavelength bands and try to see if they can be consistent with the hypernova or collapsar scenarios. We briefly give a description of a fireball model that we apply in §2. Then we compare the model prediction with the data in §3 and discuss possible interpretations and their implications in §4. Concluding remarks will be given in §5.
2. Blast wave model
We apply a simple fireball model for the blast wave dynamics, as in Mészáros & Rees(1997) and Wijers, Rees, & Mészáros(1997). The blast wave with an initially large Lorentz factor decelerates as it sweeps up external matter, giving rise to non-thermal emissions at a decreasing characteristic frequency. The synchrotron radiation from electrons accelerated near the shock front is one of the most viable emission mechanisms, unless the density is too low and the energy transfer from protons to electrons does not occur sufficiently quickly. The purpose of this Letter is not to give a unique and comprehensive model but to check the consistency of the physical association of GRB980425 and SN 1998bw. Therefore, we try a simple fireball model similar to those applied to GRB970228 in Wijers et al.(1997).
Recently, Rees & Mészáros(1998) suggested the possibility that the slower parts of ejecta would catch up with the decelerated blast wave and may reenergize it. The energy could be supplied to the blast wave during its propagation, resulting in afterglows that could be even more powerful than the -ray burst itself. In our analysis, we also assume a power-law evolution so that as in Rees & Mészáros(1998), which is realized in self-similar solutions(Blandford & McKee 1976). Since the blast wave radius is related to the observer time by , the radius and the Lorentz factor are given by
| (1) |
The comoving frame synchrotron intensity is given by for and for , where is the break frequency and , , and is the index of the energy spectrum of nonthermal electrons . The typical Lorentz factor of electrons is given by so that . The equipartition between magnetic field and internal energies, , yields . (Primes indicate values evaluated in the comoving frame.) The observed flux at the break frequency is given by . The comoving intensity at the break frequency is given by .
Therefore, the observed break frequency and the flux at the break frequency evolve as
| (2) |
and
| (3) |
respectively.
The index is determined by equating the ram pressures on the shocked region from the forward shock and from the reverse shock (Rees & Mészáros 1998). We assume, for simplicity, that the mass contained in the layers outside the shell with , , is given by
| (4) |
and a power-law density structure of external medium
| (5) |
The mass that has caught up with the contact discontinuity when the blast wave reaches radius is given by . Then we have and . In the latter, we assume the blast wave is adiabatic. From , we find the index to be
| (6) |
For a uniform distribution of external matter ( ) and a shell with a unique ( ), we have , which reproduces the result obtained in Wijers et al.(1997): const.
The monochromatic light curve is then given, if no beaming occurs, by
and
| (7) |
where is the time of the light curve break at frequency , which satisfies
| (8) |
as seen from equations (2) and (7).
3. Comparison with the Data
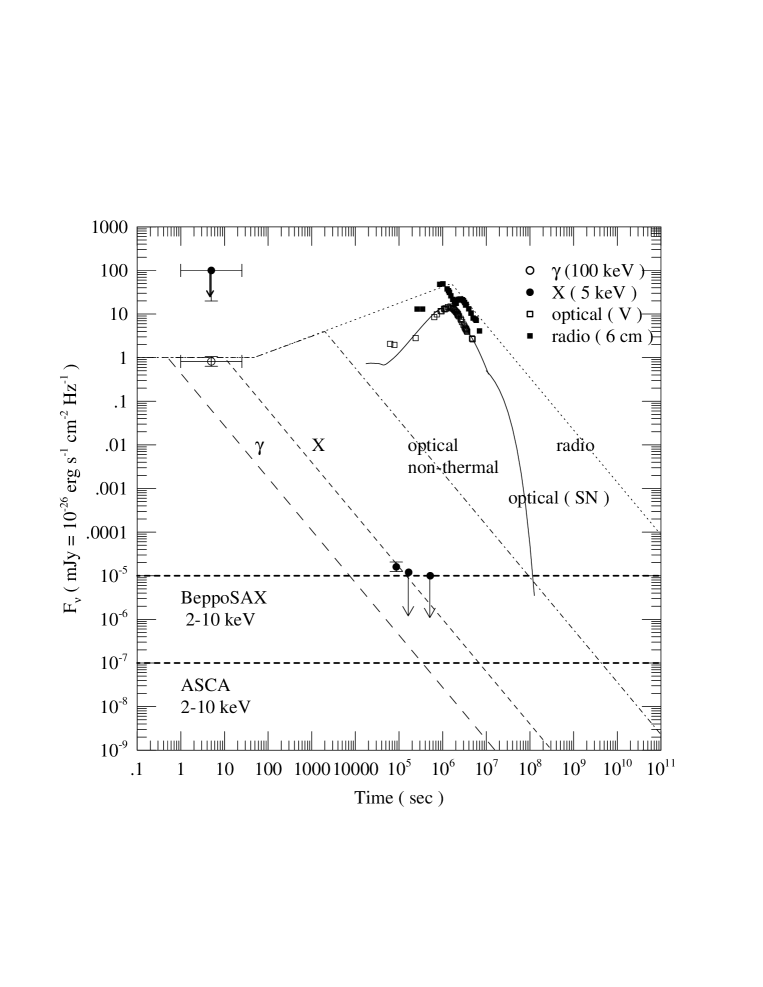
Table 1 lists the reports on the - and X-ray detections in the Wide-Field Camera(WFC) error box of GRB980425 (Pian et al. 1998a, 1998b). We converted these data to the fluxes in mJy ( erg s-1 cm-2 Hz-1) and plotted them in Figure 1 with open and filled circles, respectively. The observed optical light curve of SN 1998bw in visual band( Å) (Galama et al. 1998) and the radio radio light curve at 6 cm ( Kulkarni et al. 1998) are also plotted with open and filled squares, respectively. A theoretical light curve of model CO138 (Iwamoto et al. 1998) for SN 1998bw, which is the thermal emission from a subrelativistic ejecta heated by radioactivity, is shown with a solid line. Figure 1 also shows a set of afterglow light curves in X-rays( 5keV)(dashed line), optical(visual band, which is at approximately 5,500 Å; dash-dotted line), and radio (= 6 cm; dotted line). It is seen that the radio light curve agrees with the model prediction, although it shows a complicated behaviour before and around the peak.
The gap of the peak fluxes between -ray and radio bands requires that should increase as a function of time. The slope of is chosen to be 1/3 as shown in Figure 1, which requires , thus . In order for the X-ray flux to fall below the detection limit at s = 1 d, the X-ray light curve should decay faster than , which means if as seen from equation (7). We choose to draw the afterglow light curves in Figure 1. Owing to the unknown evolution of random magnetic field strength or due to the other emission processes involved such as self-absorptions and the inverse Compton scattering, the spectrum shape is uncertain and several breaks are even expected to appear in the spectrum(Piran 1997). Therefore, we simply assume as adopted in Wijers et al.(1997) for our analysis in this Letter.
From equation (8) with , one expects the time of the breaks at the X-ray, optical, and radio bands as , respectively. The flux of the optical afterglow is expected to be well below the observed optical flux of SN 1998bw; thus, it is no wonder that it has not been detected. The model predicts that the optical afterglow will not be seen at least for a few years, and then it will be below detection limits even with a largest scale of telescopes. In contrast, the radio flux is still at a level close to its peak, and monitoring the manner of its further decay is crucial to distinguish the nature of the blast wave. The X-ray flux detected by BeppoSAX at the time of the burst is significantly large compared with the -ray flux itself so that it seems hard to explain.
From the radio properties of SN 1998bw, Kulkarni et al. (1998) inferred that there exists a relativistic shock with at s that is responsible for the radio emission. Equation (1) predicts if we take ; thus, we can estimate the initial bulk Lorentz factor . The result is , where we set the time of the burst as s. Kulkarni et al. (1998) also gave an estimate of the mass of the relativistic shock . Then the initial energy of the blast wave is estimated to be less than erg.
4. discussion
Neither of the X-ray transient sources detected by Narrow-Field Instruments (NFI) on BeppoSAX coincides with SN 1998bw in their positions. One of them (1SAX J1935.0-5248) was reported to have a constant flux, but the other one (1SAX J1935.3-5252) has been fading(Pian et al. 1998a, 1998b). If the latter was indeed an afterglow of GRB 980425 and the burst occurred at the position, the fireball model predicts an optical afterglow and a subsequent radio afterglow with a detectable level of fluxes. Since the positions of the two X-ray sources were 3’ away from that of SN 1998bw, they would have been visible there. The lack of such optical and radio afterglows may also indicate that the sources had nothing to do with GRB 980425.
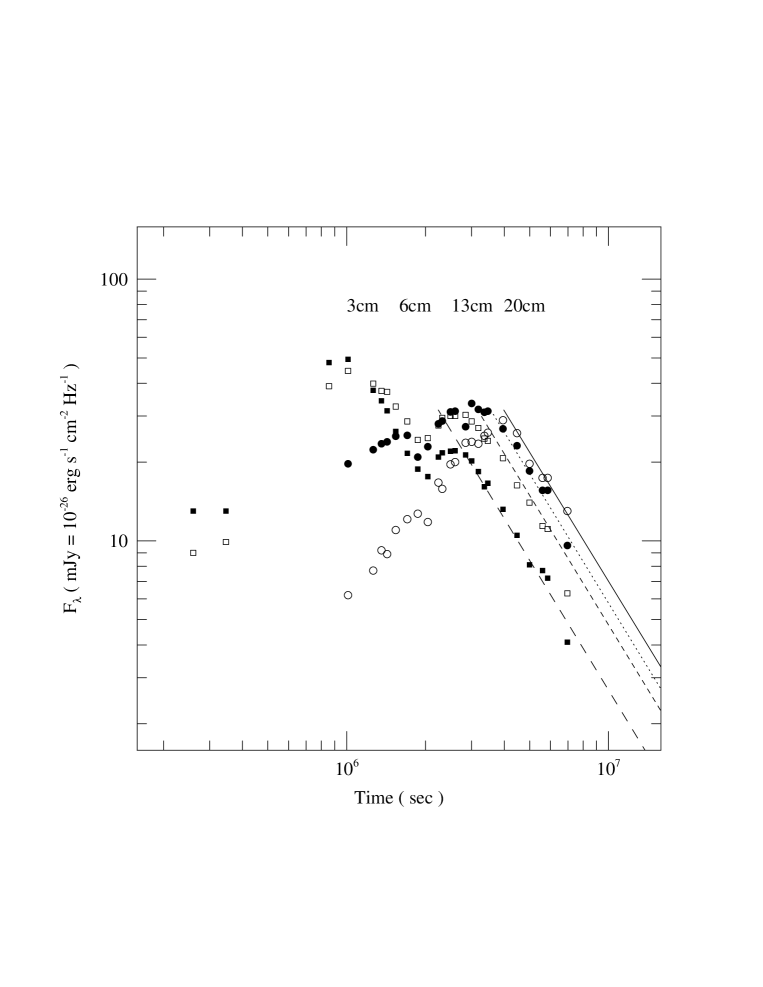
Kulkarni et al.(1998) reported the radio light curves in four different wavelength bands(Figure 2). If we closely look at the light curves, we see that they show complicated structures before and around their maximum epoch, but rather clean spectrum and temporal evolutions later. The irregularities seen in the early light curves may possibly be the result of inhomogeneity in external matter, absorption by dust in the host galaxy, and radiative processes other than synchrotron radiation. The light curves are well fitted by power-law decays with the same exponent, . On the other hand, the flux ratios between different wavelength bands give a spectral index , which is close to the values reported by Kulkarni et al.(1998). These requires , which does not agree with the value we chose to fit the light curves in Figure 1. Such a large value of leads to a negative , which may indeed suggest a density inhomogeneity in external matter, although it is necessary to do more detailed modeling of the radio light curves with a realistic treatment of hydrodynamics including other potentially important radiative processes(Nakamura et al. 1998).
5. Conclusions
We examined the optical and radio light curves of SN 1998bw and - and X-ray fluxes observed in GRB980425. Under the hypothesis that the two events are of the same origin, we compare the light curves that a simple fireball model predicts with these observations. As a result, we find the following interesting facts that favor the possibility that GRB 980425 was physically related to SN 1998bw.
1. The radio emission from SN 1998bw and the -rays (BATSE, BeppoSAX) from GRB980425 can be interpreted as a single event based on a simple fireball model, although the X-ray flux reported by BeppoSAX team is a bit too large and hard to be reconciled with a model as simple as the one adopted here.
2. The X-ray flux predicted by the model is only marginally detectable at the epochs BeppoSAX NFI was pointed to the field, which is consistent with the nondetection of any X-ray afterglow in GRB980425. The predicted X-ray flux falls below the detection limit of ASCA in months; therefore, it is not likely that we can detect decaying X-ray emissions from the burst by further observations.
3. Observations suggest that there seems to be a relativistic blast wave and a subrelativistic bulk mass ejection in SN 1998bw. The former might have caused the -ray emission from GRB980425 and the radio emission from SN 1998bw, while the latter corresponds to the optical emission from SN 1998bw. This picture is consistent with the hypernova or collapsar scenarios for -ray bursters, which involve the collapse of a massive star.
Although the arguments here are not strong enough to claim the physical association between SN 1998bw and GRB 980425, it is worth noticing that the relativistic shock required to explain the radio emission from SN 1998bw could be interpreted as a decelerated “fireball” that initially had a higher bulk Lorentz factor and was able to radiate -rays observed in GRB980425.
The author would like to thank Drs. Ken’ichi Nomoto, Elena Pian, Stan Woosley, Takayoshi Nakamura, Hideyuki Umeda, Toshio Murakami, and Timothy Young for useful discussion. He is also grateful to the anonymous referee for useful comments to improve the manuscript and the figures. This work has been supported in part by the grant-in-Aid for Scientific Research (05242102, 06233101) and COE research (07CE2002) of the Ministry of Education, Science, and Culture in Japan, and the fellowship of the Japan Society for the Promotion of Science for Junior Scientists(6728).
References
- Blandford & McKee (1976) Blandford, R.D., & McKee, C.F. 1976, Phys. of Fluids, 19, 1130
- Blandford & Znajek (1977) Blandford, R.D., & Znajek, R.L. 1977, MNRAS, 179, 433
- Galama et al. (1998) Galama, T.J., et al. 1998, Nature, 395, 670
- Iwamoto et al. (1998) Iwamoto, K., et al. 1998, Nature, 395, 672
- Kulkarni et al. (1998) Kulkarni, S.R., et al. 1998, Nature, 395, 663
- MacFadyen & Woosley. (1998) MacFadyen, A., & Woosley, S.E. 1998, ApJ submitted, University of California Observatories Preprint No.121
- Mészáros & Rees (1997) Mészáros, P., & Rees, M.J. 1997, ApJ, 476, 232
- Nakamura et al. (1998) Nakamura, T., Iwamoto, K., & Nomoto, K. 1998, in preparation
- Paczynski (1998) Paczyński, B. 1998, ApJ, 494, L45
-
Pian (1998)
Pian, E., et al. 1998a, GCN Circ. 61
(http://gcn.gsfc.nasa.gov/gcn/gcn3/061.gcn3) -
Pian (1998)
Pian, E., et al. 1998b, GCN Circ. 69
(http://gcn.gsfc.nasa.gov/gcn/gcn3/069.gcn3) - Piran (1997) Piran, T. 1997, in Some Unsolved Problems in Astrophysics (eds. Bahcall, J. N. & Ostriker, J.P.), 343
- Rees & Mészáros (1998) Rees, M.J., & Mészáros, P. 1998, ApJ, 496, L1
- Wijers, Rees, & Mészáros (1997) Wijers, R.A.M.J., Rees, M.J., & Mészáros, P. 1997, MNRAS, 288, L51
- Woosley et al. (1998) Woosley, S.E., Eastman, R.G., & Schmidt, B.P. 1998, ApJ in press (astro-ph/9806299)
Note.1: The late-time optical light curve of model CO138 is calculated by extending the exponential decay of the light curve of the same model as presented in Iwamoto et al. (1998). The previous version of the light curve was not accurate enough, and has been replaced by a correct one.
Note.2: The positions of the two NFI X-ray sources have been revised (GCN Circ. 155, which says that “one of the NFI sources was at 50” from SN 1998bw and therefore consistent with it”). A following GCN Circular (No.158) reported that the flux from the ’consistent source’ has shown a moderate decay ( approximately by a factor of two from April-May to November in 1998). The slow decline could be a possible sign of circumstellar interaction in SN 1998bw(Note that the last statement is merely our guess yet).
| Time | Energy Band (keV) | Flux (or Fluence) | Source |
|---|---|---|---|
| 0-25 s | 24-1,820 | erg s-1 | CGRO BATSE1 |
| 0-30 s | 2-28 | 3 Crab | BeppoSAX WFC No.22 |
| 1 d | 2-10 | erg s-1 cm-2 | BeppoSAX NFI2,3 |
| d | 2-10 | erg s-1 cm-2 | BeppoSAX NFI2,3 |
| 6 d | 2-10 | erg s-1 cm-2 | BeppoSAX NFI2,3 |