Analytic Relations between the Observed Gravitational
Microlensing Parameters With and Without the Effect of Blending
Abstract
When a microlensing light curve is contaminated by blended light from unresolved stars near the line of sight to the lensed star, the light curve shape and corresponding parameterization for the event will differ from the values expected when the event is not affected by blending. As a result, blending makes it difficult to identify the major lens population and to estimate the amount of lensing matter. In order to estimate the effect of blending on the result of lensing experiments, it is, therefore, essential to know how the observed lensing parameters change depending on the fraction of blended light. Previously, the changed lensing parameters were obtained with a statistical method that not only required a large amount of computation time but also was prone to uncertainty. In this paper, we derive analytic relations between the lensing parameters with and without the effect of blending. By using these relations, we investigate the dependence of the observed lensing parameters on the amount of blended light, the impact parameter, and the threshold amplification for event detection.
keywords:
gravitational lensing – dark matter – photometry1 Introduction
Following the proposal of Paczyński (1986), searches for Massive Astronomical Compact Objects (MACHOs) by detecting light variations of stars caused by gravitational microlensing are being carried out by several groups (MACHO, Alcock et al. 1997; EROS, Ansari et al. 1996; OGLE, Udalski et al. 1997).
When an isolated source star is gravitationally microlensed, its flux is amplified by an amount
where is the lens-source separation in units of the angular Einstein ring radius, . The lensing parameters , , and represent the time of maximum amplification, the lens-source impact parameter in units of , and the Einstein ring radius crossing time (Einstein time scale), respectively. These parameters are obtained by fitting model light curves in equation (1.1) to the observed one. Among these parameters, the Einstein time scale is related to the physical parameters of the lens by
where is the mass of the lens, is the lens-source transverse velocity, , , and are the separations between the observer, lens, and source star, and is the physical size of the Einstein ring radius. Since the Einstein time scale results from the combination of the physical parameters of the lens, it is difficult to obtain information about these parameters of individual lenses. However, one can still obtain information about the major population of lenses from the distribution of Einstein time scales by modeling the distribution and motion of lens matter constrained from other types of observation (Han & Gould 1996; Gould 1996; Zhao, Rich, & Spergel 1996; Han & Chang 1998). In addition, from the comparison of the experimentally determined optical depth, which is proportional to the summation of the Einstein time scales of individual events, i.e. , to the theoretically expected value, experiments toward Magellanic Clouds allow one to constrain the MACHO dark matter fraction in the Galactic halo.
However, the observed light curves of a significant fraction of lensing events will differ from the light curve in equation (1.1). This is because current lensing experiments are being conducted toward very dense star fields such as the Magellanic Clouds and the Galactic bulge. While searches towards these crowded fields result in an increased event rate, it also implies that many of the observed light curves are blended by the light from unresolved stars that are not being lensed. When an event is affected by blending, the observed light curve becomes
where is the unblended and unamplified flux of the lensed star and is the amount of blended light. The problem of blending is that it is very difficult to detect the presence of a blend, and practically impossible to correct for the effect by purely photometrical means (Woźniak & Paczyński [1997], see also Figure 2 for example blended light curves and the corresponding degenerate unblended light curves). Since blending makes the observed parameters of an event differ from the values expected when the event is not affected by blending, blending leads to misidentification of the major lens population. In addition, the MACHO fraction determined from the lensing optical depth will be subject to great uncertainty. Throughout this paper, we consistently use term ‘observed lensing parameters’ to represent the lensing parameters determined from a blended light curve not knowing it is affected by blending.
Blending can be classified into several types depending on the origin of the blended light. The first type, regular blending, occurs when a bright source star registered on a template plate is lensed and its flux is affected by the light from faint unresolved stars below the detection limit imposed by crowding. Second, lens blending occurs when the origin of the blended light is the lens itself (Kamionkowski 1995; Buchalter & Kamionkowski 1997; Nemiroff 1997; Han 1998). Third, amplification-bias blending occurs when one of several unresolved faint stars in the seeing disk of a reference star is lensed, and the flux of the lensed star is associated with the flux from other stars in the integrated seeing disk (Nemiroff 1994; Han 1997a; Alard 1997). Finally, if a source is composed of binaries and only one of the component is gravitationally amplified, the light from the other binary component simply contribute as blended light: binary-source blending (Griest & Hu 1992; Dominik 1998; Han & Jeong 1998).
In order to estimate the effects of the individual types of blending on the results of lensing experiments, one has to know how the observed lensing parameters change depending on the fractions of blended light. One of the methods to determine the changed lensing parameters is statistically fitting a series of unblended light curves to the blended light curve of interest (e.g., Woźniak & Paczyński 1997). In this case, determining the parameters requires a large amount of computation time for fitting process. Furthermore, for the full analysis of the blending effect, one should repeat the same procedure for events with all combinations of lensing parameters. In addition, there are inevitable statistical uncertainties that accompany the use of this method. Di Stefano & Esin (1995) attempted to develop analytic formalism for the treatment of blending. However, their so-called “blended Einstein ring radius” quantifies only how the maximum allowed impact parameter of lens-source encounter for event detection changes as a function of blended light fraction (see § 2). Since all information about lenses are obtained from lensing parameters, especially the Einstein time scale, simple analytic relations between the lensing parameters with and without blending will be very useful for the estimation of blending effect on the result of lensing experiments.
In this paper, we derive these relationships and use the relations to investigate the dependence of the observed lensing parameters on the amount of blended light, the impact parameter, and the threshold amplification for event detection.
2 Changes in Lensing Parameters Due to Blending
The shape of a microlensing event light curve is characterized by its height (peak amplification ) and width (event duration ), which are dependent on the lensing parameters: for the height (see equation [2.2]) and and for the width (see equation [2.5]). Because of the change in the peak amplification due to blending, the observed impact parameter differs from the value determined from unblended light curve. Without blending, the impact parameter is related to the peak amplification of the unblended light curve by
When the event is affected by blending, on the other hand, the observed peak amplification decreases into
As a result, the impact parameter obtained by ignoring blending effect becomes dependent on the amount of the blended light by
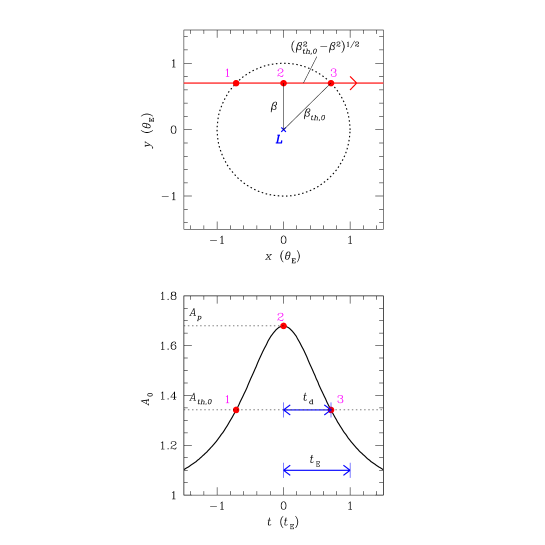
Not only the peak amplification, but also the event duration is affected by blending. As an event is always amplified by more than 1 by definition, we define the event duration by half of the time a given event has an amplification greater than some threshold amplification of . 111 To avoid confusion, we note the difference between the event duration, , and the Einstein time scale, . For an unblended event detected with a threshold amplification of , represent the half of time for the source to stay within the Einstein ring while is the time scale for a source to cross the Einstein ring radius. The longest source star trajectory within the Einstein ring is the Einstein ring diameter. Therefore, the two time scales become equal only when the source crosses the center of the Einstein ring, but otherwise is always less than . For a given threshold amplification for event detection, the maximum allowed impact parameter (threshold impact parameter) is determined by
For example, if the adopted threshold amplification is , the threshold impact parameter becomes . According to this definition of a detectable microlensing event, the source star should enter the Einstein ring. However, since the threshold amplification can be different values depending on the observational strategy and corresponding event selection criteria, we leave the threshold amplification as a variable. From the definition of the threshold impact parameter as , one finds that the duration of an unblended event is related to the threshold amplification and the unblended lensing parameters by
In Figure 1, to visualize the definitions of , , and and the relation between and , we present the geometry of a lens system for an unblended event (upper panel) and the resulting light curve (lower panel). In the upper panel, the source star trajectory is represented by a straight line. In the lower panel, the peak amplification () and the threshold amplification () are represented by dotted lines. The Einstein time scales () and the event duration () are marked by thick solid lines with arrows.
On the other hand, if the event is affected by blending, the same event must have a higher amplification because blending increases the threshold amplification to:
Blending also decreases the observed duration of the event to:
where
is the decreased threshold impact parameter caused by the increased threshold amplification in the presence of blending. We note that the formula of so-called “blended Einstein ring” of Di Stefano & Esin (1995) is identical to our threshold impact parameter in equation (2.8) for a special case for .
As a result of the changes in the impact parameter and the duration of event, the Einstein time scale also changes. Not knowing an event is affected by blending, one will obtain the Einstein time scale from the relation in equation (2.5), but based on the observed impact parameter and the duration of event by
In the equation, the threshold impact parameter is included instead of the decreased value of due to blending, because one still thinks he (or she) consistently applied the same threshold impact parameter of . Since the observed duration of the event is related to the unblended lensing parameters by equation (2.7), one obtains the relation between the Einstein time scales with and without blending by
where the definitions of the various types of impact parameter of , , , and are given in equations (2.1), (2.3), (2.4), and (2.8).
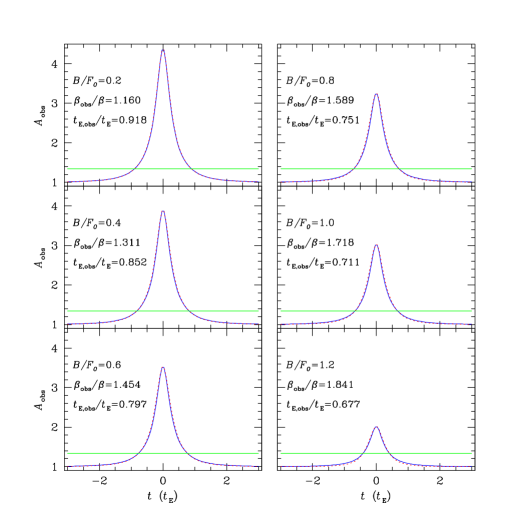
In Figure 2, we present several illustrative light curves with blending (solid curves) and the corresponding degenerate unblended light curves (dotted curves) whose lensing parameters (i.e., and ) are determined by our derived relations in equations (2.3) and (2.10). All of these events have the same unblended impact parameter and the adopted threshold amplification is (represented by a solid line). The fraction of blended light and the fractional changes in the lensing parameters with and without blending are marked in each panel. As shown by Woźniak & Paczyński (1997), the light curves of blended events are very well fit by unblended light curves of different lensing parameters.
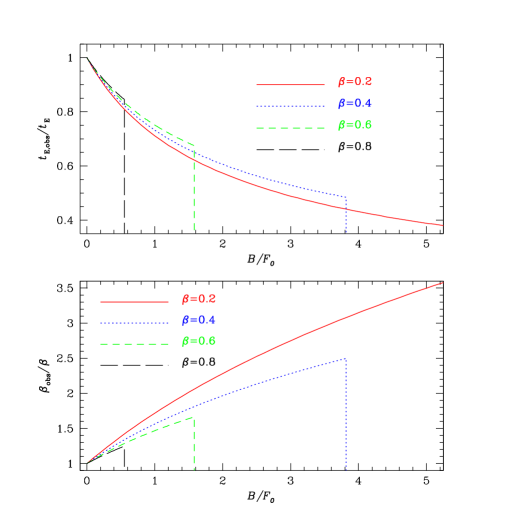
With the derived analytic relations, the effects of blending on the observed lensing parameters can be computed explicitly. We compute these changes in the lensing parameters due to blending with the equations derived above for the impact parameter (2.6) and for the Einstein time scale (2.10). Figure 3 shows how these parameters vary as a function of the blended light fraction for different values of the impact parameter. To compute the observed lensing parameters, we assume that the threshold amplification for event detection is . In the figure, the relation becomes discontinuous above a certain value of because events affected by more blending than this amount cannot be amplified higher than and thus cannot be detected. As expected, one finds that the observed Einstein time scale decreases and the observed impact parameter increases as the fraction of blended light increases. We note, however, that although these qualitative trends of the changes in the observed lensing parameters due to blending are already known (Di Stefano & Esin 1995; Alard & Guibert 1997; Han 1997b; Goldberg 1998) and numerical quantification based on statistical methods was performed (Woźniak & Paczynski 1997), our derivation is the first to analytically quantify these changes.
Another interesting result from Figure 3 is that the observed lensing parameters depend in different ways on for different values of the unblended impact parameter . This is because even for events with the same Einstein time scale and the same fraction of blended light, the peak amplification and the duration of the event increase as the impact parameter decreases. The decrease in and the increase in become more important for events with smaller impact parameters, implying that blending is more important for events with higher amplifications.
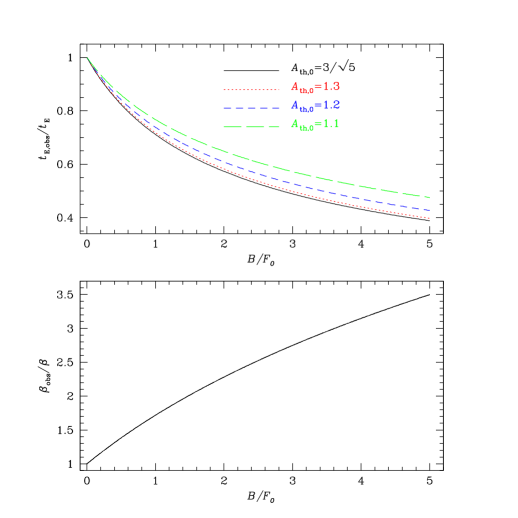
We also find that the observed Einstein time scale depends differently on the fraction of blended light for different values of the adopted threshold amplification. Figure 4 shows how changes for different values of for an example event with . From the figure, one finds that as the threshold amplification increases, the decrease in the observed Einstein time scale becomes more important. This is because by increasing the threshold amplification the observed duration of an event decreases, while the unblended Einstein time scale remains the same regardless of the adopted . Unlike the Einstein time scale, however, the observed impact parameter has the same dependency on regardless of the adopted values of . This is because is determined solely from the peak amplification, which does not depends on the adopted .
3 Conclusion
We have derived analytic relations for the observed microlensing parameters with and without the consideration of blending effect. We have used these relations to investigate the dependence of the observed lensing parameters on the fraction of blended light for events with various values of impact parameters under various selection criteria. The results of this investigation are as follows:
-
1.
The observed Einstein time scale decreases and the impact parameter increases with an increasing fraction of blended light. Although these trends in the observed lensing parameters are already known, this derivation is the first to analytically quantify this effect.
-
2.
The observed lensing parameters depend in different ways on the fraction of blended light for events with different impact parameters. These changes in the observed lensing parameters are more important for events with smaller impact parameters, implying that the effects of blending becomes more important for events with higher amplifications.
-
3.
The observed Einstein time scale depends on the threshold amplification for event detection. With increasing value of the adopted threshold amplification, the decrease in the observed Einstein time scale becomes more important. However, the observed impact parameter has the same dependence regardless of the adopted threshold amplification.
Acknowledgments
We would like to thank P. Martini for a careful reading of the manuscript.
References
- [1] Alard, C. 1997, A&A, 321, 424
- [2] Alard, C., & Guibert, J. 1997, A&A, 326, 1
- [3] Alcock, C., et al. 1997, ApJ, 479, 119
- [4] Ansari, R., et al. 1996, A&A, 314, 94
- [5] Buchalter, A., & Kamionkowski, M. 1997, ApJ, 482, 782
- [6] Di Stefano, R., & Esin, A. A. 1995, ApJ, 448, L1
- [7] Dominik, M. 1998, A&A, 333, 893
- [8] Goldberg, D. M. 1998, ApJ, 498, 156
- [9] Gould, A. 1996, PASP, 108, 465
- [10] Griest, K., & Hu, W. 1992, ApJ, 397, 362
- [11] Han, C. 1997a, ApJ, 484, 555
- [12] Han, C. 1997b, ApJ, 490, 51
- [13] Han, C. 1998, ApJ, 500, 569
- [14] Han, C., & Chang, K. 1998, MNRAS, 299, 1040
- [15] Han, C., & Gould, A. 1996, ApJ, 467, 540
- [16] Han, C., & Jeong, Y. 1998, MNRAS, 301, 231
- [17] Kamionkowski, M. 1995, ApJ, 442, L9
- [18] Nemiroff, R. J. 1994, ApJ, 435, 682
- [19] Nemiroff, R. J. 1997, ApJ, 486, 693
- [20] Paczyński, B. 1986, ApJ, 304, 1
- [21] Udalski, A., et al. 1997, Acta Astron., 47, 169
- [22] Woźniak, P., & Paczyński, B. 1997, ApJ, 487, 55
- [23] Zhao, H., Rich, R. M., & Spergel, D. N. 1996, MNRAS, 282, 175